RELIABILITY MODELING AND ANALYSIS OF CYBER ENABLED ELECTRIC POWER SYSTEMS
A Dissertation by
HANGTIAN LEI
Submitted to the Office of Graduate and Professional Studies of Texas A&M University
in partial fulfillment of the requirements for the degree of DOCTOR OF PHILOSOPHY
Chair of Committee, Chanan Singh Committee Members, Le Xie
Alex Sprintson Sergiy Butenko Head of Department, Miroslav M. Begovic
May 2016
Major Subject: Electrical Engineering
ABSTRACT
Cyber-induced failures affect power system reliability and thus are important to be considered in composite system reliability evaluation. This dissertation extends the scope of bulk power system reliability modeling and analysis with the consideration of cyber elements.
A novel methodology by introducing the concept of Cyber-Physical Interface Matrix (CPIM) is proposed. The failure modes of cyber components and their impact on transmission line tripping behaviors are modeled and numerically analyzed as an
example to illustrate the construction and utility of the CPIM. The methodology is then enhanced and implemented on an extended Roy Billinton Test System (RBTS) with its applicability for large systems illustrated. The results clearly show the impact of cyber-induced failures on system-wide reliability indices. The CPIM is the critical idea in the proposed methodology. It decouples the analysis of the cyber part from the physical part and provides the means of performing the overall analysis in a tractable fashion. The overall methodology proposed in this dissertation also provides a scalable option for reliability evaluation of large cyber-physical power systems.
The efficiency of the overall methodology can be further improved with the use of non-sequential Monte Carlo techniques. However, the failure and repair processes in cyber-induced events are inherently sequential involving dependent failures, making it difficult to utilize non-sequential sampling methods as simply as when the components are independent. In this dissertation, the difficulties of using sampling when there are
iii
dependent failures are thoroughly explored. An approach is proposed to overcome the difficulties by generating a representative state space and its probabilities from which states can be sampled. The proposed approach not only preserves the sequential and dependent features of cyber-induced events but also improves the efficiency, which is very beneficial for reliability evaluation of large power systems in the presence of cyber-induced dependent failures.
ACKNOWLEDGEMENTS
I would like to express my special thanks to my advisor, Dr. Chanan Singh, for his guidance and support throughout my research at Texas A&M University.
I gratefully appreciate the time, support, and comments from my committee members, Dr. Le Xie, Dr. Alex Sprintson, and Dr. Sergiy Butenko.
Sincere acknowledgements are extended to the faculty and staff, as well as my friends and colleagues, at Texas A&M University for their assistance and
encouragement.
Also, I would like to thank my friends and colleagues at Entergy for their help during my two internships. The industry experience I gained at Entergy is very helpful.
This research was partly supported by the Power Systems Engineering Research Center (PSERC) under the grant “Reliability Assessment and Modeling of Cyber Enabled Power Systems with Renewable Sources and Energy Storage (T-53)” and by NPRP grant # NPRP 7-106-2-053 from the Qatar National Research Fund (a member of Qatar Foundation). I would like to acknowledge the support from all the sponsors.
v
NOMENCLATURE
CB Circuit Breaker
CEM Consequent Event Matrix
CPIM Cyber-Physical Interface Matrix
CPU Central Processing Unit
CT Current Transformer
EENS Expected Energy Not Supplied
EFLC Expected Frequency of Load Curtailment GOOSE Generic Object Oriented Substation Event
HMI Human Machine Interface
ICT Information and Communication Technology IEC International Electrotechnical Commission IED Intelligent Electronic Device
IEEE Institute of Electrical and Electronics Engineers
LOLE Loss of Load Expectation
LOLP Loss of Load Probability
MRT Mean Repair Time
MTTF Mean Time To Failure
MU Merging Unit
PB Process Bus
PT Potential Transformer
RBTS Roy Billinton Test System
RTS Reliability Test System
SAS Substation Automation System
SCADA Supervisory Control and Data Acquisition
λi Failure rate of individual component i µi Repair rate of individual component i
vii TABLE OF CONTENTS Page ABSTRACT ...ii ACKNOWLEDGEMENTS ... iv NOMENCLATURE ... v
TABLE OF CONTENTS ...vii
LIST OF FIGURES ... ix
LIST OF TABLES ... xi
1. INTRODUCTION ... 1
1.1 Background and Scope ... 1
1.2 Literature Review ... 2
1.3 Research Objectives and Procedures... 4
1.4 Organization of the Dissertation ... 5
2. SUBSTATION LEVEL RELIABILITY MODELING AND ANALYSIS ... 7
2.1 Introduction ... 7
2.2 Protection Systems Using IEC 61850 ... 9
2.3 Reliability Analysis of the Integrated System ... 14
2.4 Summary ... 38
3. RELIABILITY ANALYSIS OF MODERN SUBSTATIONS CONSIDERING CYBER-LINK FAILURES ... 39
3.1 Introduction ... 39
3.2 System Configuration and Parameters ... 40
3.3 Reliability Analysis ... 48
3.4 Results and Discussions ... 51
3.5 Summary ... 55
4. COMPOSITE POWER SYSTEM RELIABILITY EVALUATION CONSIDERING CYBER-MALFUNCTIONS IN SUBSTATIONS ... 56
4.2 Methodology Outline and Objectives ... 58
4.3 Test System Configuration ... 62
4.4 Reliability Analysis ... 72
4.5 The Scalability of the Overall Methodology ... 86
4.6 Considerations in Software Implementation for Large Power Systems ... 87
4.7 Summary ... 90
5. NON-SEQUENTIAL MONTE CARLO SIMULATION FOR CYBER-INDUCED DEPENDENT FAILURES IN COMPOSITE POWER SYSTEM RELIABILITY EVALUATION ... 92
5.1 Introduction ... 92
5.2 Origination of Dependent Failures ... 94
5.3 Problem of Applying Non-sequential Sampling for Dependent Failures ... 97
5.4 Proposed Method... 105
5.5 Case Studies ... 109
5.6 Summary ... 113
6. CONCLUSIONS AND OUTLOOK ... 115
6.1 Contributions and Research Conclusions ... 115
6.2 Outlook ... 116
ix
LIST OF FIGURES
Page
Figure 1. Typical architecture of an IEC 61850 based substation automation system. ... 9
Figure 2. An IEC 61850 based protection system for a 230-69 kV substation. ... 11
Figure 3. The reliability block diagram of the line protection unit. ... 13
Figure 4. The states diagram for an individual component. ... 15
Figure 5. The states diagram of the process bus. ... 17
Figure 6. A composite system consisting of a substation and other components. ... 32
Figure 7. An example of random number mapping. ... 37
Figure 8. The physical part of the test system. ... 42
Figure 9. The integrated test system. ... 43
Figure 10. The cyber part of substation 1. ... 46
Figure 11. Single line diagram of the RBTS. ... 63
Figure 12. The protection system for bus 3. ... 68
Figure 13. The protection system for bus 4. ... 68
Figure 14. The protection system for bus 5. ... 69
Figure 15. State transition diagram of individual element. ... 70
Figure 16. State transition diagram of the process bus. ... 71
Figure 17. EENS comparison at each bus. ... 83
Figure 18. Relationship between switching time and system EENS. ... 85
Figure 19. An example of sampling. ... 98
Figure 20. A three-component system. ... 99
Figure 21. The system state space diagram for completely independent scenario. ... 100
Figure 23. The state transition diagrams for partially independent scenario. ... 102
Figure 24. The system state space diagram for partially independent scenario. ... 102
Figure 25. The system state space diagram for fully dependent scenario. ... 104
Figure 26. The system state space diagram for an actual power system. ... 106
Figure 27. Expression of the proposed method. ... 108
Figure 28. Relationship between EENS and selected sample size (Ne). ... 112
Figure 29. Relationship between coefficient of variation (β’) and selected sample size(Ne). ... 113
LIST OF TABLES
Page
Table 1 Substation protection zone division ... 12
Table 2 Reliability data for individual components ... 13
Table 3 Reliability data for protection units ... 14
Table 4 Probability data for individual components ... 16
Table 5 Summary of scenarios of the line fault clearance at A ... 21
Table 6 Summary of scenarios of the line fault clearance at B ... 21
Table 7 Summary of scenarios of the line fault clearance at I ... 21
Table 8 Summary of scenarios of the line fault clearance at J ... 22
Table 9 Summary of scenarios of the transformer fault clearance at E ... 24
Table 10 Summary of scenarios of the transformer fault clearance at F ... 25
Table 11 Summary of scenarios of the bus fault clearance at C ... 28
Table 12 Summary of scenarios of the bus fault clearance at D ... 29
Table 13 Summary of scenarios of the bus fault clearance at G ... 29
Table 14 Summary of scenarios of the bus fault clearance at H ... 30
Table 15 Elements of matrix M ... 31
Table 16 Components in the composite system ... 33
Table 17 Generation and load capacities ... 42
Table 18 Cyber component names and meanings ... 44
Table 19 Reliability data for components ... 45
Table 20 Communication path failure probabilities ... 48
Table 21 The consequent event matrix ... 52
Table 23 Effect of main path failure on successful operation for line 1 ... 54
Table 24 Bus data ... 64
Table 25 Generating unit data ... 64
Table 26 Transmission line physical parameters ... 66
Table 27 Transmission line outage data ... 67
Table 28 Reliability data for protection system elements ... 70
Table 29 The cyber-physical interface matrix for bus 3 ... 76
Table 30 The consequent event matrix for bus 3 ... 76
Table 31 The cyber-physical interface matrix for bus 4 ... 77
Table 32 The consequent event matrix for bus 4 ... 77
Table 33 The cyber-physical interface matrix for bus 5 ... 77
Table 34 The consequent event matrix for bus 5 ... 78
Table 35 Reliability indices for buses ... 81
Table 36 Simulated transmission line failure rates ... 82
Table 37 EENS comparison ... 83
Table 38 Effect of switching time on system EENS ... 85
Table 39 The format of a cyber-physical interface matrix ... 95
1. INTRODUCTION
1.1 Background and Scope
The quantitative reliability indices of bulk power systems are important to utility companies, vendors, and regulators for planning, operation, maintenance, and regulatory purposes. Studies of bulk power system reliability evaluation have been mostly focusing on the current-carrying part. The pertinent theories and methodologies are well
established and documented [1]-[3].
Information and Communication Technologies (ICTs) are widely deployed in electric power systems to improve system control, protection, monitoring, and data processing capabilities. ICT functionalities are generally assumed to be perfectly reliable in the process of composite power system reliability evaluation. This assumption may have significant effect on the reliability indices calculated and result in too optimistic reliability evaluation. For realistic reliability evaluation, it is necessary to consider ICT failures and their impact on composite power systems.
This research aims at extending the scope of bulk power system reliability modeling and analysis with the consideration of cyber elements. In particular, a novel methodology with the use of Cyber-Physical Interface Matrix (CPIM) is proposed and
*Part of this section is reprinted from Electric Power Systems Research, vol. 129,
Hangtian Lei and Chanan Singh, “Power system reliability evaluation considering
demonstrated. The CPIM decouples the analysis of cyber system from the evaluation of the physical system and provides the means of performing the overall analysis in a tractable fashion.
In this dissertation, the term “cyber” refers to the devices and activities residing in the secondary side of the power system, associated with the functionalities of
measurement, control, monitoring, and protection. The term “physical” refers to the equipment and activities in the primary side of the power system, associated with the generation, transmission, and distribution of electric power and energy. A whole power system is also referred to as a “cyber-physical power system”, in which the
communication networks and power components are interdependent [4]-[6]. The cyber-physical interdependencies exist extensively in power systems and associate with various aspects. This dissertation focuses on the aspect of protection as a facet to study such interdependencies since protection system hidden failures are recognized as common causes of multiple or cascading outages [7]-[10].
1.2 Literature Review
A protection system consists of circuit breakers, current and voltage
transformers, communication cables, protective relays, and possibly some auxiliary devices [11]-[13]. With the advent of microprocessor-based relays and the rapid progress of communication technologies, modern protection panels are equipped with
multifunctional Intelligent Electronic Devices (IEDs) that are connected to communication networks [14]-[17].
Some studies [8], [10], [18]-[22] have been done to consider protection system failures in composite power system reliability evaluation. However, due to the variety of protection system architectures as well as the diversity of control and communication mechanisms, it is hard to explicitly model protection systems with detailed
configurations. As a result, in most of the previous work, protection system failures were either concentrated on circuit breaker trip mechanisms [10], [18] or represented
abstractly by multistate models [8], [19]-[22], in which the protection system was treated as a compact object. Some important technical details inside the protection system, such as the placement of cyber elements (e.g., CT/PTs, MUs, and IEDs) and their wire connections, were absent in those publications. Due to the absence of such details, the interdependencies between cyber elements and physical components were not
sufficiently covered. In [4] and [5], to study the direct and indirect cyber-physical interdependencies, some mathematical terms and operations were defined and proposed with applications on small test systems including monitoring, control, and protection features. The results in [4] and [5] provide valuable information that indicates the impact of cyber element failures on physical system reliability indices. However, excessive self-defined reliability terms and tedious mathematical operations were introduced in [4] and [5]. These terms are hardly available from engineering practice, making it difficult to implement the overall methodology in practical applications. Therefore, it is necessary to develop a novel reliability evaluation methodology that is scalable for applications in
large cyber-physical power systems. Furthermore, non-sequential Monte Carlo methods are typically easier to implement and require much less CPU time and memory as compared to sequential methods [3], [23], [24]. It would be significantly beneficial for the application of developed methodology in large systems if the efficiency is further improved with the use of non-sequential techniques, although it is difficult to utilize non-sequential sampling methods as simply as when the components are independent due to the inherently chronological, causal and dependent features of the failure and repair processes in the presence of cyber-induced dependent events.
1.3 Research Objectives and Procedures
The major objective of this research is to develop novel methodologies to model and evaluate the reliability of composite cyber-physical power systems, which consist of current-carrying part and cyber components, in an integrative manner. The scope is to focus on substation protection systems as these are very critical to the success of power delivery. To illustrate and implement the methodologies, standard reliability test systems are extended with substation protection systems considering modern features.
Furthermore, the possibilities of utilizing non-sequential techniques for efficiency improvement are researched. The following are detailed procedures of this research:
1) Formulate a novel methodology with the use of Cyber-Physical Interface Matrix (CPIM) which decouples the analysis of cyber part from the physical
physical components, analyze the cyber failure modes and their impact on physical part, obtain the interface matrix, and illustrate the utility of the interface matrix in a composite power system.
2) Include more technical considerations, such as cyber-link failures, in the substation protection system model.
3) Extend a standard reliability test system with modern substation protection configurations, enhance and implement the proposed reliability evaluation methodology with the use of CPIM to obtain numerical reliability indices. 4) Improve the efficiency of the proposed methodology with the use of
non-sequential techniques.
1.4 Organization of the Dissertation
The remainder of this dissertation is organized as follows. Section 2 proposes a novel methodology with the use of Cyber-Physical Interface Matrix (CPIM) and
performs reliability modeling and analysis at the substation level. Section 3 enhances the substation model with consideration of cyber-link failures. Section 4 enhances and implements the proposed methodology on an extended standard reliability test system to obtain system-wide reliability indices. Section 5 researches the major difficulties of applying conventional non-sequential sampling methods to generating appropriate state space in the presence of dependent failures and proposes a method to overcome these
difficulties. The conclusions and outlook are given in Section 6. References are attached at the end.
2. SUBSTATION LEVEL RELIABILITY MODELING AND ANALYSIS
2.1 Introduction
The electric power substations are vital nodes among electric power generation, transmission, and distribution systems. In recent years, utilities, vendors, and research institutions have paid close attention to the reliability of substation automation systems (SASs) since the failure or malfunctioning of a SAS may have a huge impact on a power system.
The electric power SAS was designed in the past using control and protection schemes with electromechanical and hard-wired relay logic [15]. This architecture has undergone significant changes with the advent of multi-functional microprocessor-based Intelligent Electronic Devices (IEDs). Traditional panels with dedicated stand-alone relays, control switches, meters, and status indicators have been replaced by multi-functional, smart, and communicative IEDs [16].
IEC 61850, the international standard for substation automation, provides
interoperability between IEDs from different vendors by standardizing the aspects of the information exchange between them [25]. The vision of IEC 61850 series is to define an
Part of this section is reprinted from copyrighted material with permission from IEEE.
2014 IEEE. Reprinted, with permission, from Hangtian Lei, Chanan Singh, and Alex Sprintson, “Reliability modeling and analysis of IEC 61850 based substation protection systems,” IEEE Trans. Smart Grid, vol. 5, no. 5, pp. 2194-2202, Sep. 2014.
interoperable communication system, which facilitates the implementation of functions that are distributed among various IEDs from different vendors [15].
Some progress has been made recently in the reliability evaluation of substation automation systems. In [26], reliability indices have been investigated and selected to identify the critical components in an all-digital protection system. The challenges for implementing IEC 61850 based new communication architecture were discussed and some possible solutions to several major implementation issues were suggested in [27]. In [28], the reliability block diagram approach was used to evaluate the reliability and availability of practical Ethernet switch architectures for the SASs.
However, most of the previous publications focused on either the physical
components (e.g., transformers, circuit breakers, and transmission lines) or the cyber part separately. In [29], the cyber and physical parts of a SAS were integratively analyzed, but different bays were analyzed separately at a conceptual level, which may not be always true in practice. To overcome this shortcoming, a specific cyber-physical system of a typical substation is designed and analyzed using the methodology proposed in this section. Furthermore, the concept of Cyber-Physical Interface Matrix (CPIM) is
introduced and its utility is illustrated. The CPIM depicts the inter-dependencies among the failures of different physical components due to various cyber failure modes. It decouples the analysis of the cyber part from the physical part and provides the means of performing the overall analysis in a computationally tractable way.
IEC 61850 based substation layout, including both physical and cyber parts, is presented. In Section 2.3, a general technique for cyber-physical system reliability analysis is presented, the detailed analysis for a substation is performed, and the CPIM is obtained. The utilization of the interface matrix is then illustrated by incorporating this substation into a composite power system. Section 2.4 is the summary of Section 2.
2.2 Protection Systems Using IEC 61850
2.2.1 IEC 61850 Hierarchy and Architecture
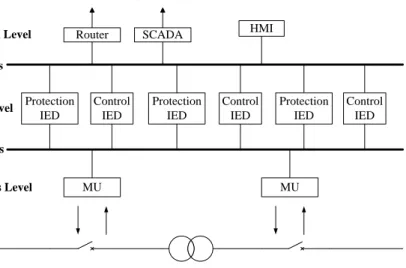
A typical architecture of the IEC 61850 based SAS, which consists of three levels, is shown in Figure 1.
Control IED Protection IED Protection IED Control IED Protection IED Control IED MU MU Router HMI Control Center Process Level Bay Level Station Level Process Bus Station Bus SCADA
Process level: This level includes Current Transformers (CTs) / Potential Transformers (PTs), Merging Units (MUs), actuators, etc. The voltage and currents signals acquired by CTs / PTs are digitized by MUs and sent over the Ethernet network to the bay level.
Bay level: This level includes microprocessor based relays (also known as
protection IEDs) and bay controllers (control IEDs). Protection IEDs receive information coming from the process level, conduct elaborate calculations and send decision signals over the Ethernet network.
Station level: Station level includes the Human Machine Interface (HMI) and SCADA system. At this level, the status data of various components in the substation are available to operators for monitoring and operation purposes. Operators can also issue signals at this level to perform certain kinds of manual control.
Process bus: The process bus enables the time critical communication between the process level and the bay level, which builds a bridge for voltage and currents information going from MUs to protection IEDs, and for trip signals going the opposite direction.
Station bus: The station bus enables information exchange between the bay level and station level, which makes the status data of the entire substation available to the control center for monitoring and operation purposes.
2.2.2 IEC 61850 Based Protection System Layout and Configuration
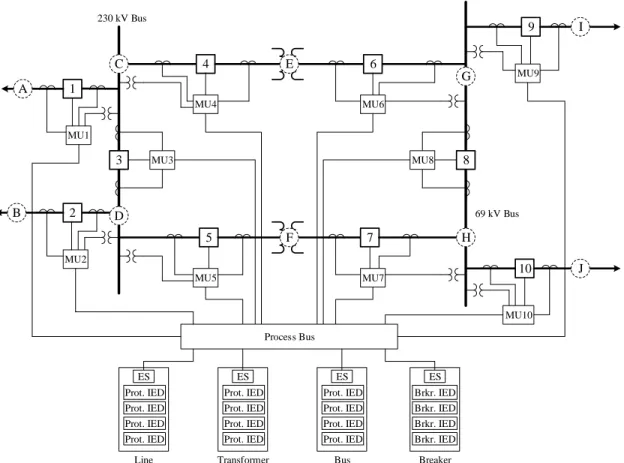
An IEC 61850 based protection system for a typical 230-69 kV substation is designed for the reliability analysis. The integrated system, including physical components (e.g., transformers, transmission lines, and circuit breakers) and cyber components (e.g., merging units, Ethernet switches, and Prot. IEDs), is shown in Figure 2. The physical part has been used in [30] to illustrate the protection zones and schemes. The cyber part is designed according to IEC 61850 standards [31].
3 8 4 6 5 7 1 2 9 10 MU4 MU5 MU6 MU7 MU3 MU8 MU1 MU2 MU9 MU10 Process Bus Prot. IED Prot. IED Prot. IED Prot. IED ES Prot. IED Prot. IED Prot. IED Prot. IED ES Prot. IED Prot. IED Prot. IED Prot. IED ES Brkr. IED Brkr. IED Brkr. IED Brkr. IED ES Line Protection Transformer Protection Bus Protection Breaker Control 230 kV Bus 69 kV Bus A B C D E F G H I J
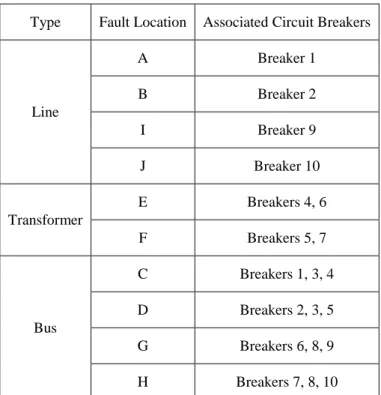
The primary protection zones associated with various fault locations and the corresponding circuit breakers needed to trip for fault clearances are listed in Table 1.
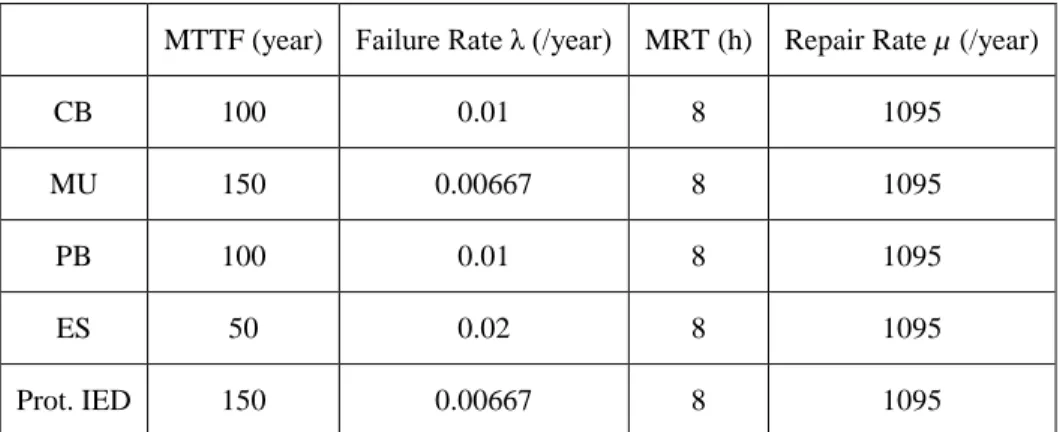
The MTTF [32] values of individual components for reliability calculations are obtained from [15], [28], [33]-[35] and tabulated in Table 2.
Table 1 Substation protection zone division
Type Fault Location Associated Circuit Breakers
Line A Breaker 1 B Breaker 2 I Breaker 9 J Breaker 10 Transformer E Breakers 4, 6 F Breakers 5, 7 Bus C Breakers 1, 3, 4 D Breakers 2, 3, 5 G Breakers 6, 8, 9 H Breakers 7, 8, 10
The MTTF varies for CBs at different voltage levels, or serving different
functions in the system [35], for the study in this section, a typical value of 100 years is chosen. Using MRT of 8 hours from [15] and [28], the failure and repair rates of individual components are tabulated in Table 2.
Table 2 Reliability data for individual components
MTTF (year) Failure Rate λ (/year) MRT (h) Repair Rate µ (/year)
CB 100 0.01 8 1095
MU 150 0.00667 8 1095
PB 100 0.01 8 1095
ES 50 0.02 8 1095
Prot. IED 150 0.00667 8 1095
For convenience of analysis, the ES and protection IEDs located at the same protection panel are combined into one line protection unit. Normally, for each
protection unit, redundant protection IEDs are equipped, hence, in the reliability block diagram shown in Figure 3, both the protection IEDs are shown in parallel and then in series with the ES. The reliability data after combination is shown in Table 3.
Prot. IED 1
Prot. IED 2
ES
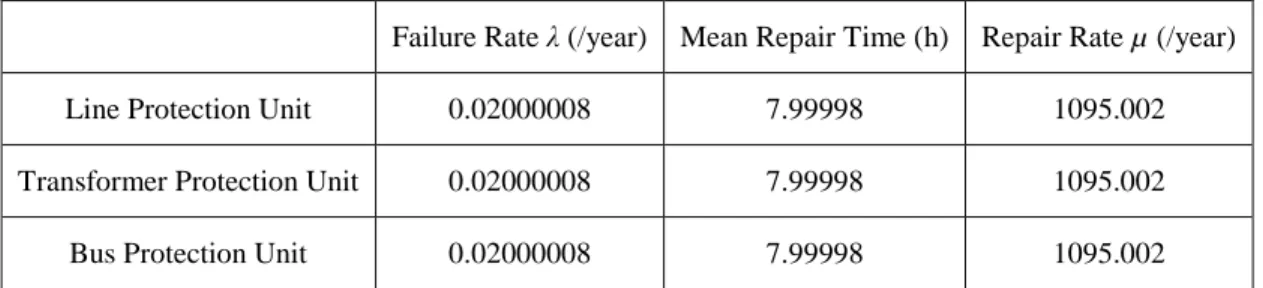
Table 3 Reliability data for protection units
Failure Rate λ (/year) Mean Repair Time (h) Repair Rate µ (/year)
Line Protection Unit 0.02000008 7.99998 1095.002
Transformer Protection Unit 0.02000008 7.99998 1095.002
Bus Protection Unit 0.02000008 7.99998 1095.002
2.3 Reliability Analysis of the Integrated System
2.3.1 A General Technique for Reliability Analysis of Cyber-Physical Systems
The complexity and dimensionality of substation automation systems make it difficult, if not impossible to conduct the reliability analysis of the whole system, physical and cyber, in a single step. Even for the current carrying part alone, it is not computationally efficient to model all the components distinctly and simultaneously. Therefore, it is necessary to perform the analysis sequentially.
Our proposed approach is formulated with the following steps:
1) Develop an interface matrix between the cyber and physical subsystems. This matrix is called Cyber-Physical Interface Matrix (CPIM). It defines the relationship between the cyber subsystems and physical subsystems in terms of failure modes and effects. In developing this matrix, the major interaction points between the cyber and physical part need to be identified.
3) Determine probabilities of interface events.
4) Analyze the physical system using the interface matrix.
An example of the Cyber-Physical Interface Matrix M is shown in (2.1). The elements of this matrix are the probabilities of interface events. In the following sections, the reliability analysis for the system shown in Figure 2 will be presented to illustrate the procedures of obtaining these probabilities.
M = [ 𝑝1,1 𝑝1,2 𝑝2,1 𝑝2,2 ⋯ 𝑝1,𝑛 𝑝2,𝑛 ⋮ ⋱ ⋮ 𝑝𝑚,1 𝑝𝑚,2 ⋯ 𝑝𝑚,𝑛 ] (2.1)
2.3.2 Individual Component Analysis
For each component (except the process bus) listed in Table 2, only two states, Up and Down, are considered in our study as shown in Figure 4.
UP DOWN
λ μ
Figure 4. The states diagram for an individual component.
The probabilities of being in the UP and DOWN states can be calculated using equations (2.2) and (2.3), respectively.
up p (2.2)
down p (2.3)The calculated probabilities for Circuit Breaker (CB), Merging Unit (MU), Line Protection Unit, Transformer Protection Unit, and Bus Protection Unit are tabulated in Table 4.
In an ideal environment that utilizes non-blocking switches and has prioritization mechanisms, the time of delay is negligibly small. However, in practice, delays might occur due to the use of legacy technology, such as bus Ethernet, which is still used in some substations, or due to the use of wireless technology.
Table 4 Probability data for individual components
Component pup pdown
Circuit Breaker (CB) 0.999990867 0.000009132 Merging Unit (MU) 0.999993912 0.000006088 Line Protection Unit 0.999981735 0.000018265 Transformer Protection Unit 0.999981735 0.000018265 Bus Protection Unit 0.999981735 0.000018265
Compared with fiber-optic communication, wireless communication technologies are more economically feasible for small-scale automation systems in rural areas. In wireless environments, the delays can be quite large due to the electromagnetic
interference in high voltage environments. Meanwhile, the radio frequency interference from wireless equipment can also affect the functioning of equipment [36], and GOOSE packets might be occasionally dropped by the network due to errors. Therefore, there is some finite probability that delay may happen in the network. Taking into account this probability, delay is modeled as a state of the process bus. Of course, the delay
probability can be set to zero if needed.
The state DELAY means that due to the temporarily heavy traffic, the process bus does not physically fail but the message transfer is delayed and the delay time is over the threshold value that causes the breakers associated with the primary protection zone fail to trip in time. The probability of delay given that the PB is not in the DOWN state is denoted by pd (=0.003). The state transition diagram of the PB is shown in Figure 5. UP DOWN λ μ DELAY
Figure 5. The states diagram of the process bus.
Thus, for the Process Bus (PB), the probabilities of being in the UP, DELAY, and DOWN states can be calculated using equations (2.4)-(2.6).
) 1 ( d up p p (2.4) d delay p p
(2.5)
down p (2.6)The reliability analysis of line, transformer, and bus fault clearances for the substation shown in Figure 2 are discussed in sections 2.3.3, 2.3.4, and 2.3.5, respectively.
Several assumptions are made:
1) The cable links between various devices and all the CT/PTs are assumed not to fail.
2) If the breaker(s) for the primary protection fail to trip correctly due to the message delay or due to the failure of the components other than the process bus, the trip signal can be transferred to an adjacent protection zone.
However, if the process bus fails, the entire system is assumed to fail. 3) If the primary protection fails to trip correctly and the trip signal is
transferred to an adjacent protection zone, the subsequent failure of the trip is not considered.
4) The fault events happening in different areas (e.g., areas A, E, and C) are analyzed independently. The possibility that faults occur simultaneously at different locations is not considered.
5) If the message delay at the process bus is beyond a threshold value, the
breaker(s) for the primary protection will fail to trip and the trip signal will be transferred to an adjacent protection zone.
2.3.3 Reliability Analysis of Line Fault Clearance
As shown in Figure 2, line faults can happen in areas A, B, I, or J. Here, the line fault at area A is taken as an example for illustration. The same techniques can be applied to faults at B, I, or J.
When a line fault happens at A, the voltage/current information will be sensed by PT/CTs and will be sent to MU1. The information will be digitized at MU1 and then be sent to Line Protection Unit via the PB. Based on the information received, relay
algorithms will be performed at the Line Protection Unit and a trip signal will be sent to Circuit Breaker 1 via the PB. There are 4 components associated with this procedure, namely, MU1, PB, Line Protection Unit, and CB1. One or more components’ failure will result in malfunction. The detailed descriptions of different scenarios are listed as below.
1) All components operate as intended
If all aforementioned components operate as intended, CB1 will trip in time, and only the faulted line will be isolated. The rest of the substation will stay in service.
2) PB fails to work
Since PB is the hub of all the cyber links inside the substation, the failure of PB will cause all the relays to be unable to receive or send information. All breakers will fail to trip and the entire system will be affected by the fault.
3) One or more components of MU1, Line Protection Unit, CB1 fail to operate
CB1 will not trip at first. When the fault comes to affect area C, bus protection will be triggered and CB1, CB3, CB4 will trip. Areas A and C will be out of service.
4) PB is in UP state, but message delay happens due to temporarily heavy information traffic
In this case, the tripping signal will not arrive at CB1 in time and thus CB1 will not trip before the breaker failure timer expires, bus protection for area C will then be triggered and CB1, CB3, CB4 will trip.
The probabilities and effects corresponding to each case are shown in Table 5. These probabilities are conditional and are calculated given that a fault has already happened at location A. To obtain the actual probabilities, they need to be multiplied by the probability of this fault occurrence.
Table 5 Summary of scenarios of the line fault clearance at A
Scenario No. Probability Areas Affected
1 0.996957511 A
2 0.000009132 Entire Substation
3 0.000033384 A, C
4 0.002999973 A, C
Table 6 Summary of scenarios of the line fault clearance at B
Areas Affected Probability
B 0.996957511
Entire Substation 0.000009132
B, D 0.003033357
Table 7 Summary of scenarios of the line fault clearance at I
Areas Affected Probability
I 0.996957511
Entire Substation 0.000009132
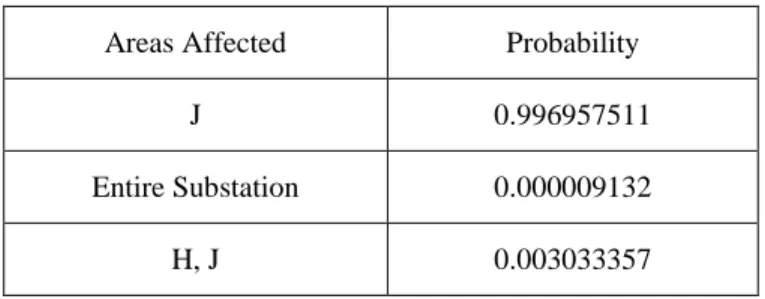
Table 8 Summary of scenarios of the line fault clearance at J
Areas Affected Probability
J 0.996957511
Entire Substation 0.000009132
H, J 0.003033357
Similarly, the probabilities and effects of line fault clearances at locations B, I, and J are shown in Tables 6-8, respectively.
2.3.4 Reliability Analysis of Transformer Fault Clearance
As shown in Figure 2, a transformer winding/ground fault can happen at areas E or F. Here, the transformer fault at E is taken as an example for illustration. The same techniques can be applied to faults at F.
When a transformer fault happens at E, the voltage/current information will be sensed by corresponding PT/CTs and will be sent to MU4 and MU6. The information will be digitized at these merging units and then will be sent to Transformer Protection Unit via the PB. Based on the information received, relay algorithms will be performed at Transformer Protection Unit and trip signals will be sent to CB4 and CB6 via the PB. There are 6 components associated with this procedure, namely, MU4, MU6, PB,
Transformer Protection Unit, CB4 and CB6. One or more components’ failure will result in malfunction. The detailed descriptions of different scenarios are listed as below.
1) All components operate as intended
If all aforementioned components operate as intended, CB4 and CB6 will trip as intended, only the faulted part E will be isolated and the rest of this substation will stay in service.
2) PB fails to work
Since PB is the hub of all the cyber links inside the substation, the failure of PB will cause all the relays to be unable to receive or send information, all breakers will fail to trip and the entire system will be affected by this fault.
3) One or more components of MU4, CB4 fail, while all other components work as intended
CB6 will trip as intended, but CB4 will not. When the fault affects area C, the bus protection will be triggered and CB1 and CB3 will trip. Areas C and E will be out of service.
4) One or more components of MU6, CB6 fail, while all other components work as intended
CB4 will trip as intended, but CB6 will not. When the fault affects area G, the bus protection will be triggered and CB8 and CB9 will trip. Areas E, G and I will be out of service.
5) Both CB4 and CB6 fail to trip due to breakers failure or PB delay, or failure of Transformer Protection Unit, but PB is not down
When the fault comes to affect areas C and G, protection devices of these zones will be triggered. Areas C, E, G, and I will be isolated from the system.
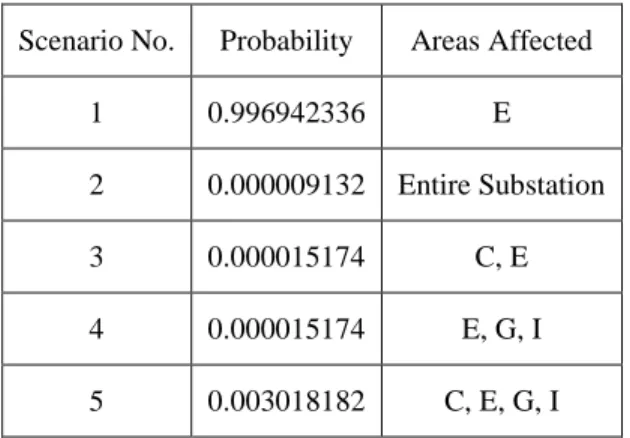
The probabilities and effects corresponding to each scenario are shown in Table 9. These probabilities are calculated given that a fault has already happened at location E. The actual probabilities need to be multiplied by the probability of this fault
occurrence.
Table 9 Summary of scenarios of the transformer fault clearance at E
Scenario No. Probability Areas Affected
1 0.996942336 E
2 0.000009132 Entire Substation
3 0.000015174 C, E
4 0.000015174 E, G, I
5 0.003018182 C, E, G, I
Similarly, the probabilities and effects of a transformer fault clearance at location F are shown in Table 10.
Table 10 Summary of scenarios of the transformer fault clearance at F
Areas Affected Probability
F 0.996942336
Entire Substation 0.000009132
D, F 0.000015174
F, H, J 0.000015174 D, F, H, J 0.003018182
2.3.5 Reliability Analysis of Bus Fault Clearance
A bus fault can happen at locations C, D, G, or H. Here, the bus fault at C is taken as an example for illustration. The same techniques can be applied to faults at D, G, and H.
When a bus fault happens at C, the voltage/current information will be sensed by the corresponding PT/CTs and will be sent to MU1, MU3, and MU4. The information will be digitized at these merging units and then will be sent to Bus Protection Unit via the Process Bus. Based on the information received, relay algorithms will be performed at the Bus Protection Unit and trip signals will be sent to CB1, CB3, and CB4 via the PB. There are 8 components associated with this procedure, namely, MU1, MU3, MU4, PB, Bus Protection Unit, CB1, CB3, and CB4. One or more components’ failure will result in malfunction. The detailed descriptions of different scenarios are listed as below.
1) All components operate as intended
If all components operate as intended, CB1, CB3, and CB4 will trip as intended, only the faulted bus will be cut off, and the rest of this substation will stay in service.
2) PB fails to work
Since PB is the hub of all the cyber links inside the substation, the failure of PB will cause all the relays to be unable to receive or send information, all breakers will fail to trip and the entire system will be affected by this fault.
3) One or more components of MU1, CB1 fail, while all other components work as intended
CB3 and CB4 will trip as intended, but CB1 will not. When the fault comes to affect area A, the breaker located at the substation on the other side of this line will trip. Areas A and C will go out of service.
4) One or more components of MU3, CB3 fail, while all other components work as intended
CB1, CB4 will trip as intended, but CB3 will not. When the fault comes to affect area D, the bus protection for D will be triggered and CB2 and CB5 will trip. Buses C and D will be out of service.
5) One or more components of MU4, CB4 fail, while all other components work as intended
CB1 and CB3 will trip as intended, but CB4 will not. When the fault affects area E, the transformer protection will be triggered and CB6 will trip. Bus C and transformer
6) One or more components of MU1, CB1 fail and one or more components of MU3, CB3 fail, while all other components work as intended
Both CB1 and CB3 will not trip. When the fault comes to affect areas A and D, the protection IEDs for these zones will be triggered, CB2, CB5 as well as the breaker on the other side of line A will trip. Areas A, C, and D will go out of service.
7) One or more components of MU1, CB1 fail and one or more components of MU4, CB4 fail, while all other components work as intended
Both CB1 and CB4 will not trip. When the fault comes to affect areas A and E, the protection IEDs for these zones will be triggered, CB6 and the breaker on the other side of line A will trip. Areas A, C, and E will be cut off from the system.
8) One or more components of MU3, CB3 fail and one or more components of MU4, CB4 fail, while all other components work as intended
Both CB3 and CB4 will not trip as intended. When the fault comes to affect areas D and E, the protection IEDs for these zones will be triggered, CB2, CB5, and CB6 will trip. Areas C, D, and E will be cut off from the system.
9) All of the CB1, CB3, and CB4 fail to trip due to breakers failure or PB delay or failure of Bus Protection Unit, but PB is not down
When the fault comes to affect areas A, D and E, the protection IEDs for these zones will be triggered. Areas A, C, D, and E will be isolated from the system.
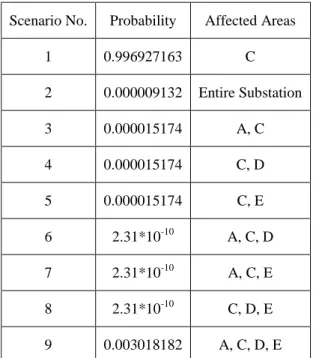
Table 11 Summary of scenarios of the bus fault clearance at C
Scenario No. Probability Affected Areas
1 0.996927163 C 2 0.000009132 Entire Substation 3 0.000015174 A, C 4 0.000015174 C, D 5 0.000015174 C, E 6 2.31*10-10 A, C, D 7 2.31*10-10 A, C, E 8 2.31*10-10 C, D, E 9 0.003018182 A, C, D, E
The probabilities and effects corresponding to all the scenarios are shown in Table 11. These probabilities are calculated given that a fault has already happened at location C. The actual probabilities need to be multiplied by the probability of this fault occurrence.
Similarly, the probabilities and effects of bus fault clearances at locations D, G, and H are shown in Tables 12-14, respectively.
Table 12 Summary of scenarios of the bus fault clearance at D
Affected Areas Probability
D 0.996927163 Entire Substation 0.000009132 B, D 0.000015174 C, D 0.000015174 D, F 0.000015174 B, C, D 2.31*10-10 B, D, F 2.31*10-10 C, D, F 2.31*10-10 B, C, D, F 0.003018182
Table 13 Summary of scenarios of the bus fault clearance at G
Affected Areas Probability
G 0.996927163 Entire Substation 0.000009132 G, I 0.000015174 G, H 0.000015174 E, G 0.000015174 G, H, I 2.31*10-10 E, G, I 2.31*10-10 E, G, H 2.31*10-10 E, G, H, I 0.003018182
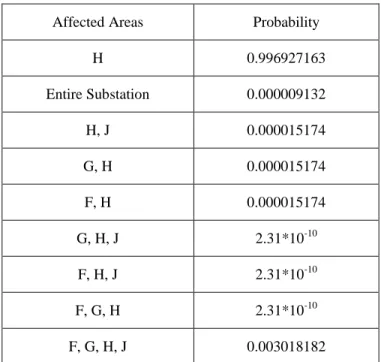
Table 14 Summary of scenarios of the bus fault clearance at H
Affected Areas Probability
H 0.996927163 Entire Substation 0.000009132 H, J 0.000015174 G, H 0.000015174 F, H 0.000015174 G, H, J 2.31*10-10 F, H, J 2.31*10-10 F, G, H 2.31*10-10 F, G, H, J 0.003018182
2.3.6 Construction and Utilization of Cyber-Physical Interface Matrix
The Cyber-Physical Interface Matrix (CPIM) M can be obtained by synthesizing the data from Table 5 to Table 14. The elements of this matrix are the probabilities of interface events. For the Cyber-Physical Interface Matrix (CPIM) M corresponding to the substation illustrated in previous sections, some elements are tabulated in Table 15. The CPIM shown in Table 15 can be improved by eliminating the off-diagonal zeros to make it more compact. Some examples of better developed CPIMs are presented in Section 4.4.1 of this dissertation.
Table 15 Elements of matrix M
Column 1 Column 2 Column 3 … Column 58
Row 1 0.996958 0 0 … 0
Row 2 0 9.1*10-6 0 … 0
Row 3 0 0 0.003033357 … 0
… … … …
Row 58 0 0 0 … 0.00301818
Once the CPIM is obtained, its results can be utilized for the reliability analysis of a wider area by incorporating this substation into a larger system without considering the details of the cyber part.
To illustrate the utility of the interface matrix, the Monte Carlo simulation
process for a composite system shown in Figure 6 is explained in the following example. The simulation process is for illustration only. Its specific implementation will be
presented in section 4 of this dissertation.
Since the CPIM, which depicts the inter-dependencies among the failures of different physical components due to various cyber failure modes, is already obtained, the simulation process can be performed without considering the details of the cyber part. Therefore, only the physical components are shown in Figure 6. All these components are numbered in Table 16.
The next event sequential simulation [37], in which the time is advanced to the occurrence of the next event, is used. For each individual component in this composite system, two states, UP and DOWN, are considered.
The simulation process for the composite system can be formulated in the following steps:
1) Step 1
Set the initial state of all components as UP and set the simulation time t to 0.
230 kV Bus 69 kV Bus A E F B C D G H I J G1 G2 G3 G4 K L M N O P Q R
Table 16 Components in the composite system
Number Component Name
1 Generator G1 2 Generator G2 3 Generator G3 4 Generator G4 5 Transformer M 6 Transformer N 7 Transformer O 8 Transformer P 9 Bus Q 10 Bus R 11 Line A 12 Line B 13 Bus C 14 Bus D 15 Transformer E 16 Transformer F 17 Bus G 18 Bus H 19 Line I 20 Line J 21 Bus K 22 Bus L
2) Step 2
For each individual component, draw a random decimal number between 0 and 1 to compute the time to the next event.
In this section, the distributions of UP and DOWN times for all components are assumed to be exponential. Let Nc be the total number of components, zi (0 < zi < 1, 1 ≤ i
≤ Nc) be the random number drawn for the ith component. The time to the next transition of this component is given by:
𝑇𝑖 = −𝑙𝑛(𝑧𝜌 𝑖)
𝑖 (2.7)
In (2.7), depending on whether the ith component is UP or DOWN, λi or µi is used in place of ρi.
3) Step 3
Find the minimum time, change the state of the corresponding component, and update the total time.
The time to the next system transition is given by:
𝑇 = min{𝑇𝑖} , 1 ≤ 𝑖 ≤ 𝑁𝑐 (2.8)
If this T corresponds to Tq, that is, the qth component, then the next transition takes place by the change of state of this component. The total simulation time t is increased by T.
4) Step 4
Change the qth component’s state accordingly. For each component i, 1 ≤ i ≤ Nc, subtract T from Ti
where Ti, res is the residual time to transition of component i. The time Ti is updated to:
𝑇𝑖 = 𝑇𝑖,𝑟𝑒𝑠 (2.10)
Since the residual time for component q causing transition becomes 0, therefore, the time to its next transition Tq is determined by drawing a new random number and using (2.7).
5) Step 5
If the state of the qth component transits from UP to DOWN, which means a primary fault happens to this component, then the CPIM is used to determine if there are some subsequent failures causing more components out of service due to the cyber part’s malfunction.
Let nq be the number of possible scenarios if a primary fault happens to the qth
component, and pq, j (1 ≤ j ≤ nq) be the probability of the jth scenario given that a primary fault already happened at the qth component. These probabilities are directly available from the CPIM. According to the analysis in sections 2.3.3-2.3.5, the following relationship exists:
∑𝑛𝑞 𝑝𝑞,𝑗
𝑗=1 = 1 (2.11)
For the convenience of further illustration, a zero probability pq,0 is added to the
left side of (2.11), which yields:
∑𝑛𝑗=0𝑞 𝑝𝑞,𝑗 = 1 (2.12)
Draw a random decimal number y (0 < y ≤ 1). Let s (1 ≤ s ≤ nq) be an integer which satisfies (2.13).
∑𝑠−1𝑗=0𝑝𝑞,𝑗 < 𝑦 ≤ ∑𝑠𝑗=0𝑝𝑞,𝑗 (2.13)
Then the sth scenario is determined to happen. Let S be the set of components that would go out of service if the sth scenario happens, and S2 be the set such that:
𝑆2 = {𝑘|𝑘 ∈ 𝑆, 𝑘 ≠ 𝑞} (2.14)
For every component k whose state is currently UP and in S2, change its state to DOWN, draw a new random number, and calculate the time to its next transition Tk using (2.7). Since the failure of component k is caused by the cyber failure rather than a primary fault, therefore, an expedited repair rate µk, exp instead of µk is used in (2.7). The value of µk, exp is normally available from engineering practice and is called a switching rate.
The following specific case is shown as an example to illustrate the details from step 3 to step 5. For the system shown in Figure 6, in the first iteration of Monte Carlo simulation, if q = 11 is obtained in step 3, which means a primary fault happens at Line A, then T11 is updated in step 4. In step 5, from the CPIM shown in Table 15, n11 = 3,
p11,1 = 0.996958, p11,2 = 9.1*10-6, and p11,3 = 0.003033357 can be obtained.
If the random number y is generated to be 0.9177, as shown in Figure 7, then the 1st scenario is determined to happen, which means only Line A is going out of service. Thereby, S = {11} and S2 = {} can be obtained.
If the random number y is generated to be 0.9987, also as shown in Figure 7, then the 3rd scenario is determined to happen, which means both Line A and Bus C would go out of service. S = {11, 13} and S2 = {13} can be obtained, a new random number z13 is
0 0.2 1 0.4 0.6 0.8 1.0 2 3 0 0.2 1 0.4 0.6 0.8 1.0 2 3 If random number = 0.9177 x x
p
q, x (q = 11; x = 1, 2, 3) If random number = 0.9987Figure 7. An example of random number mapping.
6) Step 6
Perform the network power flow analysis to assess system operation states. Update reliability indices.
7) Convergence
Steps 3–6 are iteratively continued until a convergence criterion is satisfied. The simulation is said to have converged when the reliability indices attain stable values. For any index i, the convergence is measured by its standard error, defined as:
𝜂 = 𝜎𝑖
√𝑁𝑦 (2.15)
where σi is the standard deviation of the index i and Ny is the number of years simulated.
Convergence is said to occur when the standard error in (2.15) drops below a preselected value, εi, as shown in (2.16).
𝜂 < 𝜀𝑖 (2.16)
When the simulation finishes, reliability indices, such as the Loss of Load Expectation, can be finally obtained.
2.4 Summary
A novel methodology for modeling and analysis of cyber enabled substation protection systems is presented. A typical protection system based on the IEC 61850 concepts, incorporating both physical and cyber components, is designed. The
probabilities of various faults and tripping scenarios are calculated. General techniques for reliability analysis of cyber-physical systems are presented. The concept of Cyber-Physical Interface Matrix (CPIM) is introduced and its utility is illustrated. The CPIM decouples the analysis of the cyber part from the physical part and provides the means of performing the overall analysis of a composite system in a more tractable fashion.
This methodology of finding the CPIM also applies to the reliability analysis of substation automation systems with more complex configuration and larger scale. In such systems, more effort is needed in detailed analysis of various cyber failure modes as well as effects on the physical side.
3. RELIABILITY ANALYSIS OF MODERN SUBSTATIONS CONSIDERING CYBER-LINK FAILURES
3.1 Introduction
This section enhances the substation protection system reliability model with the consideration of cyber-link failures.
A substation protection system is a typical cyber-physical system. It consists of circuit breakers, current/potential transformers, merging units, and protection panels with intelligent electronic devices. These components are connected in an Ethernet-based environment [38]-[41]. In recent years, numerous research efforts have been devoted to study the reliability considerations and implementation issues of modern substation automation systems [28], [38]-[44].
Due to the complexity of monitoring, control, and communication functions as well as the variety of cyber-physical interdependencies, it is challenging to model and analyze the complete cyber-physical system with explicit technical details. Therefore, most research work focuses either on the cyber part or on the physical part. To cover the whole cyber-physical system, it is necessary to divide the overall analysis into
subsections and proceed sequentially. A tractable methodology of performing the overall Part of this section is reprinted from copyrighted material with permission from IEEE.
2015 IEEE. Reprinted, with permission, from Hangtian Lei, Chanan Singh, and Alex Sprintson, “Reliability analysis of modern substations considering cyber link failures,” in Proc. IEEE Power and Energy Society Innovative Smart Grid
analysis by decoupling the cyber part from the physical part has been proposed in Section 2 [42] of this dissertation by introducing the concept, Cyber-Physical Interface Matrix (CPIM).
The example provided in Section 2 is for the purpose of illustration and some technical details have been simplified in modeling the cyber network. For example, the traffic delay is modeled as a state with a predefined probability value and the links in the communication network are assumed to never fail.
This section applies the methodology proposed in Section 2 to a 4-bus power system with the consideration of more technical details in the cyber part. Unlike some previous publications [38], [39] performing simulations to study the issue of packet delay, this section mathematically models delay as the unavailability of communication links. The remainder of this section is organized as follows. Section 3.2 presents the test system configuration and parameters. The issue of link unavailability due to packet delay is also discussed and modeled in Section 3.2. Section 3.3 outlines the overall procedures. In Section 3.4, the results and discussions are provided. Section 3.5 is the summary of this section.
3.2 System Configuration and Parameters
To illustrate the interactions between cyber and physical components, the reliability of a 4-bus power system with Ethernet-based protection configurations is
[45]. The cyber part is designed according to the typical configurations of modern substation protection systems.
3.2.1 Configuration and Parameters of the Physical Part
The physical part of the system shown in Figure 8 is as described in [45]. The load and generation capacities are tabulated in Table 17, of which the loads are directly obtained from [45]. The generation capacities at substations (buses) 1 and 4 are assumed to be 250 MW and 300 MW, respectively. This assumption is based on the consideration of a 10% capacity reserve for the whole system. Compared to line faults, bus faults are relatively rare and thus are not considered in the reliability analysis of this section.
G1 G4 Bus 1 Bus 2 Bus 3 Bus 4 50 MW 170 MW 200 MW 80 MW 250 MW 300 MW Line 1 Line 2 Line 3 Line 4 Line 5 Line 6 Line 7 Line 8
Load Point 1 Load Point 2
Load Point 3 Load Point 4
Figure 8. The physical part of the test system.
Table 17 Generation and load capacities
Bus No. Generation Capacity (MW) Load Capacity (MW)
1 250 50
2 0 170
3 0 200
4 300 80
3.2.2 Configuration and Parameters of the Cyber Part
The Ethernet-based protection system is designed for each substation (bus), as shown in Figure 9. For the protection system at each substation, three Ethernet switches are used and they are connected in a ring topology. Take substation 1 as an example, the cyber component names and their meanings are tabulated in Table 18.
G1 G4 MU 1-1 MU 1-3 MU 1-2 ES 1-1 ES 1-2 ES 1-3 S1-L5 MU 2-1 MU 2-2 MU 2-3 ES 2-1 ES 2-2 ES 2-3 S2-L6 Line 5 Line 2 Line 1 Line 6 Line 3 Line 4 Line 7 Line 8 S1-L1 S1-L2 S2-L3 S2-L1 Bus 1 Bus 2 Bus 3 Bus 4 MU 3-2 MU 3-1 MU 3-3 ES 3-1 ES 3-2 ES 3-3 S3-L4 S3-L7 S3-L2 MU 4-2 MU4-1 MU 4-3 ES 4-1 ES 4-2 ES 4-3 S4-L3 S4-L8 S4-L4
Table 18 Cyber component names and meanings
Component Name Meaning
MU 1-1 Merging Unit 1 at Substation 1 MU 1-2 Merging Unit 2 at Substation 1 MU 1-3 Merging Unit 3 at Substation 1 ES 1-1 Ethernet Switch 1 at Substation 1 ES 1-2 Ethernet Switch 2 at Substation 1 ES 1-3 Ethernet Switch 3 at Substation 1
S1-L5 Line 5 Protection Panel at Substation 1 S1-L1 Line 1 Protection Panel at Substation 1 S1-L2 Line 2 Protection Panel at Substation 1
The circuit breaker reliability data for this section are based on the data from [28], [35]. The reliability data for merging units, Ethernet switches, and line protection panels are not widely available. Based on [28], [33], [34], the failure rates and Mean Repair Times are tabulated in Table 19. Components of the same category are assumed identical and therefore have the same reliability data. In this section, the current and potential transformers are assumed to never fail.
Table 19 Reliability data for components
Component Failure Rate (/year) Mean Repair Time (h)
Circuit Breaker 0.01 8
Merging Unit 0.02 8
Ethernet Switch 0.01 8
Line Protection Panel 0.02 8
3.2.3 Link Failure in the Cyber Network
Generally, there are two types of cyber link failures: (a) A link is unavailable due to packet delay resulting from traffic congestion or queue failure; (b) A link is physically damaged. Failure type (b) is relatively rare and thus only failure type (a) is considered in this section.
To illustrate how to model the cyber link unavailability, the cyber part of
substation 1 is separated from the physical part and the cyber links are numbered from 1 to 21, as shown in Figure 10.
MU 1-1 MU 1-3 MU 1-2 ES 1-1 ES 1-2 ES 1-3 S1-L5 S1-L1 S1-L2 1 2 3 4 5 6 7 8 9 10 11 12 13 14 15 16 17 18 19 20 21
Figure 10. The cyber part of substation 1.
In Figure 10, the traffic on links 10-21 is relatively light compared with other links. Therefore, links 10-21 are considered congestion free.
Each link is bidirectional and each direction has a queue. Consider a link i
connecting components a and b. The time it takes for a packet to travel from component
a to b is a random variable denoted by ti.1. For the reverse direction (from b to a), the
random time is denoted by ti.2. Depending on the arrival and departure stochastic
processes associated with each queue on link i, the values of ti.1 andti.2 follow some
probability distribution functions.
Consider the communication from component a to x. We say this communication is unavailable if the time it takes on every possible path from a to x is greater than a predefined threshold delay value.
For example, consider the communication from MU 1-1 to S1-L1. There are two possible paths, 1-8-4 and 1-7-9-4. Assuming that all associated links are in forward directions, the probability of communication path failure is:
𝑝𝑓𝑎𝑖𝑙= Pr[(𝑡1.1+ 𝑡8.1+ 𝑡4.1 > 𝑇𝑡𝑠𝑑) 𝑎𝑛𝑑(𝑡1.1+ 𝑡7.1+ 𝑡9.1+ 𝑡4.1 > 𝑇𝑡𝑠𝑑)] (3.1) where Ttsd is a predefined threshold delay value for the two paths.
Therefore, the effects of link failures can be modeled as the probabilities of “communication path failure” between any two components. These probabilities can be obtained by modeling and analyzing the queueing process at both the link and the path levels. The detailed procedures are based on queueing theory and are beyond the scope of this dissertation. These probabilities are assumed directly at the path level. Only the paths between merging units and protection panels are of our interest and the
corresponding probabilities are tabulated in Table 20. The probabilities given are an example. The methodology of modeling link failures proposed in this section is general and also applicable for other probability values. For each cyber link, we assume its forward queue and reverse queue are independent. Therefore, for each path, it is assumed that the forward failure and reverse failure are independent.
Table 20 Communication path failure probabilities
From To Forward Path Failure Probability Reverse Path Failure Probability
MU 1-1 S1-L5 0.002 0.002 MU 1-1 S1-L1 0.001 0.001 MU 1-1 S1-L2 0.001 0.001 MU 1-2 S1-L5 0.001 0.001 MU 1-2 S1-L1 0.001 0.001 MU 1-2 S1-L2 0.002 0.002 MU 1-3 S1-L5 0.001 0.001 MU 1-3 S1-L1 0.002 0.002 MU 1-3 S1-L2 0.001 0.001 3.3 Reliability Analysis
The overall procedures can be divided into two stages: (a) Reliability analysis of the cyber part; (b) Reliability evaluation for the entire power system.
In stage (a), the failure modes of individual cyber components and their combinations are examined and analyzed. For each cyber component, only two states, Up and Down, are considered. Besides, there are some assumptions:
1) If the primary protection fails to isolate the fault and the trip signal is
transferred to adjacent protection zones, this fault can always be isolated by adjacent protection zones.
3) Only the first-order primary faults are considered. The situations in which multiple primary faults occur concurrently on different lines are not considered.
4) All the cyber components in this system are considered statistically independent and thus common-mode failures are not considered.
5) A successful operation requires that neither the forward path nor the reverse path is in failure mode.
The objective of stage (a) is to obtain the Consequent Event Matrix (CEM) and the Cyber-Physical Interface Matrix (CPIM), in which the consequent events and their probabilities are summarized. To obtain these probabilities, the consequent events after a primary fault occurs at each line are analyzed. Two states, Up and Down, are considered for each component. The probability of a consequent event can be obtained by
multiplying the Up/Down probabilities of the components associated with this event. To illustrate the analysis in stage (a), the procedures of obtaining the probabilities in the first row (corresponding to the primary fault occurring at line 1) are provided as follows. The procedures are similar for primary faults occurring at other lines.
When a primary fault occurs at line 1, there are four possible scenarios. 1) Both of the two terminal circuit breakers operate as intended.
For the convenience of further illustration, the circuit breaker on line 1 at bus 1 side is referred to as “breaker 1-1” and the circuit breaker on line 1 at bus 2 side is referred to as “breaker 1-2”. The operation of breaker 1-1 associates with these components: breaker 1-1, MU 1-3, ES 1-3, Line Protection Panel S1-L1, forward
communication path, and reverse communication path. The Up and Down probabilities of each component can be calculated from the data in Tables 19 and 20. Therefore, the successful operation probability of breaker 1-1, denoted by p1, can be obtained by
multiplying the Up probabilities of all associated components. Similarly, the successful operation probability of breaker 1-2, denoted by p2, can be obtained by multiplying the
Up probabilities of the associated components in bus 2. The product of p1 and p2 would
be the probability of this consequent event, in which only line 1 will be isolated after the primary fault.
2) Breaker 1-2 operates as intended while breaker 1-1 does not.
In this case, at least one associated component in bus 1 is in Down state while all associated components in bus 2 are in Up state. As a result, lines 1, 2, and 5 will be isolated. The probability of this consequent event is therefore (1 – p1)p2.
3) Breaker 1-1 operates as intended while breaker 1-2 does not.
In this case, at least one associated component in bus 2 is in Down state while all associated components in bus 1 are in Up state. As a result, lines 1, 3, and 6 will be isolated. The probability of this consequent event is therefore (1 – p2)p1.
4) Neither breaker 1-1 nor breaker 1-2 operates as intended.
This consequent event is a result from the failure of at least one associated component in bus 1 and at least one associated component in bus 2. The probability of this event is therefore (1 – p1)(1 – p2). In this event, lines 1, 2, 3, 5, and 6 will be
Following similar procedures as performed above, the results of a primary fault occurring at each line are obtained and tabulated in Tables 21 and 22.
After the probabilities of all cyber induced consequent events are obtained in stage (a), the analysis proceeds to stage (b), in which the reliability evaluation is performed at the power system level. Using the two matrices obtained in stage (a), the effects of protection malfunctions can be taken into account without considering the details of the cyber part. The procedures of a Monte Carlo simulation for the reliability evaluation in stage (b) have been formulated in Section 2 [42] of this dissertation. The detailed implementation will be presented in Section 4 of this dissertation. The reliability indices at load points can be obtained after the two stages of analysis.
3.4 Results and Discussions
3.4.1 Results
After the analysis of the cyber part, the Consequent Event Matrix (CEM) and the Cyber-Physical Interface Matrix (CPIM) are obtained, as shown in Tables 21 and 22, respectively.
In the CEM, each entry is an 8-digit binary code in which each digit corresponds to the status of a line. A “1” means that the corresponding line is going out of service after a primary fault whereas a “0” means that the corresponding line is not affected. For example, an entry “11001000” in the first row means that lines 1, 2, and 5 are going out
of service after a primary fault occurs on line 1. It should be noted that the CEM is a result of the failure of cyber part. If the cyber part worked as it is meant to, then a primary fault on a line will not result in the isolation of other lines.
In the CPIM, each entry gives the probability of a consequent event given that a primary fault occurs on a particular line. Each row corresponds to the location of a primary fault. For example, the probability corresponding to the event “11001000” in the first row is the probability of lines 1, 2, and 5 going out of service given that a primary fault already occurred on line 1. If the cyber part had perfect reliability, then column 1 would have probabilities 1 and other columns zero.
Table 21 The consequent event matrix
Primary Fault Location Consequent Events
Line 1 10000000 11001000 10100100 11101100 Line 2 01000000 11001000 01010010 11011010 Line 3 00100000 10100100 00110001 10110101 Line 4 00010000 01010010 00110001 01110011 Line 5 00001000 11001000 00000000 00000000 Line 6 00000100 10100100 00000000 00000000 Line 7 00000010 01010010 00000000 00000000 Line 8 00000001 00110001 00000000 00000000