ALVIS: interactive non-aggregative visualization and
explorative analysis of multiple sequence alignments
Roland F. Schwarz
1,*, Asif U. Tamuri
1, Marek Kultys
2, James King
2, James Godwin
2, Ana
M. Florescu
2, J ¨
org Schultz
3and Nick Goldman
1,*1European Molecular Biology Laboratory––European Bioinformatics Institute, Wellcome Genome Campus, Hinxton,
CB10 1SD, UK,2Science Practice, 83–85 Paul Street, London, EC2A 4NQ, UK and3Center for Computational and
Theoretical Biology and Department of Bioinformatics, University of W ¨urzburg, Biocenter, Am Hubland, 97074 W ¨urzburg, Germany
Received September 3, 2015; Revised January 7, 2016; Accepted January 8, 2016
ABSTRACT
Sequence Logosand its variants are the most com-monly used method for visualization of multiple se-quence alignments (MSAs) and sese-quence motifs. They provide consensus-based summaries of the se-quences in the alignment. Consequently, individual sequences cannot be identified in the visualization and covariant sites are not easily discernible. We
re-cently proposed Sequence Bundles, a motif
visual-ization technique that maintains a one-to-one rela-tionship between sequences and their graphical rep-resentation and visualizes covariant sites. We here present Alvis, an open-source platform for the joint explorative analysis of MSAs and phylogenetic trees,
employing Sequence Bundlesas its main
visualiza-tion method. Alvis combines the power of the
vi-sualization method with an interactive toolkit allow-ing detection of covariant sites, annotation of trees with synapomorphies and homoplasies, and motif detection. It also offers numerical analysis function-ality, such as dimension reduction and
classifica-tion.Alvis is user-friendly, highly customizable and
can export results in publication-quality figures. It is available as a full-featured standalone version (http://www.bitbucket.org/rfs/alvis) and itsSequence Bundles visualization module is further available
as a web application (http://science-practice.com/
projects/sequence-bundles). INTRODUCTION
Visualization and explorative analysis of multiple sequence alignments (MSAs) are essential to all areas of computa-tional biology. Different methods for the graphical
iden-tification of sequence motifs have been proposed over the years. The most popular are Sequence Logos (1), HMM-Logos (2) and, recently, pLogos (3). These are aggrega-tive or consensus-based visualizations of MSAs: alignment columns are summarized by individual characters scaled according to their relative frequencies or statistical signif-icance.
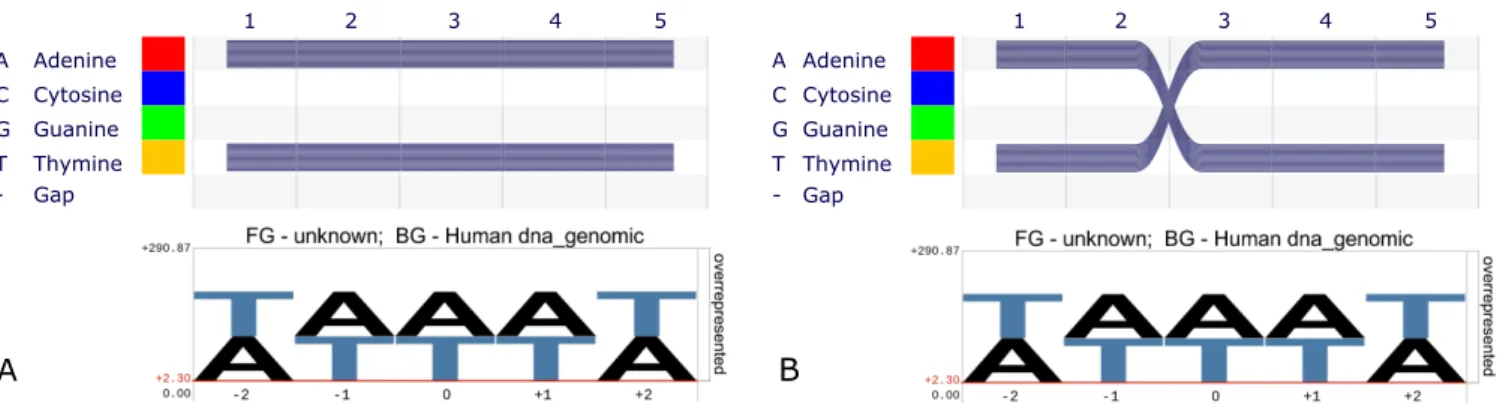
While providing a compact view of large MSAs, the ag-gregative nature of logos is also a major limitation: individ-ual sequences cannot be identified in the final graphical rep-resentation. Consequently, information about covariance between sites (residues or nucleotides) is lost. For example, consider the following two illustrative alignments. The first alignment consists of 500 copies of each of the sequences
AAAAA and TTTTT (Figure 1A, bottom). The second alignment consists of 500 copies of each of the sequences
AATTTandTTAAA(Figure1B, bottom). Because the site-specific nucleotide frequencies are identical between the two alignments, aggregative motif visualization methods fail to capture the sequence motifs. Therefore, sequence logos are in general not able to help in the identification of specificity determining sites and correlated substitutions. The impor-tance of residue–residue dependencies for the understand-ing of the evolution of protein function was pointed out as long ago as 1970 (4). The term ‘covarion’ was coined to de-note concomitantly variable codons. The relevance of these correlated changes for the structure of proteins has been proven (5), and different methods relying on them for the prediction of protein structure were developed. For a re-cent review see [(6)] and references therein. In short, deliber-ately omitting information about correlation between sites in MSAs drastically reduces the information available about the evolution, structure and function of protein families.
To address this shortcoming, we recently developed Se-quence Bundles(7), a novel visualization method based on stacked semi-opaque Bezier curves.Sequence Bundlesform
*To whom correspondence should be addressed. Tel: +44 1223 49 2598; Fax: +44 1223 48 46 96; Email: [email protected]
Correspondence may also be addressed to Nick Goldman. Tel: +44 1223 492 530; Fax: +44 1223 494 468; Email: [email protected]
Disclaimer:The funders had no role in study design, data collection and analysis, decision to publish, or preparation of the manuscript. C
The Author(s) 2016. Published by Oxford University Press on behalf of Nucleic Acids Research.
This is an Open Access article distributed under the terms of the Creative Commons Attribution License (http://creativecommons.org/licenses/by/4.0/), which permits unrestricted reuse, distribution, and reproduction in any medium, provided the original work is properly cited.
at FAK/MDC on November 4, 2016
http://nar.oxfordjournals.org/
e77 Nucleic Acids Research, 2016, Vol. 44, No. 8 PAGE2OF7 A Adenine C Cytosine G Guanine T Thymine - Gap 1 2 3 4 5 A Adenine C Cytosine G Guanine T Thymine - Gap 1 2 3 4 5 A B
Figure 1. (A)SequenceBundles(top) andpLogo(bottom) representation of an alignment of 1000 sequences with 500 instances ofAAAAAand 500 instances ofTTTTT. (B) The same visualizations rendered on a 1000 sequence alignment with 500 instances ofAATTTand 500 instances ofTTAAA. ThepLogo
representations in (A and B) are identical and reflect only the identical sitewise nucleotide frequencies in the two examples. (The different ordering of letters is a result of the chosen genomic background [human whole-genome].)Sequence Bundlesclearly show the two sequence motifs in each case, because the nucleotides remain connected in the visualization.
a grid with the sequence alphabet on the y-axis, ordered ac-cording to various biochemical properties, and the sequence positions on the x-axis. Grid cells are connected by semi-opaque curves (threads), one for each sequence in the align-ment. In contrast topLogo, the sequence motifs are now clearly visible (Figure1A and B, top).
Sequence Bundles retain sequence identity, as every se-quence has its own graphical representation (the thread). The one-to-one relationship between sequences and their vi-sualization make them a powerful tool for explorative anal-yses of MSAs. We previously developed CAMA, an un-supervised ordination method for MSAs to detect statisti-cal dependencies between sequences and sites in an MSA (8). Sequence Bundles show particular synergy with this method: sequences and sites may be repeatedly selected and their relationships are visualized in the bundle. This is of particular interest in phylogenetics, where such explorative analyses can be used to identify sequence motifs shared be-tween monophyletic clades of a tree (synapomorphies), or where sequence motifs shared between paraphyletic clades (homoplasies) might indicate convergent evolution.
We now presentAlvis, a platform for the joint explorative analysis of MSAs and phylogenetic trees which uses Se-quence Bundlesas its main visualization method.Alvis facil-itates the identification of functional residues, detects corre-lated substitutions between distant sites, and helps find and visualize sequence motifs. Below we present an overview of the capabilities of the software and illustrate its use in a se-ries of real-world case studies.
MATERIALS AND METHODS
Alvis is implemented in Java and is available for all com-monly used platforms. It imports and exports common sequence and tree formats as supported by the BioJava suite (9). Sequences can be loaded pre-aligned or can be aligned by the software using the EMBL-EBI Prank web service (10). Custom sequence alphabets are fully supported for analysis of sequential datasets beyond amino acid and nucleotide sequences (e.g. copy-number profiles). Sessions can be saved and restored using the File−>Open and
File−>Savecommands. All settings and options are saved between sessions in a custom configuration file∼.alvis.
Sequence Bundles are implemented using custom code and the hardware-accelerated Java2D API. Generated im-ages can be exported in high-resolution PNG bitmaps as well as in SVG vector format for later editing.
Tree reconstruction is performed using the fast NINJA neighbour-joining implementation (11). Tree visualization is achieved using the animated tree rendering framework PhyloWidget (12).
Profile Hidden Markov Model implementation is based on the BioJava library (9). Fisher Scores and CA are com-puted using a custom algorithm as presented in the CAMA method article (8). Sequence classification and feature de-tection are enabled through the integrated R gateway using rJava/JRI (13) andkernlab(14).
Alvisis open source under GNU Affero GPL v3.0 and can be downloaded fromhttps://bitbucket.org/rfs/alvis. Se-quence Bundlesvisualization is also available online athttp: //science-practice.com/projects/sequence-bundlesandhttp: //www.ebi.ac.uk/goldman-srv/sequencebundles.
RESULTS
Alviscombines the traditional alignment and sequence logo view with aSequence Bundlesrepresentation of the under-lying MSA (Figure2A). The alignment and bundle views are synchronized so changes to magnification, position in the alignment or selections made in one are reflected in the other. Sequences and sites can be selected manually or by entering queries in a search box using a simple query lan-guage. The query language accepts arbitrary boolean com-binations of regular expressions on both the sequence labels as well as the actual sequences.
All aspects of the bundle rendering engine are customiz-able, including curvature, group colours and cell dimen-sions. Results can be exported to produce visually appealing publication-quality figures.
Phylogenetic analysis
Alvisimports phylogenetic trees or builds its own tree based on pairwise distances computed from an evolutionary
at FAK/MDC on November 4, 2016
http://nar.oxfordjournals.org/
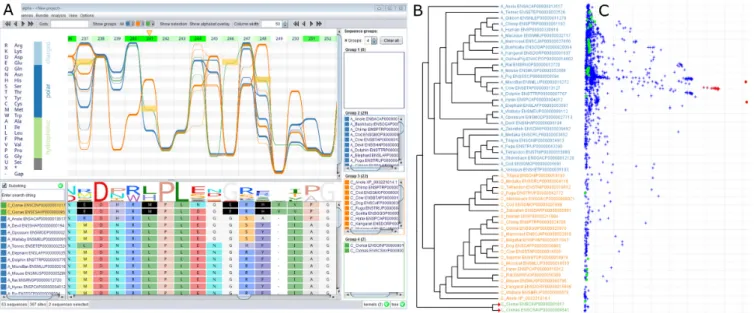
Figure 2. (A)Alvis’sSequence Bundlesvisualization of the haloacid dehalogenase family. The bundle shows three sequence groups in different colours. Horizontal dependencies are immediately visible. For example, allCionasequences (selected in red) have a Met in position 241 and also exclusively have a Glu residue in position 246 and a His at position 248. This information is not available from the standard sequence logo (below). Above the bundle, green shaded markers indicate which sites are most likely responsible for the grouping. In agreement with the original paper (23), site 241 (marked with an orange triangle) is found as being most significant. (B)Alvis’s rendering of the associated phylogenetic tree. The group colours match those in the bundle. (C) CA scatterplot computed byAlvison the same MSA. Sequences are displayed as green points, sites as blue crosses. Selection of sites and sequences in this plot (red) induces the highlighting of the corresponding sites and sequences in the alignment and bundle views. Residue Met-241 is identified as significantly associated withCiona.
quence kernel (15) derived from the MSA. Tree visualiza-tion (Figure2B) includes standard layout schemes (circular, rooted, unrooted) and layout operations (rerooting, node flipping, etc.). The tree visualization engine is linked to the alignment and bundle views to reflect selections made by the user. In the tree view, sequences can be selected based on individual taxa (leaf nodes), clades and sub-clades.
Sequences can be assigned to groups, each of which may be given a unique colour which is applied to its members’ threads for easy identification of groups in the bundle. As-signment into groups may be performed manually, by drag-ging and dropping selected sequences into a group con-tainer, or automatically using spectral clustering (16).
Numerical analysis
A typically fundamental task when analysing MSAs is the identification of the main sequence clusters and the sites they have in common. This can be achieved in a supervised or unsupervised manner, both of which require a numerical representation of the sequence data.Alviscan train a profile HMM (17) on the MSA and will use the Fisher scores of the emission probabilities (18) as a numerical embedding. In the supervised scenario (i.e. given a set of user-defined groups) the detect sites feature trains one support vector machine (SVM) classifier (19) per site. Leave-one-out cross validation is performed on each SVM to identify sites that best explain the chosen grouping. Complementarily, cor-respondence analysis (CA) is an unsupervised ordination method to detect sequence groups and the sites that define the grouping (8). InAlvisit is based on an interactive scat-terplot of both sequences and sites (Figure2C), which again is linked to the alignment, bundle and tree views. Selecting a
cluster of points in the CA plot highlights the correspond-ing sequences and sites in the bundle as well as the align-ment (see Figure2), allowing for systematic and interactive exploration of the MSA. All kernel matrices and the Fisher scores can be exported for analyses elsewhere.
In combination, the alignment view, bundle visualiza-tion, phylogenetic reconstruction and numerical analyses form an ideal toolkit for explorative analyses of MSAs. We present three example applications, each chosen to illustrate howAlvisfacilitates scientific discovery not readily possible using other existing methods.
For a tutorial on how to use Alvis, please refer to our introductory video athttps://vimeo.com/146710536.
Identification of specificity-determining sites in two HAD phosphatases
Mammalian haloacid dehalogenase (HAD)-type phos-phatases are an ancient protein family. More than 40 en-zymes with important functions in physiology and dis-ease are encoded in the human genome (20,21). One mem-ber of this family, chronophin, regulates cofilin-mediated actin reorganization by dephosporylating phospho-serines (22). Surprisingly, its closest paralogue, the aspartate-based, ubiquitous, Mg2 +-dependent phosphatase (AUM),
func-tions as a tyrosine-phosphatase (23).
Here, we demonstrate computational detection of specificity-determining sites exclusively using features implemented inAlvis. We imported an alignment of 53 se-quences comprising the chronophin and AUM paralogues across vertebrates as well as Ciona as an additional out-group (23)(Figure2A). We reconstructed an evolutionary tree using an alignment kernel (15) based on the
at FAK/MDC on November 4, 2016
http://nar.oxfordjournals.org/
e77 Nucleic Acids Research, 2016, Vol. 44, No. 8 PAGE4OF7
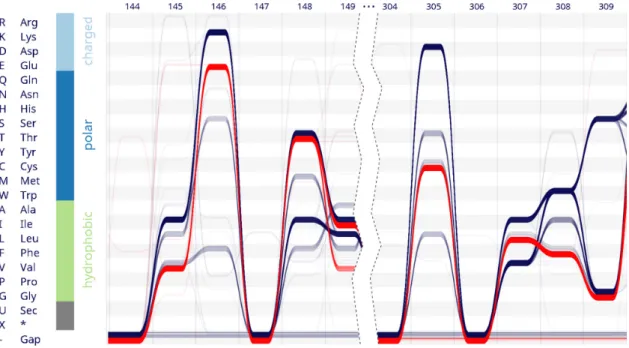
Figure 3. Alvisvisualizes an alignment of 1224 mammalian nucleotidyl cyclases. Sequences containing Glu in position 146 are selected (red). None of these sequences contain Asp within the functionally correlated site 305. Further differently conserved sites like 307 and 308 also become apparent.
SUM62 substitution matrix, which correctly recovered the paralogue structure and most phylogenetic relationships (Figure 2B). We assigned the two paralogue families and the outgroup to three sequence groups: AUM (blue), chronophin (orange) andCiona(green). The visualization clearly shows dependent sites. For example the Ciona
sequences have a Met in position 241 and also exclusively have a Glu residue in position 246 and a His at position 248. This information is lost in the traditional sequence logo view (Figure2A, below the bundle).
To identify sites that distinguish best between the defined sequence groups, we used the ‘detect sites’ feature imple-mented in Alvis. Green markers, whose opacity increases with decreasing cross-validation error, display these results and indicate which sites are most likely responsible for the grouping.Alvisidentified site 241, containing Leu in AUM and His in chronophin, as most significant (Figure2, site 241, marked with an orange triangle). CA (Figure2C) con-firms these findings. It first correctly identifiesCionaas most divergent (first principal axis). The sites that are spatially co-located with the twoCionaspecies in the scatterplot (se-lected in red) include Met-241. Selection in the scatterplot automatically selects the respective sequences and sites in the alignment and bundle views. Seifriedet al. experimen-tally verified that introduction of a His residue at position 241 in AUM transfers chronophin-like substrate recruit-ment onto AUM (23). This example shows howAlvis en-ables the detection of specificity-determining sites with just a few mouse clicks. This example was also the basis for our introductory video athttps://vimeo.com/146710536.
Correlated substitutions in nucleotidyl cyclases
Cyclic nucleotides like adenosine 3-5 cyclic monophos-phate (cAMP) and guanosine 3-5cyclic monophosphate (cGMP) are small-molecule secondary messengers that play
a key role in intracellular signalling. They are synthesized by nucleotidyl transferases which can be assigned to two groups based on their substrate specificity. While guanaly-late cyclases take guanosine triphosphate (GTP) as a sub-strate, adenylate cyclases use adenosine triphosphate. Sub-strate specificity is defined by two positions: mutating Lys to Glu (pos. 146) and Asp to Cys (pos. 305) in a guanylyl cyclase switches its catalytic activity to an adenylyl cyclase (24). This feature made the nucleotidyl cyclases a common study object for the automated identification of specificity-determining sites (e.g.(25–29)).
We useAlvis to test whether a correlation between the two specificity-determining sites is conserved throughout the Mammalia. We extracted all mammalian nucleotidyl cy-clases annotated by thePfamdatabase (30) (ID:PF00211). The sequences were aligned to the corresponding HMM us-ingPfam’s web service. The resulting alignment comprising 1224 protein sequences was loaded intoAlvis(Figure3). In agreement with the experimental results, the visualization shows that the relevant sites (146 and 305) are dominated by two variants each.Alvisenables us to select all sequences containing Glu in position 146 with a single mouse click (Figure3, threads coloured red). In contrast to a standard sequence logo, the bundle view reveals that none of these sequences contains Asp in position 305; instead, all have ei-ther Cys or a gap. Thus, a correlation characterised experi-mentally in a single protein is seen to be transferable to all sequenced mammalian nucleotidyl cyclases. This example illustrates howAlviscan condense information encoded in an alignment of more than 1000 sequences and still repre-sent key characteristics of the underlying sequences.
Comparison topLogoin the CaMKII motif detection task
Recently O’Shea et al.proposedpLogo(3), a variant of a conventional sequence logo that scales the height of the
at FAK/MDC on November 4, 2016
http://nar.oxfordjournals.org/
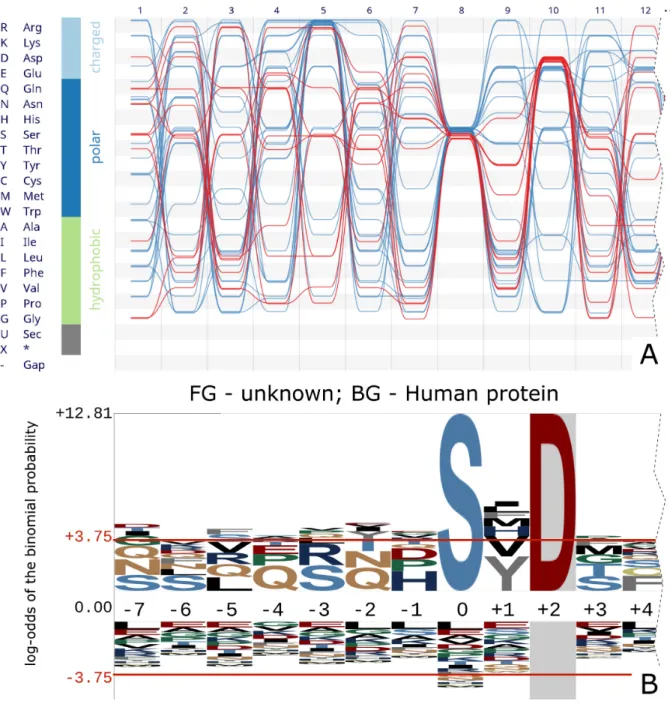
Figure 4. (A) The visualization of horizontal dependencies is a powerful tool to quickly investigate an alignment for co-dependent sites. Asp-10-containing sequences of calmodulin-dependent protein kinase II show no co-clustering at any of the other non-fully conserved positions. A strong preference for Asp-10 sequences to not have an Arg at position 5 however is visible and statistically significant (binomial testP-value 0.0053). (B) Representation of the same sequences with thepLogosoftware. In this version Asp-10 is ‘fixed’ (or conditioned on), also showing that there is no correlation between Asp-10 and position 5. However, the preference for avoiding Asp-5 remains hidden. The unfixed version (not shown) fails to capture the sequence motif altogether.
characters using a probability model. Additionally, it can create an alignment logo conditional on individual residues at user-specified sites (so-called ‘fixing’ of sites). This par-tially overcomes the lack of visualization of horizontal de-pendencies in traditional sequence logos, because the user can iteratively select each site, restrict attention to each residue observed, and see how the remaining logo changes. Figure4shows the calmodulin-dependent protein kinase II (CaMKII) sequences taken from (3). Three sites show a degree of conservation: site 5 dominantly shows an Arg residue, site 8 exclusively a Ser residue and site 10 shows amongst others an enrichment for Asp. O’Sheaet al.used
their ‘fixing’ of sites (3) to investigate whether the sequences with Asp at site 10 also have an Arg at site 5. They concluded there is no dependency or correlation between amino acid distributions at sites 5 and 10 (Figure4B).
By retaining individual sequence information rather than site-wise averages or counts of residue frequencies, this last result is instantly visible from the visualization inAlvis. By clicking a grid cell in the bundle view all sequences contain-ing the correspondcontain-ing residue are selected in the alignment and marked in red in the bundle (Figure4A). It is evident that sequences containing an Asp residue at site 10 show no conservation in other parts of the sequence, the red threads
at FAK/MDC on November 4, 2016
http://nar.oxfordjournals.org/
e77 Nucleic Acids Research, 2016, Vol. 44, No. 8 PAGE6OF7
of the bundle being widely spread out at all other positions (i.e. not notably conserved). It is however evident from the
Alvisrepresentation that sequences with an Asp-10 residue seem to avoid Arg-5 (binomial test, P-value 0.0053). This information is lost in the ‘fixing’ method ofpLogowhen re-stricting the analysis to Asp-10 sequences only.
DISCUSSION
While many improvements to traditional sequence logos have been proposed,Alvisprovides a unique combination of interactive analysis capabilities and non-aggregative visual-ization. Figure1shows thatpLogois in essence a classical sequence logo with a different scaling on they-axis. It suf-fers from the drawback typical of all aggregative methods: individual sequences cannot be identified in the final visu-alization.Alvisallows users to interactively explore MSAs on a consensus level as well as on the level of individual sequences. Because residues in the same sequence remain connected in the visualization, multi-site sequence motifs become visible even between distant sites. These multi-site motifs can also be investigated in the context of groups of sequences, by finding shared motifs or contrasting groups against one another. As often residues are exchanged based on functional constraints, such as hydrophobicity, the dif-ferent y-axis legends available in Alvis induce sorting of residues according to biochemical properties. This helps to identify motifs conserved through functional similarity, not sequence.
Other visualization techniques have been proposed over the years which are capable of visualizing correlations be-tween sites. Traditionally, DotPlots (31) have been used to this end, although they are best-suited to pairwise com-parisons and are difficult to use for MSAs. Modern ap-proaches include StickWRLD (32), a circular 3D visualiza-tion technique that uses coloured sticks to connect corre-lated residues.Sequence Bundles, while similar to a degree, uses a 2D approach approach of parallel lines, inspired by the more general parallel coordinate representations (33).
The ability to relate the MSA and any motifs visualized (whether usingSequence Bundlesor other methods) to a re-alistic phylogeny is vital for a full understanding of the evo-lutionary history of the sequences and their associated func-tions (10). In addition, it helps in the assessment of the sig-nificance of motifs, which may be affected by factors such as low numbers of observations (few, highly divergent se-quences) or data redundancy (domination by many closely related sequences). Others have proposed pseudo-counts and reweighting strategies to try to overcome these draw-backs (34). Pseudo-counts are already part of the HMM training inAlvisand we will consider applying both strate-gies to the visualization as well in a future version ofAlvis. Gaps in MSAs carry significant evolutionary informa-tion, particularly between divergent sequences (15,35). Se-quence LogosandpLogodo not visualize or model gaps in the alignment. In Alviswe have implemented support for gaps both in the visualization and the numerical analyses, thus extending its potential applications beyond highly con-served alignments.
Often sequence motifs are investigated in an evolutionary context, for example when searching for evidence of
conver-gent evolution. By mapping sequences to a phylogenetic tree one can detect evolutionary motifs that define monophyletic clades (synapomorphies) or contradict them (homoplasies). The latter can then be analysed for patterns of convergent evolution.
Sequence logos and bundles can both compactly visualize MSAs with a large number of sequences.Alvisadditionally provides dimension reduction techniques for MSAs with a large number of sites using numerical ordination methods. This has proven to be useful when dealing with large pro-teins, multi-locus alignments or genomic profiles. CA has been shown to be an effective tool in identifying distant co-variant sites and in providing a lower-dimensional repre-sentation of the data (8). Here, in contrast to some meth-ods for the identification of correlated mutations (36), CA is an explorative analysis technique. It uses a chi-square met-ric instead of a euclidean metmet-ric in an algorithm related to principal-component-analysis to discover associations be-tween sequences and sites.
Not all possible use cases can be foreseen and often re-searchers need to run bespoke algorithms on their align-ments. Rather than implementing popular algorithms yet again, Alvis can connect to an existing R installation for advanced statistical analyses. For example, thedetect sites
function is by default based on supervised classification suitable for all kinds of sequence alphabets. Using the R in-terface, it could easily be augmented with specialized algo-rithms for detecting specificity determining sites in protein sequences, such as the evolutionary trace method (37). For a recent review, see also (38).
Alvis further provides export functionality for all internal data, the Fisher scores and kernel matrices. In the future, an extended R API will allow the user to push and pull data directly in and out ofAlvisfrom their own R workspace.
ACKNOWLEDGEMENTS
Work onSequence Bundleswas inspired by the BioVis2013 redesign competition (39). We thank Joe Lau for implemen-tation of the web interface, and Greg Slodkowicz, Gideon Pomeranz and the participants of our user study for enthu-siastic testing of the software.
FUNDING
European Molecular Biology Laboratory (to R.F.S., A.U.T., N.G.); EMBL Interdisciplinary Postdoc (EIPOD) Fellowship with Co-funding from Marie Curie Actions COFUND (grant no. 229597; to R.F.S.); Science Practice (to M.K., J.K., J.G., A.F.); Innovate UK (project no. 131691; to M.K., J.K., J.G., A.F.). Funding for open access charge: EMBL core funding.
Conflict of interest statement.None declared.
REFERENCES
1. Schneider,T.D. and Stephens,R.M. (1990) Sequence logos: a new way to display consensus sequences.Nucleic Acids Res.,18, 6097–6100. 2. Schuster-B ¨ockler,B., Schultz,J. and Rahmann,S. (2004) HMM Logos
for visualization of protein families.BMC Bioinformatics,5, 7. 3. O’Shea,J.P., Chou,M.F., Quader,S.A., Ryan,J.K., Church,G.M. and
Schwartz,D. (2013) pLogo: a probabilistic approach to visualizing sequence motifs.Nat. Methods,10, 1211–1212.
at FAK/MDC on November 4, 2016
http://nar.oxfordjournals.org/
4. Fitch,W.M. and Markowitz,E. (1970) An improved method for determining codon variability in a gene and its application to the rate of fixation of mutations in evolution.Biochem. Genet.,4, 579–593. 5. Neher,E. (1994) How frequent are correlated changes in families of
protein sequences?Proc. Natl. Acad. Sci. U.S.A.,91, 98–102. 6. de Juan,D., Pazos,F. and Valencia,A. (2013) Emerging methods in
protein co-evolution.Nat. Rev. Genet.,14, 249–261.
7. Kultys,M., Nicholas,L., Schwarz,R., Goldman,N. and King,J. (2014) Sequence Bundles: a novel method for visualising, discovering and exploring sequence motifs.BMC Proc.,8, S8.
8. Schwarz,R., Seibel,P.N., Rahmann,S., Schoen,C., Huenerberg,M., M ¨uller-Reible,C., Dandekar,T., Karchin,R., Schultz,J. and M ¨uller,T. (2009) Detecting species-site dependencies in large multiple sequence alignments.Nucleic Acids Res.,37, 5959–5968.
9. Prli´c,A., Yates,A., Bliven,S.E., Rose,P.W., Jacobsen,J., Troshin,P.V., Chapman,M., Gao,J., Koh,C.H., Foisy,S.et al.(2012) BioJava: an open-source framework for bioinformatics in 2012.Bioinformatics,
28, 2693–2695.
10. L ¨oytynoja,A. and Goldman,N. (2010) webPRANK: a
phylogeny-aware multiple sequence aligner with interactive alignment browser.BMC Bioinformatics,11, 579.
11. Wheeler,T. (2009) Large-scale neighbor-joining with NINJA. In: Salzberg,S and Warnow,T (eds).Proceedings of the 9th Workshop on Algorithms in Biofinformatics. WABI, Springer, Berlin-Heidelberg, Vol.2009, pp. 375–389.
12. Jordan,G.E. and Piel,W.H. (2008) PhyloWidget: web-based visualizations for the tree of life.Bioinformatics,24, 1641–1642. 13. Urbanek,S. (2013) rJava: Low-level R to Java interface. R package
version 0.9-6.
14. Karatzoglou,A., Smola,A., Hornik,K. and Zeileis,A. (2004) kernlab––an S4 Package for Kernel Methods in R.J. Stat. Softw.,11, 1–20.
15. Schwarz,R.F., Fletcher,W., F ¨orster,F., Merget,B., Wolf,M., Schultz,J. and Markowetz,F. (2010) Evolutionary distances in the twilight zone–a rational kernel approach.PLoS One,5, e15788.
16. Ng,A.Y., Jordan,M.I. and Weiss,Y. (2002) On Spectral Clustering: Analysis and an algorithm. In: Dietterich,T, Becker,S and Ghahramani,Z (eds).Advances in Neural Information Processing Systems 14. MIT Press, Cambridge, pp. 849–856.
17. Durbin,R., Eddy,S., Krogh,A. and Mitchison,G. (1998)Biological Sequence Analysis. Cambridge University Press, Cambridge. 18. Jaakkola,T., Diekhans,M. and Haussler,D. (1999) Using the Fisher
kernel method to detect remote protein homologies.Proc. Int. Conf. Intell. Syst. Mol. Biol., 149–158.
19. Cortes,C. and Vapnik,V. (1995) Support-vector networks.Mach. Learn.,20, 273–297.
20. Burroughs,A.M., Allen,K.N., Dunaway-Mariano,D. and Aravind,L. (2006) Evolutionary genomics of the HAD superfamily:
understanding the structural adaptations and catalytic diversity in a superfamily of phosphoesterases and allied enzymes..J. Mol. Biol.,
361, 1003–1034.
21. Seifried,A., Schultz,J. and Gohla,A. (2013) Human HAD
phosphatases: structure, mechanism, and roles in health and disease.
FEBS J.,280, 549–571.
22. Gohla,A., Birkenfeld,J. and Bokoch,G.M. (2005) Chronophin, a novel HAD-type serine protein phosphatase, regulates
cofilin-dependent actin dynamics.Nat. Cell Biol.,7, 21–29.
23. Seifried,A., Knobloch,G., Duraphe,P.S., Segerer,G., Manhard,J., Schindelin,H., Schultz,J. and Gohla,A. (2014) Evolutionary and structural analyses of mammalian haloacid dehalogenase-type phosphatases AUM and chronophin provide insight into the basis of their different substrate specificities.J. Biol. Chem.,289, 3416–3431. 24. Tucker,C.L., Hurley,J.H., Miller,T.R. and Hurley,J.B. (1998) Two
amino acid substitutions convert a guanylyl cyclase, RetGC-1, into an adenylyl cyclase.Proc. Natl. Acad. Sci. U.S.A.,95, 5993–5997. 25. de Melo-Minardi,R.C., Bastard,K. and Artiguenave,F. (2010) Identification of subfamily-specific sites based on active sites modeling and clustering..Bioinformatics,26, 3075–3082. 26. Wallace,I.M. and Higgins,D.G. (2007) Supervised multivariate
analysis of sequence groups to identify specificity determining residues.BMC Bioinformatics,8, 135.
27. Mayer,K., McCorkle,S. and Shanklin,J. (2005) Linking enzyme sequence to function using conserved property difference locator to identify and annotate positions likely to control specific functionality.
BMC Bioinformatics,6, 284.
28. Yu,G.-X., Park,B.-H., Chandramohan,P., Munavalli,R., Geist,A. and Samatova,N.F. (2005) In silico discovery of enzyme-substrate specificity-determining residue clusters..J. Mol. Biol.,352, 1105–1117. 29. Hannenhalli,S.S. and Russell,R.B. (2000) Analysis and prediction of
functional sub-types from protein sequence alignments.J. Mol. Biol.,
303, 61–76.
30. Finn,R.D., Bateman,A., Clements,J., Coggill,P., Eberhardt,R.Y., Eddy,S.R., Heger,A., Hetherington,K., Holm,L., Mistry,J.et al.
(2014) Pfam: the protein families database..Nucleic Acids Res.,42, D222–D230.
31. Gibbs,A.J. and McIntyre,G.A. (1970) The diagram, a method for comparing sequences. Its use with amino acid and nucleotide sequences.Eur. J. Biochem.,16, 1–11.
32. Ray,W.C. (2004) MAVL and StickWRLD: visually exploring relationships in nucleic acid sequence alignments.Nucleic Acids Res.,
32, W59–W63.
33. Inselberg,A. (2009)Parallel Coordinates: Visual Multidimensional Geometry and Its Applications, Springer, NY.
34. Thomsen,M. C.F. and Nielsen,M. (2012) Seq2Logo: a method for construction and visualization of amino acid binding motifs and sequence profiles including sequence weighting, pseudo counts and two-sided representation of amino acid enrichment and depletion.
Nucleic Acids Res.,40, W281–W287.
35. Dessimoz,C. and Gil,M. (2010) Phylogenetic assessment of alignments reveals neglected tree signal in gaps.Genome Biol.,11, R37.
36. Halperin,I., Wolfson,H. and Nussinov,R. (2006) Correlated mutations: advances and limitations. A study on fusion proteins and on the Cohesin-Dockerin families.Proteins,63, 832–845.
37. Lichtarge,O., Bourne,H.R. and Cohen,F.E. (1996) An evolutionary trace method defines binding surfaces common to protein families.J. Mol. Biol.,257, 342–358.
38. Chakraborty,A. and Chakrabarti,S. (2015) A survey on prediction of specificity-determining sites in proteins.Brief. Bioinform.,16, 71–88. 39. Ray,W.C., Rumpf,R.W., Sullivan,B., Callahan,N., Magliery,T.,
Machiraju,R., Wong,B., Krzywinski,M. and Bartlett,C.W. (2014) Understanding the sequence requirements of protein families: insights from the BioVis 2013 contests.BMC Proc.,8, S1.
at FAK/MDC on November 4, 2016
http://nar.oxfordjournals.org/