Abstract—Climate change is a phenomenon that is forcing the world to adapt to a different environment. In this study, Analytical Hierarchy Process (AHP) method is combined with a Geographical Information System (GIS) for flood risk analysis and evaluation in the town of Enrile, a flood-prone area located in northern Philippines. Expert opinions, together with geographical, statistical and historical data, were collected and then processed through fuzzy membership. The AHP results showed the relative weights of three identified flood risk factors, and these results were validated to be consistent, using a standard consistency index. Using the Quantum GIS software, the factor weights from the AHP were incorporated to produce a map that is color-coded representing 5 levels of estimated flood risks. Using such a GIS weighted overlay analysis map as guide, local councils and other stakeholders can act to prepare for potential flooding when the rains come or, better yet, proactively promote appropriate land-use policy that will minimize threat to lives due to flooding.
Index Terms—Analytic hierarchy process (AHP), decision support system, geographic information system (GIS), land-use policy.
I. INTRODUCTION
A. Background
Climate change is a natural hazard that everybody has to reckon with. Many natural calamities have been associated with climate change, including the tsunamis that hit Thailand and Japan, and once-in-a-hundred-years “freak storms” and “storm surges” like Hurricane Sandy in the USA. The Super Typhoon Yolanda (International code name: Haiyan), which hit the Philippines on November 8, 2013, has become a wakeup call and has highlighted the daunting challenge for the international relief operations, especially because telecommunication, power and water utilities were disrupted. These recent phenomena call for proactive empowerment of the stakeholders, adjustment to the environment, and integrated consideration of the economic, ecological and social consequences of disastrous floods. The new approach must go beyond just simply reducing losses, and move towards the building of a sustainable flood management
Manuscript received April 19, 2014; revised May 29, 2014. This work was supported in part by the Commission on Higher Education of the Philippines and the University of Cordilleras, Baguio City, Philippines.
G. P. Siddayao is with the Cagayan State University, College of Information and Computing Sciences, Tuguegarao City, Philippines 3500 (e-mail: [email protected]).
S. E. Valdez is with the Agoo Computer College, Agoo, La Union, Philippines (e-mail: [email protected]).
P. L. Fernandez, Jr. is with the Ateneo de Manila University, Quezon City, Philippines (e-mail: [email protected]).
strategy on the local and national level [1].
More recently, we have put faith in engineered solutions such as flood protection schemes. Today, however, faced with the possibility that even larger floods are on the way (and that these are likely to breach the best protection schemes), and equipped with the uncomfortable knowledge that the attempts to control nature usually increase rather than decrease damage costs, planners are starting to look for longer-term ways of mitigating the impact of floods and other disasters before they strike. When it comes to managing natural hazard risks, managing people rather than managing nature is likely to be more effective. It has become clear that our land-use policies and decisions must fit within the constraints set by nature, because ultimately nature will prevail [2].
One of the inherent difficulties of planning for natural hazards is that of time-scales. Time-frames that people can relate to are quite different to those of natural processes. The impact of draining a wetland or confining a watercourse may be a long time in coming. From the time a decision is made, decades may pass before consequential risks become apparent. Good land-use planning requires balancing the needs and wants of today, with the legacy of risks that are left to, or imposed on, future land users [2].
This study explores how the Analytic Hierarchy Process (AHP) can be integrated with spatial modeling for floodplain risk assessment. A system is developed that integrates these, and then the system is applied to the municipality of Enrile, a flood-prone area in Cagayan province which is located in the northern Philippines.
B. Preliminary 1) How AHP works
The AHP is a powerful tool that was introduced and developed by Saaty [3] in 1980. In the AHP method, obtaining the weights or priority vector of the alternatives or the criteria is required. For this purpose Saaty [3] developed the Pair-wise Comparison Method (PCM), which is explained in detail in the next section. In the AHP, the decision making process starts with dividing the problem into issues, which may optionally be divided further to form a hierarchy of issues. These issues are those to be considered in tackling the problem. These hierarchical orders help to simplify the problem and bring it to a condition which is more easily understood. In each hierarchical level, the weights of the elements are calculated [4]. Refer to Fig. 1 for the general AHP scheme.
The decision on the final goal is made considering the weights of the criteria and the alternatives. In Fig. 2, where the structure of AHP elements is illustrated, it is shown that the goal is decided through a number of different criteria.
Analytic Hierarchy Process (AHP) in Spatial Modeling for
Floodplain Risk Assessment
Generino P. Siddayao, Sony E. Valdez, and Proceso L. Fernandez
Fig. 1. Analytic Hierarchy Process (AHP) Scheme [5].
These criteria determine the quality of achieving the goal using any of the alternatives (Ai; i = 1,…,j). The Ai’s represent
the different options, choices or alternatives that could be used to reach the final aim of the project. Comparing these alternatives and defining the importance of each relative to the others are done using the PCM. Computing the importance ratios for each pair of alternatives, a matrix of pair-wise comparison ratios is obtained [4].
The pair-wise comparison within the AHP can be done through the scheme shown in Fig. 1. A questionnaire (see Fig. 3 for example) is typically used to obtain the Relative Intensity of Importance of each of the Disaster Criteria based on the expert’s judgment and perception. Each circle in the figure indicates the relative importance of an element compared to another. The sample figure shows that the economic objective is appraised by the respondent to be 3 times as important as the environmental objective and 4 times as important as the social objective. The environmental and social objectives are considered equally important in the same example.
The judgment is transferred to a Pair-wise Comparison matrix. Refer to (1) for the general form.
1
/
1
/
1
1
/
1
1
]
[
2 1 2 12 1 12
j j j j ijr
r
r
r
r
r
r
A
(1)The elements of this matrix are pair-wise (or mutual) importance ratios between the criteria which are decided on the basis of how well every criterion serves and how important each is in reaching the final goal. In creating the pair-wise comparison matrix, Saaty [3] employed an evaluation system to indicate how much one criterion is more important than another. Table I shows these numerical scale values and their corresponding intensities [4]. Pair-wise comparisons as seen in Eq. 1, are classically carried out by
asking how more valuable an alternative A is (to a given criterion C) than another alternative B. A pair-wise comparison constitutes, in the end, a square matrix where each element value ranges from 1/9 to 9. The diagonal elements of the matrix are always equal to 1 while the non-diagonal elements capture the perceived relative importance of the corresponding alternatives [4].
Fig. 2. Hierarchical tree structure of the AHP by Kordi [4].
Fig. 3. Sample questionnaire of preferences at given objectives [6].
Fig. 4. Triangular fuzzy numbers (TFN) to linguistic variables and intensity of importance. [example of very strong (l = 6; m = 7; u = 8)]. It is important to note, however, that people’s preference systems are sometimes inconsistent, so that re-interview would not necessarily remove this problem, although it would provide the opportunity to probe particular tradeoffs contributing to inconsistency [6]. A metric is usually employed to determine the consistency of the results.
2) Consistency Ratio in AHP
In practice, it is unrealistic to expect the decision-makers to provide pair-wise comparison matrices which are exactly consistent, especially in cases where there are sufficiently large numbers of alternatives. Expressing the real feelings of the decision makers involves some fuzziness (see Table I).
TABLEI:TRIANGULAR FUZZY NUMBER,INTENSITY OF IMPORTANCE AND
LINGUISTIC VARIABLES USED IN THE STUDY [7] Importance Linguistic Variables TFN’s (l, m, u) Reciprocal TFN’s (1/u, 1/m, 1/ l) 9 Extremely Strong (9, 9, 9) (1/9, 1/9, 1/9) 7 Very Strong (6, 7, 8) (1/8, 1/7, 1/6) 5 Strong (4, 5, 6) (1/6, 1/5, 1/4) 3 Moderately Strong (2, 3, 4) (1/4, 1/3, 1/2) 1 Equally Strong (1, 1, 1) (1, 1, 1)
A graphical representation of this table can be seen in Fig. 4 where an example perception of Very Strong level is highlighted.
Such fuzziness, even in expert judgment, generally leads to matrices that are not quite consistent. However some matrices might violate consistency very slightly by only two or three elements while others may have values that cannot even be called close to consistency [4]. A measure of how far a matrix is from consistency is determined by computing the Consistency Ratio (C.R.). This is obtained by calculating the matrix product of the pair-wise comparison matrix and the weight vectors, and then adding all elements of the resulting vector. After that, a Consistency Index (C.I.) is computed using the following formula:
1 -= . . max n n λ I C (2)
where n is the number of criteria and λmax is the biggest
eigenvalue (Malczewski, 1999 [8]). To determine if the comparisons are consistent or not, the Consistency Ratio (C.R.) is calculated using the formula:
. . . . = . . I R I C R C (3)
where R.I. is the Random Inconsistency index that is dependent on the sample size (refer to Table II). A reasonable level of consistency in the pair-wise comparisons is assumed if C.R. < 0.10, while C.R. ≥ 0.10 indicates inconsistent judgments.
TABLEII:RANDOM CONSISTENCY INDEX (R.I.) FOR N=1,2…8(ADAPTED FROM SAATY [3]).
N 1 2 3 4 5 6 7 8
R.I. 0.00 0.00 0.58 0.90 1.12 1.24 1.32 1.41
II. RELATED LITERATURE
A. AHP Applied to Diverse Decision Support Systems [6]
TABLEIII:APPLICATION OF AHP IN NATURAL RESOURCE AND
ENVIRONMENTAL DECISION SUPPORT SYSTEMS [6]
Author/s and Country Application Area
Saaty and Gholamnezhad (1982), USA [9]
Evaluation of strategies for the safe disposal of high-level nuclear waste. DiNardo et al. (1989), USA
[10]
Fisheries management in Maryland’s river herring fishery.
Kangas (1994), Finland [11] Participative forest management planning of a nature conservation area. Diaz-Balteiro and Romero
(1997), Spain [12]
Timber harvest scheduling problems with multiple criteria.
Mainuddin et al.(1997), Thailand [13]
Optimal crop planning for a groundwater irrigation project.
Malczewski et al. (1997), Mexico [14]
Multicriteria group decision-making for environmental conflict analysis. Itami and Cotter (1999),
Australia [15]
Ranking issues, projects and sites in integrated catchment management. AHP has been applied to many diverse areas of Decision Support Systems (DSS), with respect to natural resource and environmental management. A compiled list of applications is
provided in Table III. Saaty and Gholamnezhad [9] used AHP in comparing options for management of high-level nuclear waste, a complex decision problem involving many factors of a technological, environmental, social and political nature. In large part, the decision depends on the judgments of experts. DiNardo and others [10] noted that a major attraction of AHP is that it provides a framework for the decision-support process that is lacking in most fishery management agencies. They considered four groups of major factors or criteria for Maryland’s river herring fishery, namely biological, political, economic and social. Three fishery management policy alternatives were compared with respect to each criterion.
TABLEIV:APPLICATION OF AHP IN FLOOD RELATED STUDIES
Disaster Criteria using AHP Authors
Distance from Access Road [4], [7], [16]
Land-use Zoning [7], [16], [17]
Drainage Density [17], [18]
Distance to Drainage [19]
Soil Type [17], [18], [20]
Distance from Urban Areas, Residents [4], [7] Precipitation/Rainfall [7], [17], [20], [21] Landform; Slope/Elevation [17], [18], [19], [21], [25]
Population Density [19], [21]
Land Cover/Vegetation [18], [20]
B. AHP in Flood Studies
Table IV lists various criteria in related studies on flood-causing factors using AHP as the methodology for Decision Support System. This shows the power and versatility of AHP in multiple criteria for disaster analysis.
Different studies identify different set of factors. Moreover, these factors do not necessarily have the same importance across different contexts. For instance, based on the study of [7], [16], the contribution of Distance from Access Road has Low Significance compared with 3 and 6 other factors, respectively; while in another study [4], it has High Significance compared with 6 other factors at 22.59%. On Land-Use Zoning, the authors [7], [16] found it to have High Significance at 50.5% and 33.4% compared with 3 and 6 other factors, respectively; whereas another study [17] shows Significant contribution at 17% compared with 5 other factors. For Drainage Density, authors [17], [18] reflect High Significance at 25% and 27% compared with 5 and 4 other factors, respectively. All of the above mentioned studies have a Reasonable Consistency Ratio (CR) ≤ 0.1.
C. GIS Technology in Flood Hazard Study and Disaster Rebuilding Activities
There have been many studies, especially in the advanced countries, adopting GIS technology in the investigation of flood hazard risk, and its spatial-time distribution has been indispensable in several similar studies [23], [24].
Christchurch in New Zealand was devastated by earthquake in 2011, and GIS was used to plan and rebuild the city’s horizontal infrastructure such as roads, freshwater supply, waste water and storm water systems. It is a collaboration of 20 public and private organizations, 1,000 users with 26 different roles, 6,000 daily views provided to address the huge scale of the biggest engineering undertaking in the country. Planners needed to know of other services running alongside the pipes. The viewer allowed the user to turn layers of information off and on to view as required, or
overlay different aspects of an area as transparencies that ensured a complete view of services or environmental information [25].
Via applications of the integrated GIS approach, the various fuzzy systems for land-use suitability analysis have been established. Case studies have given good results for the experimental areas. The approach brings land-use planners important supports for their decisions so as to enhance socio-economic benefits and balance environmental impacts under the limitation of natural resources [26].
III. CONCEPTUAL FRAMEWORK
Fig. 5 shows how to produce a DSS and Geo-hazard map. All the Boolean algebra operations (e.g., intersection, union, negation, etc.) can be easily extended to fuzzy set operations. Therefore, if we can find a scheme to represent the spatial data from a fuzzy set perspective, then all the Boolean logic-based operations in GIS should also be extendible to fuzzy logic operations, which will lead to fuzzy cartographic modeling. Combining fuzzy set theory with GIS modeling procedures not only endows the latter with the capability to deal with imprecision and vagueness, but also promotes further applications of fuzzy sets in the spatial decision making process [26].
IV. METHODOLOGY
Fig. 6 shows the methodology used in this study. The initial stage is the data collection stage, in which spatial data about the target area and some experts’ judgment about flood assessment criteria are collected. Phase I is related to GIS analysis, and focuses on converting collected vector maps to raster and spatial analysis functions (map overlay using Boolean functions, distance analysis and reclassification). The calculation of criteria weights are in Phase II, and this uses a developed tool adopting AHP principle. Here, the Consistency Ratio is computed in order to verify the consistency of the experts’ judgment. Finally, Phase III covers the integration between criteria weights and maps, producing a Geo-hazard map which shows flood risk levels. Using such a Geo-hazard map, the best land-use classification may easily be determined [7] and an Emergency Evacuation Plan can be systematically executed.
Fig. 5. Conceptual framework of the study [26].
A. Data Collection
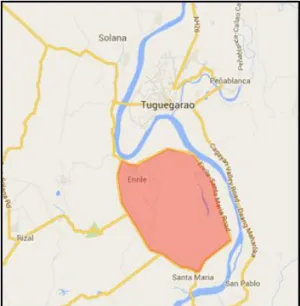
The municipality of Enrile is in the province of Cagayan, northern Philippines, with Latitude 17°33’37” N, Longitude 121°42’54” E, and with a population of about 15,000. It is a low lying catchment area, seasonally flooded by combined torrential waters of Cagayan, Magat and Pinacanauan Rivers.
Climate type is tropical with rainy season from June - November, with obvious seasonal variation on precipitation.
Fig. 6. Methodology integrating spatial analysis with AHP [7]. Fig. 7 shows red shade on political boundary, orange shade for road network and blue shade for the river for the municipality of Enrile. The rivers twists and turns, creating meanders along its banks. These meanders begin as the river tries to flow along a shallow part of its bed. As the water swings to one side, it cuts into its bank. As this cut deepens, it becomes a shallow bend. Some of the eroded material is deposited on the inside of the bend and forms a small beach. Over time, the cut becomes deeper and the beach becomes larger, producing a snake-like bend in the river [27]. The above natural features in climate and terrain are the main factors for causing flood hazard in this studied area. Refer to Fig. 7 for some details.
Fig. 7. Location of area of study.
There are primarily two types of data sources of Enrile town: (1) Graph Data: political administration area map and the topographic map; (2) Document Data: population, socio-economic statistics. Unfortunately, there is no weather station and rain gauge in the town. Thus, weather related factors were not considered in this study.
For the Expert Judgment portion, a questionnaire was given to the Officers of the Municipal Planning Development Office, GIS Specialist, Municipal Health Office, Municipal Agriculturist, Municipal Administrator, a former Barangay
Captain and some residents of the municipality of Enrile. TABLEV:DEFINING THE DISASTER CRITERIA
Disaster Criteria (DC) Description
Population Density (F1) The number of people per unit area, for a given site. This is given in units of people per square kilometer. Distance from Riverbank (F2) How near or far (in meters) a given site
is from the nearest Riverbank. Site Elevation (F3) How high or low a given site is. This is
given in units of meters above sea bed reference level of Google Map.
B. Modeling and Designing the System 1) Disaster criteria selection
In the evaluation system, referring to previous research works and also considering the available data from Enrile, the evaluation factors chosen are Population Density (F1), Distance from Riverbank (F2), and Site Elevation (F3) [28].
2) Judging set and membership grade
Mainly referring to existing flood hazard survey data, relevant researches and standards, after quantitatively grading each factor, grading schedule of evaluation factors of flood hazard risk in Enrile town was constructed. This is shown in Table V. For complexity of disaster environmental system, risk here did not contain absolute meaning. The general grading method often adopts logic information category method or feature category method, with which the studied object is divided into 3 or 5 Levels [29].
C.Construction of Weight Sets
Since there are contributions between factors triggering the disaster, it is important to accurately evaluate risk to analyze the interaction and correlation between criteria, and define their status and impact in the whole evaluation system respectively [28]. All table computations and operations are based from Lawal, Matori et al. [17].
Based on the gathered data, individually, only one expert is consistent. However, by aggregating the experts’ judgment through averaging, the resulting matrix is very consistent.
Following the steps in AHP [30], [31], by means of multiple comparisons, a judge matrix was constructed (see Table VI), and from which we could ultimately calculate the weight of each factor (see last column of Table VII) to produce the (weight) column vector w.
TABLEVI:(STEP 1)PAIR-WISE COMPARISON WITH RESPECT TO DISASTER
CRITERIA. DC (rij) F1 F2 F3 F1 1 1/5 1/3 F2 5 1 3 F3 3 1/3 1 TOTAL 9.0000 1.5333 4.3333
TABLEVII:(STEP 2)CALCULATION OF FUZZY WEIGHT USING THE MIDDLE VALUE IN FIG.4 DC: Aij F1 F2 F3 ) ( ∑ 1 = = nj Aij Ti n Ti Wi= F1 0.1111 0.1304 0.0769 0.3185 0.1062 F2 0.0556 0.6522 0.6923 1.9000 0.6333 F3 0.3333 0.2174 0.2308 0.7815 0.2605 TOT 1.0000 1.0000 1.0000 3.0000 1.0000
D.Calculation of Vector Aw (Matrix A Times Vector w) [32].
=
*
C
A w
1
/
1
/
1
1
/
1
1
2 1 2 12 1 12
n n n nr
r
r
r
r
r
(4)*
[
w
1
w
n-1w
n]
T=
[
c
1
c
n-1c
n]
TTABLEVIII:(STEP 3)MATRIX MULTIPLIED BY WEIGHT (WI)
DC (rij) F1 F2 F3 F1 1 1/5 1/3 F2 5 1 3 F3 3 1/3 1 * * * Wi 0.1062 0.6333 0.2605
R.I. = 0.58 at n = 3 in Table II, adapted from Saaty [3], Lawal, et al. [417], Cabala [33] and refer to Table IX:
∑
1 = 1 = max n i wi i c nλ
(5) 0387 . 3 = ) 1161 . 9 ( 3 1 = maxλ
From Equation 2 0194 . 0 = 1 -3 3 -0387 . 3 = 1 -= . . max n n λ I C From Equation 3 0334 . 0 = 58 . 0 0194 . 0 = . . . . = . . I R I C R CTABLEIX:SUMMARY OF VALUES
Parameters Values
λmax 3.0387
C.I. 0.0194
R.I. 0.58
C.R. 0.0334 (≤ 0.1) REASONABLE
TABLEX:NORMALIZED WEIGHT VALUES AFTER PROVINGC.R.≤0.1[34]. Disaster Criteria Normalized Weight (Wi)
F1 0.1062
F2 0.6333
F3 0.2605
TABLEXI:(STEP 4)RESULT OF MULTIPLYING THE WEIGHT AND DERIVATION OF ΛMAX DC: (Aw)i F1 F2 F3 ∑ni=1
c
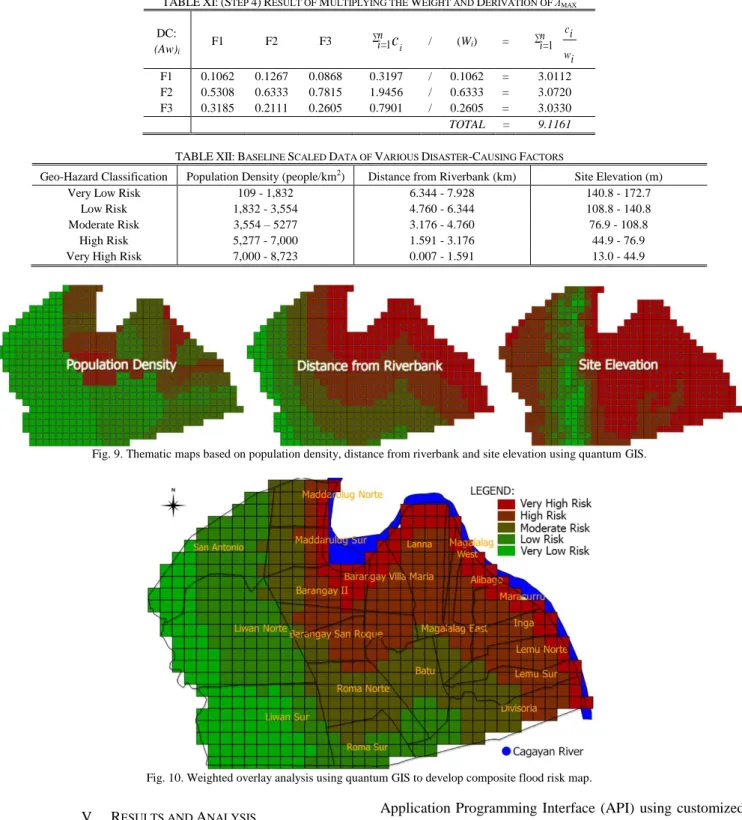
i / (Wi) = i w i c n i ∑ 1 = F1 0.1062 0.1267 0.0868 0.3197 / 0.1062 = 3.0112 F2 0.5308 0.6333 0.7815 1.9456 / 0.6333 = 3.0720 F3 0.3185 0.2111 0.2605 0.7901 / 0.2605 = 3.0330 TOTAL = 9.1161TABLEXII:BASELINE SCALED DATA OF VARIOUS DISASTER-CAUSING FACTORS
Geo-Hazard Classification Population Density (people/km2) Distance from Riverbank (km) Site Elevation (m)
Very Low Risk 109 - 1,832 6.344 - 7.928 140.8 - 172.7
Low Risk 1,832 - 3,554 4.760 - 6.344 108.8 - 140.8
Moderate Risk 3,554 – 5277 3.176 - 4.760 76.9 - 108.8
High Risk 5,277 - 7,000 1.591 - 3.176 44.9 - 76.9
Very High Risk 7,000 - 8,723 0.007 - 1.591 13.0 - 44.9
Fig. 9. Thematic maps based on population density, distance from riverbank and site elevation using quantum GIS.
Fig. 10. Weighted overlay analysis using quantum GIS to develop composite flood risk map. V. RESULTS AND ANALYSIS
The main visualization output of this study is shown in Fig. 10. This was generated after calculating the criteria weights using AHP and integrating these weights with some GIS-based steps that include layers overlay, raster conversion, and some clipping. The AHP computation results reveal that the Distance from Riverbank (F2) is assessed by experts to be the largest contributing factor for disaster at 63.33% followed by Site Elevation (F3) at 26.05% and Population Density (F1) at 10.62% (see Fig. 8). The consistency as measured in the pair-wise comparisons of C.R. = 0.0334 (value < 0.10) indicates that the basis expert judgment is reasonably consistent.
For the location-based data, the Elevation and Distance from Riverbank were taken from Google Map’s available
Application Programming Interface (API) using customized grids and a developed Python program for the existing Quantum GIS maps. Finally, a Geo-hazard map was generated from the integration of criteria weights from AHP with the criteria maps into the GIS software. The map presents a rank of highest and lowest suitability areas. The geo-hazard classification is divided into five classes: Very Low Risk, Low Risk, Moderate Risk, High Risk and Very High Risk (see Fig. 10).
VI. CONCLUSIONS
In this study, AHP is combined with GIS to come up with a tool for evaluating flood risks in all areas in the municipality of Enrile. Such tool was developed after gathering topological information about the municipality and also reliable (C.R. <
0.10) expert criteria assessment for flood risks, and then applying fuzzy logic techniques to an open source Quantum GIS software.
The developed tool will be a very valuable resource for consulting, planning agencies and local governments in managing risk, land-use zoning, damage estimates, land tax valuation, life and property insurance claim validation, good governance, lifeline emergency services and remediation efforts to mitigate risks. Moreover, the technique applied in this study can easily be extended to other areas, where other factors may be considered, depending on the availability of data.
RECOMMENDATIONS
The knowledge domain of hydrologists, meteorologists, geologists and actuarial science experts is much needed for activities in Natural Hazard Research. Getting such experts to help makes sure that inputs, processes and outputs are scientific, reliable and sustainable.
A pressing problem, however, for using fuzzy set theory in GIS human knowledge disaster modeling is the multitude of flood causing factors, brought by the complexity of the disaster phenomena, which sometimes lead to conflicting expert opinion. To this end, AHP or similar factor weighing mechanisms may be applied to develop reliable models.
Local councils can use these models so that they can come up with land-use policies related to natural hazard risk that fit within the time-frame of natural processes.
It is hoped that this study would provide a scalable AHP in GIS Disaster decision support system that can be used in diverse environment with their own disaster-causing factors, for coastal, mountainous, metropolitan, suburban areas, etc.
ACKNOWLEDGMENT
The authors wish to express their gratitude to Honorable Mayor Kim Stephen T. Turingan of Enrile, Cagayan, Philippines, his administrative staff and Municipal Council for their collaboration in this research.
REFERENCES
[1] S. Chughtai, “Typhoon haiyan,” Oxfam international, pp. 1-18, December 7, 2013.
[2] A. MacKenzie, “Climate change and natural hazards,” E.NZ magazine, vol. 10, no. 6, pp. 9-12, November/December 2009.
[3] T. L. Saaty, The Analytic Hierarchy Process: Planning, Priority Setting, Resource Allocation, Mcgraw-Hill, New York, NY. 1980. [4] M. Kordi, “Comparison of fuzzy and crisp analytic hierarchy process
(AHP) methods for spatial multicriteria decision analysis in GIS,” Department of Technology and Built Environment at University of Gavle, pp. 7-9, September 2008.
[5] L. Diaz-Balteiro and C. Romero, “Modeling timber harvest scheduling problems with multiple criteria: an application in Spain,” Forest Science, vol. 44, no. 1, pp. 47-57, 1997.
[6] L. D. DiNardo and B. Golden, “Using decision analysis to Maryland’s River herring fishery: An application of AHP,” Journal of Environmental Management, vol. 29, no. 1, pp. 193-213, 1989. [7] S. Harrison and M. Qureshi, “Application of the analytic hierarchy
process to riparian revegetation policy options,” Smallscale Forest Economics, Management and Policy, vol. 2, no. 3, pp. 441-458, 2003. [8] J. Malczewski, “GIS and multiple-criteria decision analysis,” New
York: John Wiley and Son, 1999.
[9] T. Saaty and H. Gholamnezhad, “High-level nuclear waste management: analysis of options,” Environment and Planning B, vol. 9, no. 1, pp. 181-196, 1982.
[10] E. H. Ibrahim, S. E. Mohamed, and A. A. Atwan, “Combining fuzzy analytic hierarchy process and GIS to select the best location for a wastewater list station in Elmahalla El-Kubra, North Egypt,” International Journal of Engineering and Technology IJET-IJENS, vol. 11, no. 5, October, 2011.
[11] J. Kangas, “An approach to public participation in strategic forest management planning,” Forest Ecology and Management, vol. 70, no. 1, pp. 75-88, 1994.
[12] J. Montgomery, L. Prahl, P. Shellenbarger, and W. Wilkinson, “Promoting multi-benefit floodplain conservation strategies along the lower Santa Clara River through the prioritization of agricultural conservation easements,” p. 33, 2012.
[13] M. Mainuddin, A. D. Gupta, and P. R. Onta, “Optimal crop planning model for an existing groundwater irrigation project in Thailand,” Agricultural Water Management, vol. 33, issue. 1, pp. 43-62, 1997. [14] J. Malczewski, R. Moreno-Sanchez, L. Bojorquez-Sanchez and E.
Ongay-Delhumeau, “Multicriteria group decision-making model for environmental conflict in the analysis in the Cape Region, Mexico,” Journal of Environmental Planning and Management, vol. 40, no. 3, pp. 349-374, 1997.
[15] R. Itami and M. Cotter, “Application of analytical hierarchy process to rank issues, projects and sites in integrated catchment management,” in Proc. the 2nd International Conference on Multiple Objective Decision Support Systems for Land, Water and Environmental Management (MODSS’99), Queensland Department of Natural Resources and Mines, Brisbane, Australia, 2012.
[16] L. Tao, Z. Hongjiang, and W. Jingdong, “Application of analytic hierarchy process in debris flow risk degree assessment - a case study of Miyun County, Beijing City,” Bulletin of Soil and Water Conservation, vol. 28 no. 5, pp. 6-10, 2008.
[17] D. Lawal, A. Matori, A. Hashim, K. Yusof, and I. Chandio, “Detecting flood susceptible areas using GIS-based analytic hierarchy process,” in Proc. International Conference on Future Environment and Energy, vol. 28, pp. 3-4, 2012.
[18] S. S. Saini and S. P. Kaushik, “Risk and vulnerability assessment of flood hazard in part of Ghaggar basin: A case study of Guhla block, Kaithal, Haryana, India,” International Journal of Geomatics and Geosciences, vol. 3, no. 1, p. 10, 2012.
[19] R. Sinha, G. V. Bapalu, L. K. Singh, and B. Rath, “Flood risk analysis in the Kosi River Basin, North Bihar using multi-parametric approach of analytical hierarchy process (AHP),” J. Indian Soc. Remote Sens, vol. 36, pp. 293-307, December 2008.
[20] S. Yahaya, “Multicriteria analysis for flood vulnerable areas in Hadejia-Jama’are River Basin, Nigeria,” American Society for Photogrammetry and Remote Sensing, p. 6, 2008.
[21] H. Zhang, J. Zhang, and J. Han, “The assessment and regionalization of flood/waterlogging disaster risk in middle and lower reaches of Liao River of Northeast China,” in Proc. Fifth annual IIASA-DPRI forum on Integrated Disaster Risk Management, pp. 103-118, 2005. [22] O. Ozcana and N. Musaoglu, “Vulnerability analysis of floods in urban
areas using remote sensing and GIS,” Remote Sensing for Science, Education and Natural and Cultural Heritage, p. 383, 2010. [23] W. E. Mejia-Navarro, “Geological hazard and risk evaluation using
GIS: Methodology and model applied to Medellin, Colombia,” Bulletin of the Association of Engineering Geolosists, vol. 31, no. 4, pp. 459-481, 1994.
[24] X. T. Nguyen and R. Vogel, “Application of the analytic hierarchy process in the multiple criteria decision analysis of retention areas for flood risk management,” EnviroInfor 2007 (Warschau) Environmental Informatics and Systems Research, pp. 675-682, 2007. [25] L. Hurley, “Mapping the problem,” Engineering Insight, vol. 14, no. 4,
pp. 25-29, July/August 2013.
[26] T. T. Nguyen, “Fuzzy GIS approach to land capability and suitability analysis,” 2013.
[27] B. Taylor, Oceans and Rivers, USA: Grolier,p. 23, 2007.
[28] M. Anqing and J. Junchao, “Fuzzy evaluation of flood risk rating in Laoshan district based on GIS,” in Proc. International Conference on Computer, Networks and Communication Engineering, 2013. [29] L. Peiying, D. Jun, and L. Lejun, Geologic features and evaluation of
disasters on Chinese coastal zone, Bejing: China Ocean Press,pp. 207-218, 2007.
[30] Z. Zhen, W. Longchang, and Y. Song, “Study on the AHP comprehensive evaluation of sustainable water resource utilization of sichuan province,” Agricultural Research in The Arid Areas, vol. 4, pp. 213–218, 2009.
[31] S. Tesfamariam and R. Sadiq, “Risk-based environmental decision-making using fuzzy analytic hierarchy process (F-AHP),” Stoch Environ Res Risk Assess, vol. 21, pp. 35-50, 2006.
[32] C. J. Van Westen, T. W. J. Van Asch, and R. Soeters, “Landslide hazard and risk zonation: Why is it still so difficult,” Bulletin of Engineering Geology and the Environment, vol. 65 no. 2, pp. 176–184, 2005.
[33] P. Cabala, “Using the analytic hierarchy process in evaluating decision alternatives,” Operations Research and Decisions, vol. 1, pp. 5-23, 2010.
[34] B. Basaran, “A critique on the consistency ratios of some selected articles regarding fuzzy AHP and sustainability,” in Proc. 3rd International Symposium on Sustainable Development, 2012.
Generino P. Siddayao was born in Tuguegarao City,
Philippines, on April 21, 1980. He received his B.S. and M.S. degrees in information technology from Saint Paul University Philippines (SPUP), Tuguegarao City, Philippines in 2001 and 2004, respectively. He takes interest in systems analysis and programming for various enterprise applications.
He has worked in the academe for over 12 years. He is currently an assistant professor and a University dean for eight (8) campuses of Cagayan State University at Cagayan, Philippines. His current research interests include artificial intelligence applications in geographical information systems for risk assessment and resource management.
Prof. Siddayao is a member of Philippine Society of Information Technology Educators (PSITE) and currently the President of Council of Deans in Information Technology Educators (CDITE) in Region 02, Philippines.
Sony E. Valdez was born in Agoo, La Union,
Philippines, on March 15, 1984. He received his B.S. degree in computer science from Agoo Computer College, La Union, Philippines in 2004, and his M.S. degree in information technology from the University of the Cordilleras in 2010. He is currently studying for his doctorate in information technology at the University of the Cordilleras in the Philippines. He takes interest in the field of artificial intelligence, video games, pokemon and programming.
He has worked in the programming industry for over 11 years and he has been teaching masters and college IT students for the past 3 years. His current research involves developing an artificial intelligence to play in competitive games such as rock-paper-scissors. He is looking to extend the AI research to include boxing games, Pokemans and Street Fighting.
Prof. Valdez is the current president of Python.PH, Inc, a non-profit organization with the goal of spreading the programming language Python to the country. He is a member of the International Game Developer's Association (Manila Chapter) since 2009.
Proceso L. Fernandez was born in Quezon City,
Philippines, on June 19, 1972. He received the B.S., M.S. and Ph.D. degrees in computer science from the Ateneo de Manila University, Quezon City, Philippines, in 1994, 2001 and 2009, respectively. He is currently an associate professor at the same university. He has been a visiting researcher at the Nara Institute of Science and Technology, Nara, Japan, since 2011. He has also been a visiting professor at the Ateneo de Davao University, Davao, Philippines and at the University of the Cordilleras, Baguio, Philippines. He is currently a member of the Computing Society of the Philippines.
![Fig. 2. Hierarchical tree structure of the AHP by Kordi [4].](https://thumb-us.123doks.com/thumbv2/123dok_us/9782376.2862412/2.892.467.813.217.749/fig-hierarchical-tree-structure-ahp-kordi.webp)