Number
369
+
March
1,
2006
Physical
and
Mental
Health
Characteristics
of
U.S.
and
Foreign-Born
Adults:
United
States,
1998–2003
byAchintyaN.Dey,M.A.,andJacquelineWilsonLucas,M.P.H.,Divisionof HealthInterviewStatistics
Abstract
Objective—This report presents national prevalence estimates of selected
measures of physical health status and limitations, health care access and utilization, and mental health status among the civilian noninstitutionalized population of U.S. and foreign-born adults aged 18 years and over in four race-ethnicity groups in the United States.
Methods—The estimates in this report were derived from the Family Core and
Sample Adult components of the 1998–2003 National Health Interview Surveys, conducted annually by the Centers for Disease Control and Prevention’s National Center for Health Statistics (NCHS). Estimates were generated and comparisons conducted using the SUDAAN statistical package to account for the complex survey sample design. Data were age adjusted to the 2000 U.S. standard population.
Results—In general, the foreign-born population was younger, less likely to
have a high school diploma, more likely to be poor, heavily concentrated in the central cities of metropolitan areas, and more likely to live in large families, compared with their U.S.-born counterparts. Hispanic immigrants were the least likely to have health insurance or to have a usual source of health care compared with other immigrant groups.
Non-Hispanic black and Hispanic adults, regardless of nativity, were more likely to be obese than non-Hispanic white and non-Hispanic Asian adults.
However, non-Hispanic black and Hispanic immigrant adults were significantly less likely to be obese than their U.S.-born counterparts. Hispanic immigrants were more likely to be obese the longer they lived in the United States. Foreign-born non-Hispanic black and non-Hispanic immigrant adults experienced fewer symptoms of serious psychological distress compared with their U.S.-born counterparts.
Conclusions—There are significant differences in physical health status and
mental health status among U.S.-born and foreign-born adults. Foreign-born adults enjoy considerable advantages over their U.S.-born counterparts for many health measures despite limited access to health care and unfavorable sociodemographic characteristics. Differences in the impact of length of stay in the United States on immigrant health suggest that the role of acculturation in understanding immigrant health is complex and may differ for various race/ethnicity groups.
Keywords: immigrant c race c ethnicity c obesity c self-assessed health c serious
psychological distress c smoking c ADL c IADL c acculturation c National Health
Interview Survey c National Center for Health Statistics
Introduction
Immigrants are the fastest growing segment of the U.S. population (1). The foreign-born population of the United States grew from 9.6 million in 1970 to 32.5 million in 2002 (2,3). As a percentage of the total population, the foreign-born population increased from 4.7% in 1970 to 11.5% in 2002. Because of the amendments to the Immigration and Nationality Act of 1965, the flow of immigrants to the United States has shifted away from Europe to Latin America and Asia. Today’s immigrants are more diverse and arrive from every corner of the world (4). Currently, over one-half of the immigrants to the United States are from Latin America (36% from Central America, 10% from the Caribbean, and 6% from South America), 25% are from Asia, 14% are from Europe, and 8% are from other regions (3).
As the immigrant population grows, studies of their health outcomes are becoming of increasingly crucial interest to health care researchers and policy makers. Previously published studies have examined various health outcomes for immigrants, including health status, health insurance, and health care utilization (5–9,12). Almost all of these studies compared immigrants’ health with their native-born counterparts and demonstrated disparities in health and
U.S. DEPARTMENT OF HEALTH AND HUMAN SERVICES
Centers for Disease Control and PreventionNational Center for Health Statistics
http://www.ilw.com
ILW
ILW COM
COM
PROVIDED BY
T h e l e a d i n g
immigration
law publisher
2
Advance
Data
No.
369
+
March
1,
2006
access to care (5–8,9,12). Other studies of health measures such as self-assessed health, bed disability days, functional limitations, and chronic conditions have also shown that generally, immigrants fare better than their native-born counterparts (5–6,9–10). However, some studies have also indicated that despite higher rates of education and
employment, immigrants were more likely to be without health insurance than their U.S.-born counterparts (7–8,11–12).
Although many studies of immigrant health issues have focused primarily on physical health status or on dimensions of health care such as health insurance coverage, few studies have included mental health. Very little research has focused on both mental and physical health in the same study population, nor has much research examined the relationship between mental health and physical health in U.S.-born and immigrant adults. Using data from the 1998–2003 National Health Interview Surveys, this report presents estimates of selected physical health and mental health problems (including selected health behaviors) and health care access among major
race/ethnicity-nativity groups in the United States. In addition, this report examines immigrants’ physical and mental health status and their length of stay in the United States. Understanding these differences will assist policy makers in developing culturally diverse community intervention programs and allocating resources to fulfill health care needs.
Methods
Data
source
Data used in this report are from the Sample Adult component of the 1998–2003 National Health Interview Surveys (NHIS). NHIS is an annual survey of the civilian
noninstitutionalized population of the United States, conducted by NCHS. Basic demographic and health information are collected on all household members in the Family Core questionnaire. Additional information is collected from one randomly selected
adult aged 18 years and over in the sample adult questionnaire and about one randomly selected child aged 0–17 years in the sample child questionnaire. Data on the sample adult questionnaire is self-reported, except when
respondents are physically incapable of responding for themselves. The sample child data are collected from an adult who is knowledgeable about the child’s health.
Measurement
Sociodemographic characteristics In this report, U.S.-born is defined as having been born in one of the 50 States, the District of Columbia, Puerto Rico, or any of the other U.S. territories (e.g., American Samoa, Guam, U.S. Virgin Islands, and Northern Marianas). Persons born in a foreign country to parents who were U.S. citizens were also defined as U.S.-born (3). The terms ‘‘immigrant’’ and ‘‘foreign-born’’ are used interchangeably in the text as are the terms ‘‘U.S.-born’’ and ‘‘native born.’’ Foreign-born persons are defined as people living in the United States who were not U.S. citizens at birth (3). All naturalized citizens, legal permanent residents, undocumented immigrants, and persons on long-term temporary visas (such as students or guest workers) also fall in this category.
Data are presented for four race/ethnicity subpopulations: Hispanic, non-Hispanic white, non-Hispanic black, and non-Hispanic Asian adults. Race and ethnicity data were tabulated according to the revised standards for race/ethnicity data issued by the Office of Management and Budget (OMB) (13), which were fully implemented in the 1999 NHIS. Data from an
intermediate editing stage allowed creation of the revised OMB race categories for the 1998 data (where the revised guidelines were not yet
implemented), giving a consistent set of race categories for the data years included in these analyses.
Data on age, sex, educational level, family income, poverty level, family size, employment status, marital status, place of residence, and region of residence are presented for all U.S.- and
foreign-born race/ethnicity subgroups. Data are also shown on the length of residence in the United States for foreign-born race/ethnicity subgroups. The length of residence was categorized as less than 5 years and 5 years or more.
Physical health status and limitations
Four measures of physical health status and limitations are included in these analyses: self-assessed health status, activities of daily living (ADLs), instrumental activities of daily living (IADLs), and annual number of bed days. Estimates are also presented for four self-reported chronic diseases (diabetes, hypertension, cardiovascular disease, and obesity) as well as one health behavior (smoking). Self-assessed health status was coded into three categories: excellent or very good, good, and fair or poor. ADL estimates are presented for only those adults who needed help from other persons with personal care needs such as eating, bathing, dressing, or getting around inside the house. Similarly, IADL estimates are presented for only those adults who needed help from other persons with routine needs such as everyday household chores, doing necessary business, shopping, or getting around for other purposes. Data on the annual number of days spent in bed due to illness was coded into three
categories: none, 1–6 days, and 7 days or more. An average annual number of bed days is also shown. Data on diabetes, hypertension, and
cardiovascular disease were all based on self-reported information about whether the respondent had ever been told he or she had the condition (yes or no). Body mass index (BMI) was calculated from self-reported height and weight, and a BMI of 30 or more was considered ‘‘obese.’’ Smoking status estimates are presented only for current smokers who have smoked 100 cigarettes in their lifetime and currently smoke. Mental health status
Six questions (feeling sad, nervous, restless, hopeless, that everything was an effort, or worthless) were used to
measure the prevalence of serious psychological distress (SPD) as assessed on an index of psychological distress developed by Kessler, et al. (14). The questions asked how often the
respondent experienced these symptoms during the past 30 days. The response codes for each of the six items ranged from zero (‘‘none of the time’’) to 4 (‘‘all of the time’’) and were summed to yield total score ranging from zero to 24. A score of 13 or more for this scale was used here to define SPD.
Health care access and utilization Indicators of health care access and utilization included health insurance coverage (private, Medicaid or other public insurance, other coverage, and uninsured), having a source of health care when sick (yes or no), unmet medical needs due to cost (unable to afford mental health or dental care, or prescribed medication, all measured as yes or no), and time since last spoke to a health professional. Total number of doctor visits in the past 12 months was coded as ‘‘none,’’ ‘‘1–3 visits,’’ ‘‘4–9 visits,’’ and ‘‘10 visits or more.’’
Statistical
analysis
Six years of data were combined to increase the reliability of estimates for some of the smaller population
subgroups. All estimates with a relative standard error of more than 30% are identified with an asterisk. SUDAAN software was used to generate all estimates and their standard errors (15). All estimates were weighted using the sample adult record weight to reflect the U.S. civilian noninstitutionalized population aged 18 years and over. It should be noted that the 1998–2002 NHIS weights were calculated using 1990 census data. Beginning with the 2003 data, NHIS transitioned to weights derived from the 2000 census-based population estimates. The impact of this transition was assessed for the 2002 NHIS by comparing estimates for selected health characteristics using the 1990 census-based weights with those using the 2000 census-based weights
standard population aged 18 years and over (17,18).
Standard errors are shown for all percentages in the tables. No
adjustments were made for multiple comparisons. The statistical significance of differences between point estimates was evaluated using a two-sided t-test at the 0.05 level. Terms such as ‘‘greater than,’’ ‘‘less than,’’ ‘‘more likely,’’ ‘‘less likely,’’ ‘‘compared with,’’ or ‘‘opposed to’’ indicate a statistically significant difference between estimates. Terms such as ‘‘similar’’ or ‘‘no difference’’ indicate that the estimates are not significantly different. A lack of commentary about any two estimates should not be interpreted to mean that a
t-test was performed and the difference
was found to be not significant.
Results
Sociodemographic
characteristics
Table 1 presents frequencies and age-adjusted percent distributions of selected demographic characteristics of U.S.-born and foreign-born adults for four race/ethnicity groups (non-Hispanic white, non-Hispanic black, non-Hispanic Asian, and Hispanic). Non-Hispanic
white persons are hereafter referred to as ‘‘white persons,’’ non-Hispanic black persons are referred to as ‘‘black persons,’’ and non-Hispanic Asian persons are referred to as ‘‘Asian persons.’’
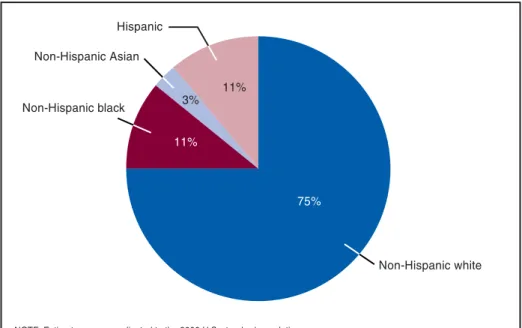
Figures 1–3 provide the distribution of the four race/ethnicity groups for the total population, for U.S.-born and foreign-born persons. More than
80 percent of U.S.-born adults (Figure 2) were white persons, followed by black persons (12%), Hispanic persons (6%), and Asian persons (0.6%). Among foreign-born adults (Figure 3), the race/ethnicity distribution was somewhat different—Hispanic adults were the largest ethnic group (47%), followed by white (24%), Asian (21%), and black adults (8%).
Age—Overall, the foreign-born
adult population was younger than the native-born adult population. Among the specific race/ethnicity groups, this pattern remained the same, with the exception of white adults. Foreign-born white adults had a higher proportion of elderly persons aged 65 years and over than U.S.-born white adults or any of the other foreign-born groups. For all other race/ethnicity groups, the
proportion of elderly persons was higher
and has been published elsewhere (16).
All estimates presented in this report Figure1.Percentdistributionoffourmajorrace/ethnicitysubgroups:UnitedStates, 1998–2003
4
Advance
Data
No.
369
+
March
1,
2006
Figure2.PercentdistributionoffourmajorU.S.-bornrace/ethnicitysubgroups: UnitedStates,1998–2003
Figure3.Percentdistributionoffourmajorforeign-bornrace/ethnicitysubgroups: UnitedStates,1998–2003
among U.S.-born persons than among foreign-born persons.
Sex—The ratio of men to women
was highest among U.S.-born Asian adults (112 men per 100 women) and lowest among U.S.-born black adults (78 men per 100 women). Among foreign-born adults, there were significantly more women than men in
every race/nativity group except Hispanic adults.
Education—Over one-third of
immigrant adults had not received a high school diploma (34%), compared with 15% of U.S.-born adults. However, there was a notable difference among race/ethnicity groups of U.S.-born and foreign-born adults in their levels of
educational attainment. Immigrant white and black adults were more likely to have at least a college degree (35% and 21%, respectively) compared with their U.S.-born counterparts (26% and 13%, respectively). More than one-half of Hispanic immigrants (57%) had less than a high school diploma, compared with U.S.-born Hispanic adults (32%).
Family income—Regardless of
nativity, Asian adults were more likely to live in households whose income was $75,000 or more compared with other U.S.- and foreign-born persons. One-fourth of immigrant black adults lived in households earning $75,000 or more (25%), which is about
7 percentage points higher than their native-born counterparts (18%). However, U.S.-born Hispanic adults were more likely to live in households earning $75,000 or more (23%) than their foreign-born counterparts (14%).
Poverty status—In general,
immigrants were more likely to be living in poor households than their native-born counterparts (13% compared with 8%). Among the U.S.-born
population, Asian adults were the least likely to be living in poor households (5%), followed by white (6%), Hispanic (13%), and black adults (16%). White immigrants were the least likely to be living in poor households (8%), followed by Asian (10%), black (11%), and Hispanic immigrants (18%).
Family size—Immigrants were more
likely to live in larger families than their U.S.-born counterparts. Nearly one-quarter (23%) of immigrant Asian adults and one-third (33%) of immigrant Hispanic adults lived in households of five or more persons. Over one-half of U.S.-born adults lived in a household with at least two members in the family (54%) compared with their immigrant counterparts (38%). The proportion of single-person households was higher among U.S.-born Asian adults (21%) than among immigrant Asian adults (13%).
Marital status—Overall, immigrant
adults were more likely to be married than their U.S.-born counterparts (65% and 57%, respectively). U.S.-born white, black, Asian, and Hispanic adults were more likely to be never married than their foreign-born counterparts.
Place and region of
residence—Immigrants were more likely
to live in central cities or noncentral city areas of MSAs than U.S.-born adults. Most U.S.-born adults lived in the South (37%), followed by the Midwest (27%), the Northeast (19%), and the West (17%), and most immigrant adults lived in the West (35%), followed by the South (29%), the Northeast (25%), and the Midwest (12%). Asian adults were mostly concentrated on the West Coast, and the Hispanic population was mostly concentrated in the South or West. U.S.-born black adults were more likely to live in the South (59%), and foreign-born black adults were more likely to live in the Northeast (53%).
Length of time in United
States—Over two-thirds of immigrant
adults had been living in the United States for 10 years or more. Fourteen percent of immigrant black adults and Hispanic adults had been living in the United States for less than 5 years, followed by Asian (16%) and white (18%) adults.
Health
care
access
and
utilization
Table 2 presents age-adjusted data on the health care access and utilization of U.S.-born and foreign-born adults in the four major race/ethnicity groups.
Health insurance coverage—
Foreign-born adults were more likely to be uninsured than their native-born counterparts (26% compared with 11%). Among immigrants, Hispanic adults were the most likely to be without health insurance (37%), followed by black (22%), Asian (15%), and white adults (13%). Almost three-fourths of U.S.-born adults had private health insurance coverage compared with over one-half of the immigrant population. Among U.S.-born adults, Asian adults were most likely to have private health insurance coverage (85%), and black and Hispanic adults were the least likely to have private health insurance
coverage (56% and 57%, respectively).
Usual source of care and doctor visits—Foreign-born adults were more
likely to be without a usual source of care than their U.S.-born counterparts (24% compared with 12%). Among the
race-nativity groups, this difference is most noticeable among the Hispanic population. Compared with U.S.-born Hispanic adults, immigrant Hispanic adults were almost twice as likely to have no usual place of health care (16% compared with 31%), less likely to have spoken with a doctor or health care professional within the past year (68% compared with 79%), and three times as likely never to have talked to a doctor or health care professional in their life (6% compared with 2%). The overall frequency of visits to a doctor’s office in the past 12 months was higher among U.S.-born adults than their immigrant counterparts (82% compared with 71%).
Selected
health
indicators
Table 3 presents age-adjusted data on self-assessed health, limitations in IADL and ADL, annual bed disability days, and serious psychological distress.
Self-assessed health—Overall,
U.S.-born adults rated their health more positively (excellent or very good) than their immigrant counterparts (64% compared with 61%). However, this pattern does not hold among U.S.-born black adults. Immigrant black adults were more likely to rate their health positively (excellent or very good) than their U.S.-born counterparts (64% compared with 51%).
Limitations in ADL and
IADL—U.S.-born and immigrant adults
were equally likely to have limitations in their ADL and IADL activities. However, U.S.-born black adults were almost twice as likely to have
limitations in both ADL and IADL activities compared with their immigrant counterparts.
Annual bed days—U.S.-born adults
were more likely to have at least one bed disability day in the past 12 months than their immigrant counterparts (38% compared with 27%). On average, U.S.-born adults had 1.5 more days of bed disability than their immigrant counterparts. U.S.-born black and Hispanic adults had about twice the average number of bed-disability days compared with their immigrant counterparts (6.7 days and 2.7 days for black adults, respectively, and 5.7 days
and 3.4 days for Hispanic adults, respectively).
Serious psychological
distress—U.S.-born and immigrant
adults were equally likely to experience symptoms of serious psychological distress during the past 30 days (3%). However, U.S.-born black and Hispanic adults were more likely to experience symptoms of serious psychological distress than their immigrant
counterparts. Among U.S.-born adults, Hispanic adults were more likely to experience serious psychological distress (4.4%) than either black adults (3.3%) or white adults (2.7%). Among immigrants, Hispanic adults were more likely to experience serious
psychological distress (3.6%) than white (2.9%), black (1.9%), and Asian adults (1.7%).
Table 4 presents age-adjusted estimates for rates of selected chronic diseases and health behaviors including obesity, current smoking, diabetes, hypertension, and cardiovascular disease.
Selected risk factors and chronic diseases—U.S.-born adults were almost
50% more likely to be obese than their immigrant counterparts (23% compared with 16%). The prevalence of obesity was higher among U.S.-born black adults than any of the other race/ ethnicity groups regardless of nativity. One-third of U.S.-born black adults were obese compared with 19% of immigrant black adults. U.S.-born Asian adults were two times as likely to be obese than their immigrant counterparts (11% compared with 5%). The same pattern was observed for white and Hispanic adults (21% compared with 14% for white adults and 30% compared with 21% for Hispanic adults). The prevalence of smoking, hypertension, and cardiovascular diseases was also higher among U.S.-born adults than their immigrant counterparts. U.S.-born black adults were three times as likely to be current smokers as their immigrant counterparts (24% compared with 8%). Overall, the prevalence of hypertension was significantly higher among U.S.-born black adults than any other race/ ethnicity groups. One of every three U.S.-born black adults had hypertension.
6
Advance
Data
No.
369
+
March
1,
2006
Figure4.Percentofselectedriskfactors/chronicdiseasesamongforeign-bornHispanic adults,bylengthofstay:UnitedStates,1998–2003
Moreover, among the race/ethnicity groups, only U.S.-born black and Hispanic adults had higher prevalence of reported hypertension than their
immigrant counterparts. U.S.-born black adults were also twice as likely as immigrant black adults to have cardiovascular disease (8% compared with 4%).
Table 5 and Figure 4 present age-adjusted estimates for selected health characteristics of immigrants by length of stay in the United States.
Selected risk factors and chronic diseases by length of stay in the United States—The prevalence of selected risk
factors and chronic diseases for white, black, and Asian immigrant adults did not significantly differ by their length of stay in the United States. However, for Hispanic immigrant adults, significant differences were noted in obesity, hypertension, and cardiovascular disease by length of stay in the United States (Figure 4). Almost one-fourth of Hispanic immigrants living in the United States for 5 years or more were obese compared with 16% of more recent Hispanic immigrants (less than 5 years). Among Hispanic immigrant adults, the percentage of persons with
hypertension and cardiovascular disease significantly increased as length of stay in the U.S. increased. Hispanic
immigrant adults living in the United States 5 years or more were also more likely to have hypertension (20%) and cardiovascular diseases (5%) compared with their more recent immigrant counterparts (13% and 4%,
respectively). Among white immigrant adults, those living in the United States 5 years or more were more likely to rate their health positively (67%) compared with their more recent immigrant counterparts (59%). They were also less likely to report experiencing symptoms of serious psychological distress during the past 30 days than their more recent immigrant counterparts (3% compared with 9%). However, among black immigrant adults, more recent immigrants rated their health more positively than those who had been living in the United States for 5 years or more (75% compared with 63%).
Discussion
This report focused on selected physical and mental health
characteristics as well as access to care
among native-born and immigrant adults in four race/ethnicity groups. The association between immigrant health status and length of stay in the United States was examined. The descriptive analyses demonstrated that access to care for immigrant adults remains a major problem. Many immigrant adults have neither health insurance coverage nor a usual source of medical care. This is particularly noticeable among
Hispanic immigrant adults. Among all race/ethnicity groups in the analyses, Hispanic immigrants had the highest uninsurance rate. Additionally, Hispanic immigrant adults were significantly more likely to be without a usual source of care and to have not seen a doctor in the past year. However, in spite of having limited access to health care and being uninsured, Hispanic immigrant adults had significantly better health than their U.S.-born counterparts. They were much less likely to have bed disability days, were less likely to smoke or to be obese, were less likely to experience symptoms of serious psychological distress, and had lower prevalence of hypertension and cardiovascular disease compared with their native-born counterparts. These findings are consistent with other studies that have shown considerable health advantages for Hispanic immigrants despite adverse sociodemographic characteristics and access to care factors, often referred to as the ‘‘Hispanic paradox’’ (19).
Results also show that immigrant black adults enjoy substantially better health than their U.S.-born counterparts. Immigrant black adults rated their health more positively than did U.S.-born black adults, were much less likely to have limitations in ADL and IADL, and had fewer bed disability days. Immigrant black adults were also less likely to have symptoms of serious psychological distress than their native-born
counterparts. They were also less likely to be current smokers and to be obese. The prevalence of chronic diseases such as hypertension and cardiovascular diseases was also lower among immigrant black adults than their native-born counterparts. These findings are consistent with the results of
previous studies on immigrant black adults (8, 20,21).
Similar to immigrant black and Hispanic adults, immigrant Asian adults were also healthier than their U.S.-born counterparts. Asian immigrants not only had fewer bed days, but they were also less likely to be obese, to have a lower prevalence of hypertension, and to have fewer risk factors for chronic diseases than their U.S.-born counterparts. These results are consistent with the previous national data from the 1992–95 NHIS, which examined health outcomes for Asian immigrant adults (10,22).
Health disparities among U.S.-born and foreign-born white adults are not as large as those noted among the other race/ethnicity groups. Like all other race/ethnicity groups in this study, white immigrant adults were healthier than their U.S.-born counterparts. White immigrants had fewer bed days, were less likely to be obese or a current smoker, and had fewer health risk factors and chronic diseases than their U.S.-born counterparts.
These results also demonstrate that health status, health conditions, and health behaviors varied substantially across the immigrant subgroups by length of stay in the United States, which is a proxy measure of
acculturation. Although the prevalence of obesity remained essentially the same among white, black, and Asian
immigrant adults living in the United States less than 5 years compared with those living here 5 years or more, a consistent pattern of increased obesity was observed among Hispanic
immigrants as their length of residence in the United States increased. Hispanic immigrants living in the United States 5 years or more were more likely to be obese compared with Hispanic immigrants who had been living here less than 5 years. Similarly, Hispanic immigrants living in the United States 5 years or more had a higher prevalence of self-reported hypertension and cardiovascular disease than more recent Hispanic immigrants. However, white immigrant adults living in the United States 5 years or more were
significantly less likely to experience symptoms of serious psychological distress compared with white
immigrants living in the United States less than 5 years. Considering self-assessed health status, white immigrant adults living in the United States 5 years or more were much more likely to be in excellent or good health compared with white immigrants living in the United States less than 5 years. Among black immigrant adults, this trend was the opposite—black immigrants living in the United States 5 years or more were much less likely to be in excellent or very good health compared with more recent black immigrants. These results are consistent with studies that have shown that the role of acculturation in health outcomes for immigrants is complex and varies by the health measure being examined (23,24). They also suggest that the mechanism by which acculturation affects health outcomes may not be the same for all race/ethnicity groups.
Several factors may account for the positive health profile that immigrants have when compared with their native-born counterparts. Selectivity among immigrants may play an important role in the differences observed. Persons who immigrate tend to be in much better health than those who remain in their countries of origin, a well-known phenomenon referred to as the ‘‘healthy migrant’’ effect (25). These differences may also reflect nativity differences in behavioral, cultural, and lifestyle factors such as smoking, physical activity, dietary habits, and nutrition, which are known to have an effect on health outcomes (20,26,27). The comparatively negative health outcomes among U.S.-born black adults may be related to social factors such as race/ethnicity discrimination, lower educational attainment, lower income, and higher poverty compared to immigrant black adults (20,21).
Several limitations of this study should be noted. Sample size constraints limited the ability to explore some important differences such as the variation in selected health outcomes for immigrant and native-born groups by sex and race. Previous studies have shown that health characteristics vary substantially by sex. Although it has been well established in the literature that better health outcomes are
associated with higher socioeconomic status, there is no adjustment for socioeconomic status in this study. Another important limitation was the inability of respondents who spoke neither English nor Spanish to complete the interview. Although the survey instrument was translated into Spanish, no other language translations were made for NHIS. Non-English-speaking and non-Spanish-speaking white, black, and Asian immigrants may have had difficulty responding to questions posed in English or Spanish or may have relied on English-speaking or Spanish-speaking household members to assist in translating questions during the
interview. Previous studies have also shown that Asian and Hispanic
populations are extremely heterogeneous groups with distinct cultures and languages. Health outcomes vary significantly among Asian (e.g., Japanese, Chinese, Filipino, Asian Indian, Korean, Vietnamese) and Hispanic (e.g., Mexican, Cuban, Puerto Rican) subgroups (28,29). A recent study also highlighted differences in health outcomes among non-Hispanic black immigrants (30). However, limited sample sizes precluded looking at health outcomes separately for each of these population subgroups. Finally, this study was unable to assess the degree to which the concepts on the survey were culturally appropriate for immigrant respondents.
Conclusion
This analysis describes differences in various sociodemographic, physical, and mental health characteristics among four race/ethnicity groups of U.S.- and foreign-born adults. The results show important differences between
immigrant and native-born populations and underscore the importance of nativity as a factor in the examination of health differences among various race\ethnicity populations. They may also contribute to a better understanding of the contribution of nativity to understanding health disparities among race\ethnicity populations in the United States as the Nation moves toward the goal of eliminating disparities in health for all people.
8
Advance
Data
No.
369
+
March
1,
2006
References
1. Kaiser Commission on Medicaid and the Uninsured, Immigrants’ Health Care: Coverage and Access (Washington: Kaiser Family Foundation, August 2000). 2. Gibson CJ, Lennon E. Historical
census statistics on the foreign-born population of the United States: 1850–1990. Population Division Working Paper No. 29, U.S. Bureau of the Census, Washington. 20233– 8800.
3. Schmidley D. The foreign-born population in the United States: March 2002, U.S. Bureau of the Census, Current Population Reports, P20–539, U.S. Government Printing Office, Washington. 2003.
4. Camarota SA, McArdle N. Where immigrants live: An examination of State residency of the foreign-born by country of origin in 1990 and 2000, Washington: Center for Immigration Studies, September 2003 (http://www.cis.org/circle.html). 5. Singh GK, Miller BA. Health, life
expectancy, and mortality patterns among immigrant populations in the United States. Canadian J Public Health 95 (6):14–21. 2004. 6. Hendershot GE. Health of the
foreign-born population: United States, 1985–86. Adv Data Vital Health Stat. June 13, 156:1–6. 1988. 7. Thamer M, Richard C, Casebeer AW,
Ray NF. Health insurance coverage among foreign-born US residents: the impact of race, ethnicity, and length of residence. Am J Public Health. 87: 96–102. 1997.
8. Lucas JW, Barr-Anderson DJ, Kington RS. Health status, health insurance, and health care utilization patterns of immigrant black men. Am J Public Health. 93(10): 1740–47. 2003.
9. Stephen EH, Foote K, Hendershot GE, Schoenborn CA. Health of the foreign-born population: United States, 1989–90. Advance data from vital and health statistics: no 241. Hyattsville, MD: National Center for Health Statistics. 1994.
10. Frisbie WP, Cho Y, Hummer RA. Immigration and the health of Asian and Pacific Islander adults in the United States. Am J Epidemiology 153(4): 372–80. 2001.
11. LeClere FB, Jensen L, Biddlecom AE. Health care utilization, family context, and adaptation among
immigrants to the United States. J Health Soc Behavior 35(12): 370–384. 1994.
12. Ku L, Matani S. Left out:
Immigrants’ access to health care and insurance. Health Affairs 20(1): 247–56. 2001.
13. Office of Management and Budget. Revisions to the Standards for the Classification of Federal Data on Race and Ethnicity. Federal Register 1997; 62(210):58782–90.
14. Kessler RC, Andrews G, Colpe LJ, et al. Short screening scales to monitor population prevalences and trends in non-specific psychological distress. Psychological Medicine 32: 959–976. 2002.
15. Research Triangle Institute.
SUDAAN user’s manual, Release 9.0 Research Triangle Park, NC: Research Triangle Institute. 2002. 16. Lynch C, Parsons V. The impact of
2000 census-based population controls on health estimates in the National Health Interview Survey. 2004 Proceedings of the American Statistical Associations, Survey Research Methods Section [CD ROM], Alexandria, VA: American Statistical Association. 2004. 17. Day JC. Population projections of the
United States by age, sex, race, and Hispanic origin: 1995 to 2050, U.S. Bureau of the Census, Current Population Reports, P25–1130. Washington. U.S. Government Printing Office. 1996 (http:// www.census.gov/prod/1/pop/p25– 1130).
18. Klein RJ, Schoenborn CA. Age adjustment using the 2000 projected U.S. population. Healthy People Statistical Notes, no 20. Hyattsville, MD. National Center for Health Statistics. Jan. 2001.
19. Markides KS, Coreil J. The health of Hispanics in the southwestern United States: an epidemiologic paradox. Public Health Reports 101(3): 253–265. 1986.
20. Singh GK, Yu SM. Adverse pregnancy outcomes: differences between US- and foreign-born women in major US racial and ethnic groups. Am J Public Health. 86: 837–843. 1996.
21. King G, Polednak A, Bendel R, Hovey D. Cigarette smoking among native and foreign-born African Americans. Ann Epidemiol. 1999;9:236–244.
22. Singh GK, Siahpush M. All-cause and cause-specific mortality of immigrants and native-born in the United States. Am J Public Health. 91:392–99. 2001.
23. Lara M, Gamboa C, Kahramanian MI, et al. Acculturation and Latino health in the United States: a review of the literature and its sociopolitical context. Ann Rev Public Health 26:367–397. 2005.
24. Finch BK, Hummer RA, Reindl M, Vega WA. Validity of self-rated health among Latino(a)s. Am J Epidemiol 155(8): 755–759. 2002. 25. Thomas DB, Karagas MR. Migrant
studies. In: Schottenfeld D, Fraumen JF, eds, Cancer Epidemiology and Prevention. 2nd ed. Oxford, New York, NY: Oxford University Press. 1996:236–254.
26. Yu SM, Huang ZJ, Singh GK. Health Status and Health Services
Utilization Among US Chinese, Asian Indian, Filipino, and Other Asian/Pacific Islander Children. Pediatr. 113:101–7. 2004.
27. Guendelman S, Gould JB, Hudes M, Eskenazi B. Generational differences in perinatal health among the Mexican American population: findings from NHANES 1982–84. Am J Public Health. 80(suppl): 61–65. 1990.
28. Hajat A, Lucas JB, Kington RS. Health outcomes among Hispanic subgroups: Data from the National Health Interview Survey, 1992–95. Advance data from vital and health statistics: no 310. Hyattsville, MD: National Center for Health Statistics. 2000.
29. Kuo J, Porter K. Health status of Asian Americans: United States, 1992–94. Adv Data Vital Health Stat, No. 298, Hyattsville, MD: National Center for Health Statistics. 1998. 30. Read JG, Emerson MO, Tarlov M.
Implications of black immigrant health for U.S. racial disparities in health. J Immigrant Health 7(3): 205–12. 2005.
31. National Center for Health Statistics. 1998 National Health Interview Survey (NHIS). Public Use Data Release. NHIS Survey Description. ftp://ftp.cdc.gov/pub/
Health_Statistics/NCHS/
Dataset_Documentation/NHIS/1998/ srvydesc.pdf.
32. National Center for Health Statistics. 1999 National Health Interview Survey (NHIS). Public-Use Data
Release. NHIS Survey Description National Health Interview Survey, (ftp://ftp.cdc.gov/pub/ 1998. National Center for Health Health_Statistics/NCHS/ Statistics. Vital Health Stat 10(207). Dataset_Documentation/NHIS/1999/ 2002.
srvydesc.pdf). 42. Pleis J, Coles R.. Summary health 33. National Center for Health Statistics. statistics for U.S. adults: National
2000 National Health Interview Health Interview Survey, 1998. Survey (NHIS). Public-Use Data National Center for Health Statistics. Release. NHIS Survey Description Vital Health Stat 10(209). 2002. (ftp://ftp.cdc.gov/pub/
Health_Statistics/NCHS/
Dataset_Documentation/NHIS/2000/ srvydesc.pdf).
34. National Center for Health Statistics. 2001 National Health Interview Survey (NHIS). Public-Use Data Release. NHIS Survey Description (ftp://ftp.cdc.gov/pub/
Health_Statistics/NCHS/
Dataset_Documentation/NHIS/2001/ srvydesc.pdf).
35. National Center for Health Statistics. 2002 National Health Interview Survey (NHIS). Public-Use Data Release. NHIS Survey Description (ftp://ftp.cdc.gov/pub/
Health_Statistics/NCHS/
Dataset_Documentation/NHIS/2002/ srvydesc.pdf).
36. National Center for Health Statistics. 2003 National Health Interview Survey (NHIS). Public-Use Data Release. NHIS Survey Description (ftp://ftp.cdc.gov/pub/
Health_Statistics/NCHS/
Dataset_Documentation/NHIS/2003/ srvydesc.pdf).
37. Bloom B, Tonthat L. Summary health statistics for U.S. children: National Health Interview Survey, 1997. National Center for Health Statistics. Vital Health Stat 10(203). 2002.
38. Blackwell DL, Tonthat L. Summary health statistics for U.S. population: National Health Interview Survey, 1997. National Center for Health Statistics. Vital Health Stat 10(204). 2001.
39. Blackwell DL, Collins JG, Coles R. Summary health statistics for U.S. adults: National Health Interview Survey, 1997. National Center for Health Statistics. Vital Health Stat 10(205). 2002.
40. Blackwell DL, Tonthat L. Summary health statistics for U.S. children: National Health Interview Survey, 1998. National Center for Health Statistics. Vital Health Stat 10(208). 2002.
41. Blackwell DL, Tonthat L. Summary health statistics for U.S. population:
10
Table1.Frequenciesandage-adjustedpercentdistributions(withstandarderrors)ofselecteddemographiccharacteristics,bynativityandrace:UnitedStates,1998–2003U.S.-born adults1
Foreign-born adults2
Non-Hispanic Non-Hispanic
All All
Selected characteristic U.S.-born3 White Black Asian Hispanic foreign-born3 White Black Asian Hispanic
Number in thousands All persons. . . 177,441 143,118 20,531 1,072 9,636 25,628 5,957 1,983 5,379 12,017 Total. . . 100.0 100.0 100.0 100.0 100.0 100.0 100.0 100.0 100.0 100.0 Age4 18–34 years . . . 31.2 (0.25) 28.9 (0.27) 37.7 (0.54) 50.4 (2.90) 46.9 (0.71) 37.6 (0.49) 23.8 (0.82) 35.8 (1.54) 39.2 (1.04) 44.1 (0.67) 35–44 years . . . 21.6 (0.13) 21.5 (0.15) 23.0 (0.34) 14.3 (1.40) 20.7 (0.41) 24.3 (0.32) 20.7 (0.68) 28.0 (1.23) 23.9 (0.81) 25.4 (0.43) 45–64 years . . . 31.3 (0.18) 32.4 (0.21) 27.9 (0.44) 22.7 (1.74) 23.1 (0.46) 26.9 (0.39) 31.9 (0.81) 29.9 (1.36) 28.6 (0.91) 23.2 (0.50)
65 years and over . . . 16.0 (0.18) 17.2 (0.20) 11.5 (0.34) 12.6 (1.57) 9.3 (0.40) 11.1 (0.30) 23.6 (0.76) 6.3 (0.68) 8.2 (0.58) 7.2 (0.34)
Sex
Male . . . 47.7 (0.16) 48.2 (0.18) 43.8 (0.41) 52.8 (2.06) 47.2 (0.54) 49.0 (0.39) 47.2 (0.85) 47.3 (1.46) 48.5 (0.97) 50.3 (0.52)
Female . . . 52.3 (0.16) 51.8 (0.18) 56.2 (0.41) 47.2 (2.06) 52.8 (0.54) 51.0 (0.39) 52.8 (0.85) 52.7 (1.46) 51.5 (0.97) 49.7 (0.52)
Education
Less than high school diploma . . . 15.0 (0.20) 12.5 (0.22) 26.0 (0.52) 5.8 (1.04) 31.7 (0.61) 34.4 (0.56) 14.1 (0.67) 19.8 (1.18) 15.5 (0.83) 56.8 (0.70)
High school diploma or GED5
. . . 31.1 (0.22) 31.1 (0.25) 31.0 (0.42) 13.5 (1.38) 28.6 (0.47) 20.9 (0.36) 24.2 (0.83) 25.6 (1.24) 17.9 (0.82) 18.9 (0.45)
Some college - no degree . . . 29.9 (0.18) 30.0 (0.20) 28.5 (0.48) 34.3 (1.82) 27.5 (0.52) 19.1 (0.34) 24.4 (0.72) 31.8 (1.33) 19.9 (0.76) 13.4 (0.38)
Bachelor’s, Master’s, professional, and doctoral degrees . . . 23.2 (0.26) 25.5 (0.31) 13.2 (0.38) 45.0 (2.42) 11.1 (0.39) 23.5 (0.45) 35.4 (0.99) 20.7 (1.14) 44.8 (1.05) 8.8 (0.35)
Family income6 Less than $20,000 . . . 18.8 (0.22) 16.2 (0.23) 33.3 (0.60) 13.6 (1.43) 26.6 (0.61) 25.3 (0.45) 18.3 (0.76) 22.9 (1.28) 18.4 (0.93) 32.7 (0.68) $20,000 & more . . . 76.2 (0.24) 79.1 (0.26) 60.3 (0.63) 82.8 (1.54) 68.8 (0.62) 69.3 (0.47) 76.5 (0.83) 71.3 (1.44) 76.9 (0.99) 61.6 (0.68) $20,000–$34,999 . . . 25.2 (0.24) 23.5 (0.26) 35.8 (0.74) 13.3 (1.51) 32.3 (0.74) 31.2 (0.58) 23.2 (1.01) 28.3 (1.95) 19.6 (1.13) 42.1 (0.90) $35,000–$54,999 . . . 26.7 (0.21) 26.4 (0.23) 29.7 (0.59) 19.8 (1.92) 27.9 (0.67) 26.8 (0.50) 25.6 (0.98) 29.3 (2.19) 22.3 (1.10) 29.8 (0.77) $55,000–$74,999 . . . 18.5 (0.17) 18.8 (0.18) 16.6 (0.48) 18.9 (2.06) 17.1 (0.56) 15.8 (0.43) 16.6 (0.79) 17.1 (1.59) 17.7 (0.96) 14.3 (0.66) $75,000 & above . . . 29.6 (0.31) 31.3 (0.34) 17.9 (0.73) 48.1 (3.15) 22.8 (0.72) 26.2 (0.62) 34.6 (1.16) 25.3 (2.12) 40.4 (1.52) 13.8 (0.72) Poverty status7 Poor. . . 7.6 (0.16) 5.9 (0.16) 16.3 (0.43) 5.4 (0.83) 13.2 (0.46) 13.3 (0.34) 7.6 (0.64) 10.9 (0.89) 10.5 (0.69) 18.4 (0.55) Near poor . . . 12.5 (0.15) 11.3 (0.16) 18.1 (0.36) 7.9 (1.00) 17.9 (0.43) 18.6 (0.33) 11.7 (0.53) 16.6 (1.04) 13.1 (0.75) 25.3 (0.49) Not poor . . . 56.6 (0.30) 59.9 (0.32) 39.9 (0.62) 64.8 (2.08) 45.7 (0.67) 41.8 (0.49) 53.8 (1.02) 46.7 (1.53) 53.5 (1.09) 29.8 (0.59) Family size 1 . . . 19.4 (0.24) 19.2 (0.27) 23.6 (0.48) 20.6 (1.59) 15.3 (0.43) 14.0 (0.31) 19.1 (0.60) 19.1 (1.05) 12.8 (0.67) 10.7 (0.45) 2 . . . 34.4 (0.16) 35.8 (0.17) 27.7 (0.34) 29.3 (1.87) 26.9 (0.48) 24.0 (0.34) 31.7 (0.74) 24.1 (1.13) 23.8 (0.84) 19.1 (0.43) 3 . . . 18.3 (0.14) 18.2 (0.15) 19.4 (0.34) 16.2 (1.43) 20.0 (0.45) 17.7 (0.29) 18.1 (0.70) 17.1 (0.99) 20.2 (0.73) 17.4 (0.40) 4 . . . 16.6 (0.14) 16.8 (0.16) 15.4 (0.33) 18.3 (1.64) 18.0 (0.44) 19.6 (0.31) 18.4 (0.69) 18.7 (1.21) 20.5 (0.78) 20.2 (0.42) 5 or more . . . 11.2 (0.13) 10.1 (0.14) 14.0 (0.34) 15.6 (1.96) 19.8 (0.49) 24.7 (0.44) 12.7 (0.78) 21.0 (1.34) 22.7 (1.05) 32.6 (0.62) Marital status Married . . . 57.2 (0.24) 60.5 (0.25) 37.1 (0.46) 53.8 (2.15) 53.2 (0.59) 64.7 (0.39) 66.0 (0.75) 48.4 (1.54) 68.1 (0.85) 64.8 (0.54) Never married. . . 22.6 (0.18) 20.6 (0.20) 33.3 (0.35) 34.4 (1.61) 24.2 (0.40) 18.2 (0.26) 17.0 (0.63) 28.6 (1.09) 19.0 (0.62) 17.2 (0.33) Divorced or separated. . . 12.5 (0.11) 11.6 (0.12) 18.5 (0.29) 7.0 (1.03) 15.3 (0.38) 9.4 (0.20) 8.8 (0.40) 15.7 (0.88) 5.0 (0.35) 11.1 (0.31) Widowed . . . 7.3 (0.07) 6.9 (0.07) 10.3 (0.20) 4.5 (0.76) 6.8 (0.28) 7.3 (0.19) 8.0 (0.30) 5.9 (0.74) 7.5 (0.53) 6.5 (0.29)
See footnotes at end of table.
Advance
Data
No.
369
+
March
1,
2006
11
U.S.-born adults1
Foreign-born adults2
Non-Hispanic Non-Hispanic
All All
Selected characteristic U.S.-born3
White Black Asian Hispanic foreign-born3
White Black Asian Hispanic
Place of residence Number in thousands
MSA - central city8. . . . 26.1(0.58) 21.3(0.61) 50.4(1.42) 28.3(2.40) 47.1(1.38) 41.8(1.02) 36.1(1.54) 53.7(3.00) 41.3(1.68) 44.2(1.52)
MSA - not central city8 . . . . 50.8(0.68) 53.8(0.75) 33.7(1.28) 64.7(4.22) 42.2(1.24) 52.6(1.03) 58.5(1.53) 44.9(3.01) 55.2(1.68) 49.0(1.55)
Not MSA8 . . . 23.1(0.50) 24.9(0.56) 15.9(1.50) *7.0(4.70) 10.8(1.42) 5.5(0.59) 5.4(0.50) *1.4(0.42) 3.5(0.63) 6.8(1.17) Region Northeast . . . 18.7(0.30) 19.8(0.36) 13.8(0.58) 8.8(1.17) 16.9(0.78) 24.6(0.60) 34.6(1.18) 53.2(2.53) 22.5(1.20) 14.4(0.76) Midwest . . . 26.9(0.38) 29.5(0.43) 19.6(0.82) 8.2(1.32) 8.5(0.52) 11.9(0.55) 18.7(1.22) 7.0(1.02) 14.9(1.02) 7.1 (0.64) South.. . . 37.4(0.41) 34.6(0.47) 59.4(1.11) 9.8(1.16) 35.6(1.56) 28.8(0.69) 22.6(0.98) 34.9(2.50) 20.5(1.07) 36.3 (1.15) West . . . 17.0(0.29) 16.2(0.33) 7.1(0.35) 73.1(2.03) 39.0(1.52) 34.6(0.68) 24.1(1.00) 4.9(0.66) 42.0(1.44) 42.1 (1.07)
Length of time in United States9
Less than 5 years . . . -- -- -- -- -- 14.8(0.35) 17.9(0.83) 14.1(1.06) 15.7(0.74) 13.8(0.43)
5 years or more . . . -- -- -- -- -- 83.6(0.35) 81.1(0.83) 83.9(1.12) 83.1(0.76) 84.2(0.44)
5–10 years . . . -- -- -- -- -- 14.4(0.27) 14.2(0.61) 14.6(1.05) 16.4(0.72) 13.9(0.36)
10 years or more . . . -- -- -- -- -- 69.2(0.41) 66.9(0.89) 69.3(1.34) 66.7(0.95) 70.3(0.55)
*Estimatesprecededbyanasteriskhavearelativestandarderrorofgreaterthan30%andshouldbeusedwithcautionastheydonotmeetthestandardofreliabilityorprecision. -- Quantityzero
1U.S.-bornisdefinedashavingbeenborninoneofthe50States,theDistrictofColumbia,PuertoRico,oranyoftheotherU.S.territories(e.g.,AmericanSamoa,Guam,U.S.VirginIslands,andNorthernMarianas).Personsborninaforeigncountryto
parentswhowereU.S.citizenswerealsodefinedasU.S.-born.
2Foreign-bornpersonsaredefinedaspeoplelivingintheUnitedStateswhowerenotU.S.citizensatbirth.Allnaturalizedcitizens,legalpermanentresidents,illegalaliens,andpersonsonlong-termtemporaryvisas(suchasstudentsorguestworkers)also
fallinthiscategory.
3
Personsofotherracesandunknownraceandethnicity,unknowneducation,unknownfamilyincome,unknownpovertylevel,unknownemploymentstatus,andunknownmaritalstatusareincludedinthetotal,butnotshownseparately.
4
Estimatesforagegrouparenotageadjusted.
5
GEDisGeneralEducationalDevelopmenthighschoolequivalencydiploma.
6
Thecategories‘‘Lessthan$20,000’’and‘‘$20,000ormore’’includebothpersonsreportingdollaramountsandpersonsreportingonlythattheirincomeswerewithinoneofthesetwocategories.Theindentedcategoriesincludeonlythosepersonswho reporteddollaramounts.
7PovertystatusisbasedonfamilyincomeandfamilysizeusingtheU.S.CensusBureau’spovertythresholdsforthepreviouscalendaryear.‘‘Poor’’personsaredefinedasbelowthepovertythreshold.‘‘Nearpoor’’personshaveincomesof100%toless
than200%ofthepovertythreshold.‘‘Notpoor’’personshaveincomesthatare200%ofthepovertythresholdorgreater.
8MSAismetropolitanstatisticalarea.
9IncludesonlythosepersonswhowerenotbornintheUnitedStates.
NOTE:Estimatesareageadjustedtotheyear2000standardU.S.populationusingfouragegroups:18–34years,35–44years,45–64years,and65yearsand over. DATASOURCE:NationalHealthInterviewSurvey,1998–2003.Dataarebasedonhouseholdinterviewsofasampleoftheciviliannoninstitutionalizedpopulation.
Advance
Data
No.
369
+
March
1,
2006
12
Table2.Age-adjustedpercentdistributions(withstandarderrors)ofselectedaccesstocareandutilizationofhealthcareservicesmeasures,bynativityandrace:UnitedStates, 1998–2003U.S.-born adults1 Foreign-born adults2
Non-Hispanic Non-Hispanic
All All
Selected characteristic U.S.-born3
White Black Asian Hispanic foreign-born3
White Black Asian Hispanic
Total. . . 100.0 100.0 100.0 100.0 100.0 100.0 100.0 100.0 100.0 100.0
Health insurance coverage4
Private. . . 74.3(0.23) 78.2(0.24) 56.5(0.57) 85.2(1.46) 57.4(0.63) 53.4(0.51) 70.5(0.94) 56.7(1.44) 65.1(1.03) 37.3 (0.61)
Medicaidorotherpublic . . . 5.6(0.10) 4.0(0.10) 13.6(0.38) 3.6(0.88) 12.5(0.41) 8.9(0.29) 6.2(0.57) 7.9(0.77) 8.8(0.66) 12.5 (0.45)
Other. . . 6.9(0.10) 6.3(0.10) 11.3(0.24) 4.4(0.90) 10.5(0.34) 7.6(0.22) 7.7(0.34) 8.7(0.84) 8.5(0.61) 7.5(0.33)
Uninsured . . . 10.6(0.12) 9.4(0.14) 14.7(0.30) 6.0(0.84) 15.8(0.39) 25.7(0.40) 12.8(0.61) 22.5(1.18) 14.8(0.75) 36.8(0.55)
Usual place to go for medical care5 . . . . 87.7(0.13) 88.1(0.15) 87.1(0.30) 89.1(1.10) 83.6(0.42) 76.4(0.39) 84.9(0.63) 82.1(1.09) 81.7(0.75) 69.4(0.55)
Unmet medical needs6
Mental care or counseling . . . 1.9(0.04) 1.8(0.04) 1.9(0.10) *0.5(0.21) 2.2(0.16) 1.4(0.08) 1.3(0.18) 1.6(0.34) 0.6(0.13) 1.8(0.14)
Dentalcare . . . 9.1(0.12) 8.8(0.13) 10.5(0.29) 4.7(0.87) 11.2(0.41) 8.3(0.22) 8.3(0.54) 8.5(0.78) 5.8(0.45) 9.8(0.33)
Prescription medicine . . . 6.4(0.10) 5.9(0.10) 8.7(0.26) *2.1(0.69) 8.5(0.30) 5.4(0.17) 4.2(0.35) 6.8(0.61) 3.3(0.34) 7.0(0.28)
Time since last contact with doctor or health professional7
6monthsorless. . . 70.3(0.15) 70.8(0.16) 69.9(0.44) 69.1(1.80) 65.2(0.51) 59.3(0.40) 66.7(0.84) 66.8(1.22) 60.7(0.93) 54.0 (0.54)
6 months - 1 year . . . 14.0(0.11) 13.9(0.13) 14.5(0.31) 16.0(1.45) 14.2(0.37) 14.5(0.27) 14.0(0.58) 15.1(0.90) 15.1(0.66) 14.3(0.35)
1 year or more . . . 15.1(0.13) 14.7(0.14) 14.8(0.31) 14.5(1.37) 19.1(0.42) 22.5(0.33) 17.8(0.71) 16.0(1.07) 21.3(0.75) 26.0(0.46)
Never . . . 0.7(0.03) 0.6(0.04) 0.9(0.08) *0.5(0.24) 1.5(0.14) 3.8(0.18) 1.5(0.22) 2.2(0.43) 2.9(0.37) 5.6(0.29)
Number of doctor visits8
None. . . 17.6(0.14) 16.9(0.16) 19.0(0.39) 14.6(1.39) 23.5(0.48) 29.0(0.39) 21.6(0.77) 21.4(1.16) 26.0(0.81) 34.9 (0.53)
1–3visits. . . 43.1(0.17) 43.4(0.20) 42.5(0.39) 46.2(2.40) 40.4(0.56) 41.6(0.40) 44.8(0.83) 46.1(1.40) 45.7(0.96) 37.4 (0.53)
4–9visits. . . 24.4(0.14) 24.7(0.16) 24.5(0.37) 24.5(1.87) 21.6(0.43) 19.2(0.30) 21.8(0.62) 21.7(1.17) 19.2(0.80) 17.4 (0.41)
10visitsormore. . . 14.8(0.12) 15.0(0.14) 14.0(0.30) 14.7(1.79) 14.5(0.41) 10.2(0.24) 11.9(0.51) 10.9(0.93) 9.0(0.56) 10.3 (0.36)
*Estimatesprecededbyanasteriskhavearelativestandarderrorofgreaterthan30%andshouldbeusedwithcautionastheydonotmeetthestandardofreliabilityorprecision.
1U.S.-bornisdefinedashavingbeenborninoneofthe50States,theDistrictofColumbia,PuertoRico,oranyoftheotherU.S.territories(e.g.,AmericanSamoa,Guam,U.S.VirginIslands,andNorthernMarianas).Personsborninaforeigncountryto
parentswhowereU.S.citizenswerealsodefinedasU.S.-born.
2Foreign-bornpersonsaredefinedaspeoplelivingintheUnitedStateswhowerenotU.S.citizensatbirth.Allnaturalizedcitizens,legalpermanentresidents,illegalaliens,andpersonsonlong-termtemporaryvisas(suchasstudentsorguestworkers)also
fallinthiscategory.
3Personsofotherracesandunknownraceandethnicityareincludedinthetotal.
4Classificationofhealthinsurancecoverageisbasedonahierarchyofmutuallyexclusivecategories.Personswithmorethanonetypeofhealthinsurancewereassignedtothefirstappropriatecategoryinthehierarchy.Thecategory‘‘Uninsured’’includes
personswhohadnocoverageaswellasthosewhohadonlyIndianHealthServicecoverageorhadonlyaprivateplanthatpaidforonetypeofservicesuchasaccidentsordentalcare.
5
Usualplacetogoformedicalcareisbasedonaquestioninthesurveythatasked,‘‘Isthereaplacethatyouusuallygotowhenyouaresickorneedadviceaboutyourhealth?’’
6
Unmetmedicalneedsisbasedonaquestioninthesurveythatasked,‘‘Duringthepast12months,wasthereanytimewhenyouneededanyofthefollowing,butdidn’tgetitbecauseyoucouldn’taffordit?’’
7
Timesincelastcontactwithadoctororhealthprofessionalisbasedonaquestioninthesurveythataskedrespondents,‘‘Abouthowlonghasitbeensinceyousawortalkedtoadoctororotherhealthcareprofessionalaboutyourownhealth?’’These contactsmayincludeofficevisits,hospitalvisits,homevisits,andphonecalls(butnotcallsmadeforarrangingappoinments).
8Numberofdoctorvisitsisbasedonaquestioninthesurveythataskedrespondents,‘‘Duringthepast12months,howmanytimeshaveyouseenadoctororotherhealthcareprofessionalaboutyourownhealthatadoctor’soffice,aclinic,orsomeother
place?’’Respondentsareinstructedtoexcludeovernighthospitalizations,visitstohospitalemergencyrooms,homevisits,ortelephonecalls.
NOTE:Estimatesareageadjustedtotheyear2000standardU.S.populationusingfouragegroups:18–34years,35–44years,45–64years,and65yearsand over. DATASOURCE:NationalHealthInterviewSurvey,1998–2003.Dataarebasedonhouseholdinterviewsofasampleoftheciviliannoninstitutionalizedpopulation.
Advance
Data
No.
369
+
March
1,
2006
13
1998–2003U.S.-born adults1 Foreign-born adults2
Non-Hispanic Non-Hispanic
All All
Selected characteristic U.S.-born3
White Black Asian Hispanic foreign-born White Black Asian Hispanic
Total. . . 100.0 100.0 100.0 100.0 100.0 100.0 100.0 100.0 100.0 100.0
Self-assessed health4
Excellent or very good . . . 63.7(0.22) 66.2(0.24) 50.6(0.45) 68.9(2.09) 54.9(0.51) 60.5(0.41) 66.4(0.88) 64.4(1.14) 65.0(0.95) 54.3(0.57)
Good. . . 24.4(0.15) 23.3(0.16) 29.3(0.37) 21.6(1.50) 26.2(0.47) 27.1(0.35) 23.6(0.72) 23.4(1.24) 25.0(0.89) 29.8 (0.49)
Fair or poor . . . 11.8(0.14) 10.3(0.15) 20.0(0.38) 9.1(1.37) 18.8(0.43) 12.4(0.26) 9.9(0.49) 12.0(0.91) 10.0(0.62) 15.8(0.41)
Limitation in ADL5or IADL6
ADL. . . 1.7(0.04) 1.5(0.04) 3.0(0.14) *0.7(0.32) 2.4(0.19) 1.7(0.11) 1.9(0.21) 1.5(0.40) 1.6(0.28) 1.7(0.15)
IADL . . . 3.8(0.06) 3.5(0.06) 5.9(0.19) 2.9(0.73) 4.4(0.21) 3.0(0.13) 3.3(0.25) 3.0(0.53) 2.6(0.31) 3.0(0.20)
Annual bed days7
None. . . 62.0(0.19) 61.5(0.22) 64.4(0.44) 58.3(1.93) 63.3(0.54) 72.8(0.35) 67.9(0.78) 72.7(1.37) 71.4(0.87) 75.0 (0.47)
1–6 days . . . 28.6(0.17) 29.5(0.20) 24.3(0.36) 34.3(1.97) 26.1(0.46) 20.0(0.31) 24.3(0.73) 20.3(1.17) 21.2(0.76) 17.8(0.41)
7 days or more . . . 9.4(0.10) 9.0(0.10) 11.3(0.28) 7.3(1.45) 10.6(0.36) 7.2(0.20) 7.8(0.42) 7.0(0.80) 7.4(0.53) 7.2(0.27)
Average number of bed days . . . 4.9(0.08) 4.6(0.09) 6.7(0.31) 3.4(0.84) 5.7(0.33) 3.4(0.18) 4.1(0.39) 2.7(0.47) 3.4(0.49) 3.4(0.26)
Mental health
Serious psychological distress8. . . . 2.9(0.06) 2.7(0.07) 3.3(0.15) *1.4(0.45) 4.4(0.21) 2.9(0.13) 2.9(0.29) 1.9(0.31) 1.7(0.26) 3.6(0.20)
*Estimatesprecededbyanasteriskhavearelativestandarderrorofgreaterthan30%andshouldbeusedwithcautionastheydonotmeetthestandardofreliabilityorprecision.
1U.S.-bornisdefinedashavingbeenborninoneofthe50States,theDistrictofColumbia,PuertoRico,oranyoftheotherU.S.territories(e.g.,AmericanSamoa,Guam,U.S.VirginIslands,andNorthernMarianas).Personsborninaforeigncountryto
parentswhowereU.S.citizenswerealsodefinedasU.S.-born.
2Foreign-bornpersonsaredefinedaspeoplelivingintheUnitedStateswhowerenotU.S.citizensatbirth.Allnaturalizedcitizens,legalpermanentresidents,illegalaliens,andpersonsonlong-termtemporaryvisas(suchasstudentsorguestworkers)also
fallinthiscategory.
3
Personsofotherracesandunknownraceandethnicityareincludedinthetotal.
4
Self-assessedhealthisbasedonaquestioninthesurveythataskedrespondents,‘‘Wouldyousay[subject’sname]healthingeneralwasexcellent,verygood,good,fair,orpoor?’’Thisinformationwasobtainedduringapartoftheinterviewthatallowed
proxyresponses,suchthataknowledgeableadultfamilymembercouldrespondonbehalfofadultsnottakingpartintheinterview(however,thesampleisbasedonthereportedhealthstatusforthesampleadultonly).‘‘Excellent’’and‘‘verygood’’are
combined,asare‘‘fair’’and‘‘poor.’’
5
ADLisacitivitiesofdailyliving.LimitationinADLisbasedonthequestion,‘‘Becauseofaphysical,mental,oremotionalproblem,does[person]needthehelpofotherpersonswithPERSONALCARENEEDS,suchaseating,bathing,dressing,orgetting
aroundinsidethehouse?’’
6IADLisinstrumentalacitivitiesofdailyliving.LimitationinIADLisbasedonthequestion,‘‘Becauseofaphysical,mental,oremotionalproblem,does[person]needthehelpofotherpersonswithROUTINENEEDS,suchaseverydayhouseholdchores,
doingnecssarybusiness,shopping,orgettingaroundforotherpurposes?’’
7Respondentswereasked,‘‘Duringthepast12months,thatis,since[12monthreferencedate]abouthowmanydaysdidillnessorinjurykeepyouinbedmorethanhalfoftheday(Includedayswhileanovernightpatientinahospital)?’’
8SixpsychologicaldistressquestionsareincludedintheSampleAdultCorecomponent.Thesequestionsaskhowoftenarespondentexperiencedcertainsymptomsofpsychologicaldistressduringthepast30days.Theresponsecodes(0–4)ofthesix
itemsforeachpersonaresummedtoyieldascalewitha0–24range.Avalueof13ormoreforthisscaleisusedheretodefineseriouspychologicaldistress. NOTE:Estimatesareageadjustedtotheyear2000standardU.S.populationusingfouragegroups:18–34years,35–44years,45–64years,and65yearsand over.