Paper ID #11791
Identifying Factors Impacting First Year Persistence in Computer Graphics
Technology
Mr. Eric Scott McCrae, Indiana University Purdue University Indianapolis
Eric McCrae is a senior graphic designer and web developer at Blue Octopus Printing Company, a large printing and mailing facility in Indianapolis, Indiana. He has over 17 years experience in the printing and mailing industry specializing in graphic design for print and mail marketing. Eric is the father of 1 and husband to Mia the love of his life.
Dr. Eugenia Fernandez, Indiana University Purdue University Indianapolis
Eugenia Fernandez is an Associate Professor of Computer and Information Technology and Chair of the Department of Computer Information and Graphics Technology in the Purdue School of Engineering and Technology at Indiana University Purdue University Indianapolis. She is a Fellow of the Mack Center at Indiana University for Inquiry on Teaching and Learning and an Editor of the Journal of Scholarship of Teaching and Learning. Her research focuses on the scholarship of teaching and learning related to learning with technology.
c
American Society for Engineering Education, 2015
P
Identifying Factors Impacting First Year Persistence
in Computer Graphics Technology
Abstract
The retention of students is a goal that all universities strive to achieve. With more and more emphasis placed on degree completion, retaining students becomes even more important. University faculty and staff continually try to identify what possible factors affect a student’s decision to remain in their chosen field of study. Faculty in the Computer Graphics Technology (CGT) program are concerned with what factors, if any, affect the persistence of students in the CGT program. The goal of this study was to determine if personal factors such as gender and being a first-generation student and/or academic factors such as admission status, semester course load, and academic grades are related to the first-year persistence of CGT students. Results indicate that first semester performance is a significant indicator of persistence. Gender, first generation student, and admission status were not found to be significant indicators. This points out the importance of efforts focused on students in their first semester of college.
Introduction
The retention of students is a goal that all universities strive to achieve. With President Obama’s call for the U.S. to top all countries in college completion1, more and more emphasis has been placed on degree completion and retaining students has become even more important. It has been estimated that nearly 40% of all college students leave institutions without acquiring a degree, and 75% of those students leave college within the first two years2. Freshman student attrition rates are found to be typically greater than other academic years and be can be between 20-30%2. Graduation and retention rates are continually calculated to meet the requirements of the 1990 Student Right to Know Act. This act requires institutions to report, within 150 percent of normal graduation time, the percentage of students that complete their programs, which for a bachelor degree would be six years3. The National Center for Education Statistics (NCES)
reported that at a public four year degree-granting institution in 2011, the retention rate for first-time, full-time students that returned the following fall 2012 was 79 percent, and as low as 61 percent for lower selective institutions3. This means that anywhere from 21 to 39 percent of all first-time, full-time freshman students attending public universities did not return for their third semester.
Many universities are concerned with the rates of student departure and how they can negatively affect the stability of their institutional enrollment, their university budgets, and the public
P
perception of the quality of students that their university can produce4. Some collegiate institutions also receive state funding based on criteria such as the total amount of full-time students who are enrolled at the beginning of each semester5. Indiana, along with 24 other states, uses formulas that allocate state funding based on indicators such as course completion, time to degree, transfer rates, the number of degrees awarded, and other factors.
With that being said, universities are heavily invested in finding ways that help contribute to the retention levels of their students5. At the program level, faculty and staff can try to identify and measure possible factors that affect a student’s decision to remain in their chosen field of study. The faculty in the Computer Graphics Technology (CGT) program in the Purdue School of Engineering & Technology at Indiana University Purdue University Indianapolis (IUPUI) is concerned with what factors, if any, affect the persistence of students in the CGT program. The goal of this study is to determine if personal factors, such as gender and being a first-generation student, and/or academic factors, such admission status, semester course load, and academic grades, are related to the first-year persistence of CGT students. Utilizing academic records of students declaring CGT as their major course of study in the fall semesters of 2012 and 2013, the study investigates if there is a connection between these factors and student retention. Students were divided into two groups based on whether they were enrolled in the CGT program in the third semester after beginning the program. Comparing the data points between the two groups in this study were used to identify descriptors that affect student retention.
In college, the most crucial timeframe for persistence is in the first year6,7,8,9. Some students make decisions in regards to departure early in their first year of studies. These decisions are sometimes made just 4-6 weeks into the fall semester10. First year students can face critical and sometimes overwhelming challenges trying to connect and integrate themselves into a university setting. Failure to do so can result in voluntary early departure for first year students11. As a result of this, college integration is often regarded as a fundamental variable in the retention levels of students and their academic progress12.
Student engagement is one way to help increase persistence. Pascarella and Terenzini8,9 have
shown that students who engage with faculty and with other students in purposeful educational activities persist at higher rates than other students. Engagement with peers, especially those from diverse ethnic, social, and philosophical backgrounds, has also been connected to increased problem-solving skills, better understanding of others, and critical thinking skills13. Increasing students’ level of preparedness is another way to influence persistence. Martindale2 states that
students who are well prepared for university coursework have shown to be more likely to stay in school.
In response to these findings, many universities offer various programs and services that
contribute to the integration of first-year students into the structure of a college community2. For
P
example, IUPUI offers freshman and transfer student orientations14 and first-year courses specifically designed to help teach students about proper study habits, encourage and emphasize attendance in their enrolled courses, and to better prepare them academically and emotionally for college. The focus of these courses is to assist with the skills and practical knowledge needed to help those who are unprepared for the challenges and rigors that college can present.
Women statistically are more likely to attend universities, persist more often, and obtain higher grades and graduation levels than men8,9. These statistics are quite the opposite when examining women enrolled in the field of science, technology, engineering, and mathematics (STEM). Historically, the number of women in computing fields has never been high. Studies conducted in 2008 show that only 18 percent of all computing degree recipients were female15. Ragsdale16 listed 21 different computer-related degrees that were conferred, separated by gender, for academic year 2007-2008. On that list, Ragsdale reported that of 1342 degrees awarded for computer graphics technology, just 21% were awarded to women. Not only are there fewer women in computing fields, Cohoon and Aspray17 found that females quit computer-related
programs at much higher rates than males.
First-generation students are those students from families where neither parent has pursued a post-secondary education degree. Many studies11,18,19 have shown that first-generation students are less likely to pursue continued education in comparison to peers whose parents had earned a degree, are more likely to enroll into community colleges, and are less likely to return their second year of studies compared to other students. High school students of parents that did not attempt post-secondary education took less science and math classes than students whose parents did attend at least some college18. First-generation students, according to Hicks20, also have different expectations in regards to college education that can affect their abilities for personal achievement and the likelihood of graduation. Despite these hardships, first-generation students that take advantage of certain opportunities, such as spending time with faculty and working with peers on academic projects, do show greater levels of academic success, and are more likely to persist than students who do not engage in similar opportunities3.
As discussed above, many factors play a role in the retention levels of students. Persistence is affected by many different areas such as social and academic integration, academic performance, student background characteristics, school experiences, and the satisfaction or dissatisfaction with the school they are attending. This study will investigate if first year retention in the CGT program differs based on curriculum-related factors, such as GPA and attempted and completed credit hours, student preparation, and student characteristics such as first-generation status and gender.
Study results will help faculty and staff to understand some of the factors that affect CGT first- year students, and to aid in formulating useful interventions to help increase retention levels.
P
Results could also aid other university departments in their efforts to increase the retention levels in their academic programs.
Method
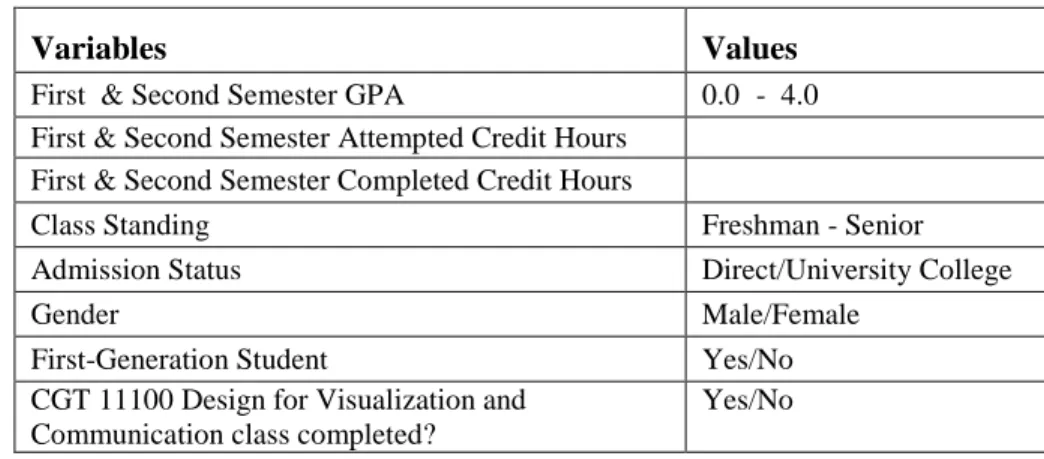
The participants for this study were students from IUPUI who declared CGT as their major of study. Students who initially enrolled in the CGT program in the fall 2012 and fall 2013 academic semesters were selected for this study. All data presented in this study was gathered from existing academic data with no direct student involvement. The specific data points collected are listed in Table 1.
Table 1. Data Collected
Variables Values
First & Second Semester GPA 0.0 - 4.0
First & Second Semester Attempted Credit Hours First & Second Semester Completed Credit Hours
Class Standing Freshman - Senior
Admission Status Direct/University College
Gender Male/Female
First-Generation Student Yes/No
CGT 11100 Design for Visualization and Communication class completed?
Yes/No
GPA is defined as the cumulative GPA at each semester of this study which includes all courses that each student has taken that semester. For a semester where a student was not enrolled in classes, no value will be given for that data.
The attempted credit hours include the total number of credit hours that each student enrolled in during each of the tested semesters. It does not include any credit hours for classes from which a student had withdrawn. Dropped classes will not be included in this study. The completed credit hours is the number of credit hours that each student completed during each of the semesters covered in this study. Each student will be given credit for class completion if they received a grade of a D- or better for the class.
Class standings are decided by total number of credit hours completed, including transfer credits, and are defined in Table 222. Students who have more than 25 credit hours in their first semester are treated as transfer students.
Table 2. Credit Hour Ranges for Class Standings
Class Standing Credit Hour Range
Freshman 0 - 25 Credit Hours
P
Sophomore 26 – 55 Credit Hours
Junior 56 – 85 Credit Hours
Senior > 85 Credit Hours
Admission status differentiates between students in University College and students accepted directly into the CGT program. Students are placed in University College if they have not decided on a major, or do not meet all requirements for admission into the CGT program and are working towards acquiring admission into the program. Once all prerequisites are met,
University College students are granted admission into the CGT program21. Only students who declared CGT as a major are included in this study. Admission status is being used as a
surrogate for college preparedness as students that directly admitted into the CGT program are considered to be more prepared for the requirements of that field of study.
An initial course required for the CGT program is CGT 11100 Design for Visualization and Communication. Data collected will show if students have completed this course by the end of their first semester. Completion in this study includes credits earned by completing the course or by testing out of the course based on course proficiencies. All CGT courses must be passed with a grade of “C-” or better, so only students that have acquired a grade of “C-” or better are
accounted for in this study. This course is also used as a surrogate for program preparedness.
Subjects in this study will be separated into two groups. The groups will be based on whether students were enrolled in the CGT program in their third semester, and this serves as our dependent variable. The independent variables described above will be used to test for
differences between the groups to help identify factors related to the decision a student makes to either remain in the CGT program for their second year of study, or not remain in the CGT program.
Results
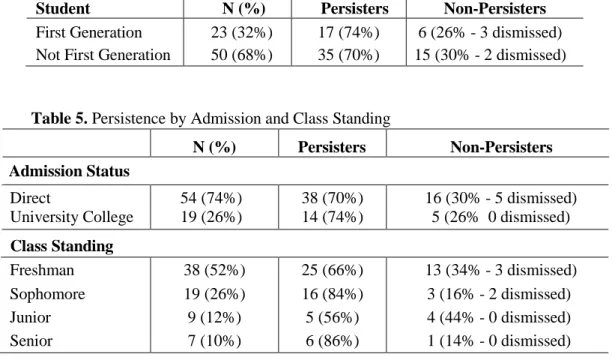
The sample consisted of 73 students containing 53 men and 20 women (see Table 3). Overall, the persistence rate was 71%. This includes the five students who were dismissed from the program at the end of the second semester for academic reasons. 23 of the 73 participants were first generation students (see Table 4). 54 students were admitted directly into the CGT
program, and 19 students were admitted through University College (see Table 4). A summary by admission and class standing is provided in Table 5.
Table 3. Student Persistence by Gender
Gender N (%) Persisters Non-Persisters
Male 53 (73%) 40 (75%) 13 (25% - 4 dismissed)
Female 20 (27%) 12 (60%) 8 (40% - 1 dismissed)
Total 73 52 (71%) 21 (29%)
P
Table 4. Persistence by First Generation Students
Student N (%) Persisters Non-Persisters
First Generation 23 (32%) 17 (74%) 6 (26% - 3 dismissed) Not First Generation 50 (68%) 35 (70%) 15 (30% - 2 dismissed)
Table 5. Persistence by Admission and Class Standing
N (%) Persisters Non-Persisters Admission Status Direct University College 54 (74%) 19 (26%) 38 (70%) 14 (74%) 16 (30% - 5 dismissed) 5 (26% 0 dismissed) Class Standing Freshman 38 (52%) 25 (66%) 13 (34% - 3 dismissed) Sophomore 19 (26%) 16 (84%) 3 (16% - 2 dismissed) Junior 9 (12%) 5 (56%) 4 (44% - 0 dismissed) Senior 7 (10%) 6 (86%) 1 (14% - 0 dismissed)
Independent sample t-tests were used to compare the mean values of attempted and completed credit hours, and the GPA of the participants who persisted to the mean values of those students who did not persist. Results are given in Table 6. The effect size, calculated using square point-biserial correlation (rpb2), is reported for significant results.
Table 6. Independent Samples t Test Results for Attempted and Completed Semester Credit Hours
& GPA
Variable
Independent Samples t Test Effect Size (rpb2)
t df Sig.
First Semester GPA 4.88 26.8 .000 .33
First Semester Completed Credit Hrs. 2.84 70.0 .006 .10
Second Semester Completed Credit Hrs. 2.39 13.4 .032 .13
Second Semester GPA 2.23 13.0 .044 .30
First Semester Attempted Credit Hrs. 1.13 71.0 .262 Second Semester Attempted Credit Hrs. 1.49 63.0 .142
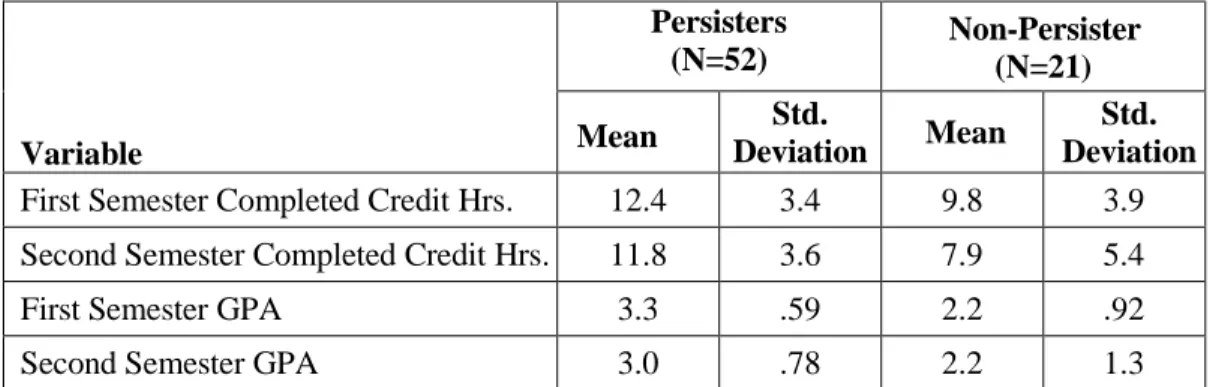
A means comparison for significant variables is provided in Table 7. The means of first and second semester completed credit hours, and first and second semester GPAs are significantly higher for persisters than non-persisters.
P
Table 7. Completed Credit Hours and GPA of Persisters and Non-Persisters
Variable
Persisters
(N=52) Non-Persister (N=21)
Mean DeviationStd. Mean Std. Deviation
First Semester Completed Credit Hrs. 12.4 3.4 9.8 3.9
Second Semester Completed Credit Hrs. 11.8 3.6 7.9 5.4
First Semester GPA 3.3 .59 2.2 .92
Second Semester GPA 3.0 .78 2.2 1.3
The significant difference in completed credit hours could be influenced by the mix of full and part-time students. To investigate this further, a Chi-square test of independence was computed to examine the relationship between full and part-time status and persistence. Full time students were defined as those with 12 or more attempted credit hours. Students with attempted credit hours less than 12 were considered part-time. No significant interaction was found for either first (Χ2(1, 72) = 1.254, p > .05) or second (Χ2(1, 64) = .019, p > .05) semester course load.
A Chi-square test of independence was used to compare persistence and non-persistence with class standing, admission type, first generational status and gender. Results are shown in Table 8. No significant interactions were found.
Table 8. Chi-Square Test of Independence Results
Variable Pearson Chi-Square Χ2 df Sig. Completed CGT 11100 1.36 1 0.244 First Generation 0.12 1 0.732 Direct/UCOL Admission 0.08 1 0.784 Class Standing 3.91 3 0.272 Gender 1.70 1 0.193 Discussion
The purpose of this study was to determine if specific personal and/or academic factors were related with persistence of CGT students to their second year of studies. The overall retention rate for CGT was 71%, slightly lower than the 77% reported for the school’s 2013-2104 academic year23. Both are lower still than the NCES3 reported rate of 79% but consistent with the 20-30% drop-out rate cited by Martindale2.
Not surprisingly, completed credit hours was found to be a significant indicator of retention. Students who complete more hours are more likely to persist to their second year, as they are
P
making satisfactory academic progress. Students who did not persist completed an average of 9 credit hours in their first semester and only 4.5 credit hours their second semester, putting them an entire semester behind those who complete a standard 15 hours per semester. A reason for this may be that students who enrolled in fewer courses may have life factors such as families and full-time jobs that may affect their decision or ability to continue their schooling.
Not only were persisters completing more courses, they are doing significantly better in them. Persisters’ GPAs were, on average, 1 point higher in their first semester and 0.8 points higher in their second semester than those who did not persist.
No other significant indicators were found. Academic factors (admission type, class standing, and course load) along with personal factors of gender, and first-generation students did not significantly differ between persisters and non-persisters. The finding about gender contradicts earlier research on female persistence in technology programs by Ragsdale16. This may be attributed to the relatively large number of women in the sample (27%) which is higher than usual for technology programs. Another reason for this could be that women who are admitted into a non-traditional field of study such as with technology may have stronger commitments for personal success which would result in higher retention rates.
Conclusion
The finding that academic factors had the most connection to the retention of first year students in CGT programs points to the increased importance that is placed on the first year experience24. As Hicks20 points outs, institutions should attempt to recognize students that are at risk of
premature departure and consider implementing programs to help aid them in college integration. Many universities have instituted broad initiatives, such as learning communities, to do so. But what can be done at the program level or even course level to identify at-risk students?
Given that successful completion of first semester courses was the only signficant indicator of persistence, looking for ways to increase course completion rates would be beneficial. To do so, we need to be able to identify students who are at-risk of failing. Wolfe25 demonstrated that it was possible to predict the final score of a student by examining the first five homework grades. Dr. John Kreme26 in IUPUI’s Psychology Department has studied how to predict student
performance based on early homework and attendance scores for an introductory Psychology course. Dr. Kremer found that he could predict the test performance of a student within four weeks of starting his courses by analyzing their average homework score and attendance rate during that time period. He then created an intervention for students with poor performance during that time period.
Similarly, Lizzioa and Wilson27 identified students who did poorly on their first assessment item
and invited them to participate in a two-stage intervention: independently completing a reflective
P
workbook designed to help them understand the reasons for their performance, followed by a structured consultation with their tutor to identify improvement goals and strategies. Students who completed the intervention improved their scores for the second assessment item and for the course overall more than a comparative group of students who did not participate.
It would not be too difficult to implement a similar intervention at IUPUI. Currently, all faculty teaching undergraduate classes are asked to provide early feedback on student attendance and performance in their classes via an Early Warning Roster. This can be used to identify students at risk of completion. At the least, course instructors could then encourage them to take
advantage of university tutoring programs and other learning resources. Or, following Kramer’s and Lizzioa and Wilson’smodels, an intervention could be created and students invited by their advisor or instructor to participate. A similar intervention already exists in the School of Engineering and Technology for students placed on academic probation, and it could either be used or serve as the model for a new intervention. This would be one avenue for continued research.
Of course, another thing that can be done at the program level is to ensure that quality instruction and course content are practiced during the first year of college. Some suggestions that are easy to implement are:
• Instructors should be encouraged to supply feedback early and often to students throughout the academic semester to let students know where they stand.28 • Student-faculty interactions should be particularly encouraged during the freshman
year to make them feel welcome and help aid them in college integration.29
• Instructors can help students develop a peer group support system through peer-to-peer interaction in the classroom.29,30
A limitation of this study was conducting research with a small sample size. This could show slight inaccuracies with the results in comparison to findings from similar studies. Another consideration would be that no students were directly involved in the research. As a result of this, there is no real way to deduce if the levels of student persistence are related to variables researched in this study, or are more influenced by other factors such as personal, financial, or family considerations. Also not determined, would be if students that did not persist would return to continue their education at a later date.
The study of student retention in CGT programs could benefit from continued research gathered over the span of multiple years. This may help to determine if non-persisters continue over longer periods of time. Also, formulating methods to survey student participants that did not
persist could help to determine each student’s desires and purpose for leaving. P
References
1. Field, K. (2009, May 1). In interview, education secretary cites need for improvement in college completion and cost control. The Chronicle of Higher Education. Retrieved from http://chronicle.com/article/In-Interview-Education/47227/
2. Martindale, G. (2010, February 3). College drop-out rates - Who's to blame. Retrieved from http://www.stateuniversity.com/blog/permalink/College-Drop-Out-Rates-Who-s-to-Blame-.html 3 Rodriguez, S. (2003). What helps some first-generation students succeed. About Campus 8(4), 17-22. 4. Braxton, J. M., Hirschy, A. S., & McClendon, S. A. (2004). Understanding and reducing college student
departure. San Francisco, CA: Jossey-Bass.
5. National Conference of State Legislatures. (2015, January 1). Performance-Based Funding for Higher Education. Retrieved from http://www.ncsl.org/research/education/performancefunding.aspx
6. Astin, A. W. (1977). Four critical years. San Francisco: Jossey-Bass.
7. Levitz, R., & Noel, L. (1989). Connecting students to institutions: Keys to retention success. In M. L. Upcraft and J. N. Gardner (Eds.) The Freshman Year Experience. San Francisco: Jossey Bass.
8. Pascarella, E. T., & Terenzini, P. T. (1991). How college affects students: Findings and research from twenty years of research. San Francisco: Jossey-Bass.
9. Pascarella, E. T., & Terenzini, P. T. (2005). How college affects students: A third decade of research. San Francisco: Jossey-Bass.
10. Hoyt, J. E., & Winn, B. A. (2004). Understanding retention and college student bodies: Differences between drop-outs, stop-outs, opt-outs, and transfer-outs. NASPA Journal, 41, 395-417.
11. Tinto, V. (1975). Dropout from higher education: A theoretical synthesis of recent research. Review of Educational Research, 45, 89-125.
12. Schwitzer, A. M., Griffin, O. T., Ancis, J. R., & Thomas, C. R. (1999). Social adjustment experiences of African American college students. Journal of Counseling and Development, 77, 189-197.
13. Kuh, G. D. (2001). Assessing what really matters to student learning: Inside the national survey of student engagement. Change, 33(3), 10-17, 66.
14. Orientation Programs. (n.d.). University College: Orientation Programs. Retrieved from http://orientation.uc.iupui.edu/OrientationPrograms.aspx
15 Snyder, T.D. & Willow, S.A. (2010). Digest of Education Statistics 2010. Washington, DC: Government Printing Office.
16. Ragsdale, S. (2013). Pursuing and Completing an Undergraduate Computing Degree from a Female Perspective: A Quantitative and Qualitative Analysis (Doctoral dissertation). Available from ProQuest database. (AAT 3565811)
17. Cohoon, J. M., & Aspray, W. (2006). Women and information technology: Research on underrepresentation. Cambridge, MA: The MIT Press.
18. Horn, L., & Nunez, A. (2000). Mapping the road to college: First-generation students' math track, planning strategies, and context of support. USDepartment of Education. National Center for Educational Statistics report2000-153.
19. McMahon, W. (1999). Education and development: Measuring the social benefits. Oxford: Oxford University Press.
20. Hicks, T. (2003). First-generation and non-first-generation precollege students' expectations and perceptions about attending college. The Journal of College Orientation and Transition, 11, 5-17.
21. IUPUI Campus Bulletin - University College. (2012-2014). Academic policies and procedures: Certification to a degree-granting school. Retrieved from http://www.iupui.edu/~bulletin/iupui/2012-2014/schools/univ-college/policies/certification.shtml
22. Class Standing. (2014, December). Office of the registrar. Retrieved from http://registrar.iupui.edu/ clstand.html
P
23. Information Management & Institutional Research (n.d.). One Year Retention Rates. Retrieved from http://reports.iupui.edu/render.aspx/PERSISTENCE%20RATES/ONEYRRETN/IUPUI
24. Tinto, V. (n.d.) Taking student retention seriously: Rethinking the first year of college. Retrieved from http://nhcuc.org/pdfs/Taking_Student_Retention_Seriously.pdf
25. Wolfe, M. L. (1981). Forecasting summative evaluation from formative evaluation: A double cross-validation study. Psychological Reports, 843-848.
26. Kremer, J. F. (2010, February). Promoting first-year student success: Using assessment and collaboration to improve student retention through early identification & intervention. Presentation at the Gateway to Graduation Retreat, IUPUI.
27. Lizzioa, A. & Wilson, K. (2013). Early intervention to support the academic recovery of first-year students at risk of non-continuation. Innovations in Education and Teaching International, 50(2), 109–120. doi:
10.1080/14703297.2012.760867
28. Nair, C. S., Patil, A., & Mertova, P. (2011). Enhancing the quality of engineering education by utilising student feedback. European Journal of Engineering Education,36(1), 3-12.
doi:10.1080/03043797.2010.518231
29. Biggers, M., Brauer, A., & Yilmaz, T. (2008). Student perceptions of computer science: A retention study comparing graduating seniors with CS leavers. ACM SIGCSE Bulletin, 40(1), 402-406 doi:
10.1145/1352322.1352274
30. Roberts, M. R. H., McGill, T., & Koppi, T. (2011). What students are telling us about why they left their ICT course. ITALICS: Innovations in Teaching & Learning in Information & Computer Sciences, 10(3), 1-15.
P