Tuition Fees and Student Mobility
Jiexi Yang & Yiran Wang
Department of economics
Professor Joakim Gullstrand
Table of Contents
Abstract...1
Keywords... 1
Introduction...1
Background...2
Explaining the mobility of student... 7
Pull-push framework... 7
Human capital and Migration theory... 9
Gravity model... 10
Data... 13
Description of the dependent variable...13
Description of the independent variable... 18
Empirical specification of the gravity equation and findings...20
Conclusions...24
References...27
Abstract
The upsurge in the popularity of studying abroad continues across the globe. By adopting the context of human capital migration theory, our paper aims to examine how tuition fees influences international student mobility. We focus on the international student inflow in five Nordic countries and Germany from 26 non EU/EAA and 31 EU/EEA countries, covering 3206 observations in total. During the period between 2003-2012 we employed a modified gravity model to empirically test the relationship between tuition fees and student inflow. The results reveal that, compared to providing free higher education, charging tuition fees has negative effects on student inflow.
Keywords
:tuition fees; student mobility; gravity modelIntroduction
Human capital is one of the most valuable national resources, but especially high level intellectual and skilled labor, in whom governments usually invest large amounts of monetary and labor input. When this labor migrates, based on the human capital migration theory, to pursue higher benefits, it gives rise to “brain-drain”. We can easily connect this phenomenon with the increasing trend of student mobility seeking higher education. When certain countries have more students seeking international education opportunities, “brain-drain” becomes a serious risk, even though students may choose to return. Other countries have more inflow in the same regard, not only do they receive what might be consider “brain-gain”, but also benefit economically from students’ financial expenditure. Important as this issue is, many economists participate in research of this topic.
As non-EU/EEA students ourselves, we noticed some interesting policy changes in the Nordic region. Until a few years ago, Nordic countries had a long history of providing free higher education for all students, domestic or international. However, Denmark and Sweden recently implemented a policy to charge full higher education fees in the case of non-EU/EEA students in 2006 and 2011 respectively. Finland also introduced a trial in which tuition fees were charged on some graduate level programs from 2010-2014 for non-EU/EEA students. Meanwhile, tuition-free higher education persists in Norway and Iceland for all students. High tuition fee expenditures for studying abroad are a major part of costs for a utility-maximizing individual; this approach in the sense of human capital theory requires higher expected future return in order to justify investment. It is then natural to infer that international student mobility may be affected by tuition fees. In addition, we include Germany in this research as one of the most popular international higher education destinations in the world; it was listed as the fifth top host country in 2012 and continues to pursue policies of free higher education for all students. This functioned to enrich our database and strengthen comparisons.
The primary purpose of this article is to assess the impact of tuition fees implementation on the inflow of international students. We address this issue by using a modified gravity equation for immigration. This incorporates specified variables from home and host countries during 2003 to 2012.
The paper is structured as follows: after a background review, we discuss some theoretical and empirical frameworks to explain student mobility, then contextualize the topic with early literature. Then we specify data and methodology to empirically estimate the influence and present the results. In the last section we make general conclusions and go over limitations of our work.
Background
According to UNESCO (the United Nations Educational, Scientific and Cultural Organization), there were about 2 million students who studied abroad in 2000. The increase was rapid: in 2012, the number of student who studied abroad was 4 million. Although the
five most popular countries (the United States, United Kingdom, France, Australia and Germany) attracted about half of all international students, the annual share of their enrollment of foreign students has decreased from 55% to 47% during this period. Meanwhile, an increasing number of international students have begun to explore new destinations. In 2011, Europe held half of all international students
Based on the classification of the OECD (Organization for Economic Co-operation and Development), there are three basic groups of countries implementing different higher education tuition fees policies: countries charging no tuition fees for all students, countries charging tuition fees for all students, and countries charging higher tuition fees exclusively for foreign students. In most European countries, non-EU/EEA students need to pay much higher tuition fees than EU/EEA students, like in the United Kingdom and Netherlands. Tuition fees vary between countries, with the average being around €10,000 per year. However, as one of the traditional hot destinations for international students, Germany’s federal states rarely charge tuition fees in the case of non-EU/EEA students. Only two of them, Bavaria and Lower Saxony, require tuition fees of approximately €1,000 per year, substantially below fees charged by other European countries. At the same time, as one of the new destinations, the Nordic region is a typical and special case in attracting international students, especially students from outside EU/EEA. Indeed, until a few years ago, the Nordic countries had a long history of free higher education for all domestic and international students. Denmark started to charge non-EU/EEA students for higher education beginning in2006. It was the first Nordic country that practiced the tuition fees policy. Finland soon introduced a trial project during 2010 to 2014, where some graduate programs charged tuition fees on non-EU/EEA students. Sweden followed later, deciding that non-EU/EEA students must pay tuition fees beginning in the 2011 academic year. The other two Nordic countries, Iceland and Norway, still provide tuition free higher education for all students.
Table 1 introduces tuition fees policy in countries discussed by this paper. One of the most significant characteristics among these countries is that all of them provided tuition-free higher education to all international students before 2006. Although some of them charged registration fees or small amount of tuition fees otherwise, these were comparatively insignificant. Denmark and Sweden put the new tuition fees policy into practice in 2006 and
2011, respectively. It should be noticed that Finland introduced the five-year trial in 2010, but it is still treated as a tuition-free country during the period in this paper. One reason is that, according to the report of the CIMO (Centre for International Mobility) in Finland, only “in selected (not all) English-language Master's degree programs it has been possible for the Finnish higher education institutions to charge tuition fees from non-EU/EEA nationals”. Universities and institutes had their own option on the practice of tuition fees. In fact, there were 399 eligible programs but just 41 of them charged tuition fees. Another reason is that, due to numerous and extensive scholarship programs in Finland, few non-EU/EEA students had to pay the tuition with their own finances.
Table 1: Tuition fees in the reporting countries
Country EU/EEA Students Non EU/EEA students
Denmark
No tuition fee is
charged from EU/EEA
and exchange
students.
Introduced in 2006. Tuition fees vary from different
study programs. The approximate amount is
€6,200-€13,100 per year.
Sweden Introduced in 2011. The approximate amount is
€6,500-€15,500 per year
Finland Trial period: 2010-2014. Depending on the university or
program, students might be charged tuition fees from €5,000-€12,000 if the language of instruction is not Finnish or Swedish.
Iceland No tuition fees at public universities. Only registration fees are required. The amount is around €350 per year.
Norway No tuition fees at public universities.
Germany The federal states Bavaria and Lower Saxony charge tuition fees of approximately €1,000 per year. Some other federal states charge registration fees of €100 per year. Non EU/EEA students may be charged slightly higher fees.
From table 1, it seems the changing of tuition fees policy in the reporting countries will definitely affect their higher education institution. In fact, the influence is not only limited in education sector, but also extend to economic field. According to the definition of GATS (General Agreement on Trade in Services), trade in education is a part of trade in service because study abroad is one form of consumption abroad. However, there are few empirical studies on trade in education. Previous studies often focused on the influences of integration policies negotiated between countries. Tuition fees policy which aimed at international students is a relevant part of service in trade policies. However, due to the complexity of the influence of education, the evaluation of the policy is more complex than other trade in service activities. In fact, traditional destination countries which have a long history of higher education tuition fees tend to care more about improving competitiveness to attract the best international students. As a result, the effect of increasing tuition fees received more attention in these countries (Chowdhury, 2012; Bohman, 2014; Cantwell, 2015).
Tuition fees vary in reporting countries after the introduction of new policy in some of them, and the impacts in the long run are still indeterminate. The implementation of tuition fees policy is still recent in Denmark and Sweden, and the final decision on whether to charge students outside EU/EEA tuition fees has not yet been made in Finland. For Germany, Iceland and Norway, there is no sign they will put an end to their tuition-free policies toward non EU/EEA students. Analyzing direct effects of new tuition fees policy implementation is more relevant for these nations than analyzing the long term determinants under a specific tuition fees system at the moment.
Therefore, the influences of tuition fees in those countries are more notable in terms of the background of the prosperous international education market. One salient problem is how to evaluate the effects of policy transition in the former tuition-free countries. Many early studies analyzed the relationship between international student mobility and tuition fees. By using student enrollment, Campbell and Siegel (1967) found negative influences of price changing on student demand for higher education in the United States1. Also based on the
theory of student demand, Agarwal and Winkler (1985) arrived at the same conclusion: 1 Tuition fees, together with books, living costs etc. was viewed as the direct cost of higher education in their
education expenditure negatively influenced foreign student inflow in the United States. Research in recent years has provided further evidence of the influence of tuition fees on demand. More researches focused on the influence of tuition fees in Europe than before, especially in the traditional destinations. For instance, Dearden, Fitzsimons and Wyness (2011) found that if tuition fees increase £1,000, higher education participation would decrease by 3.9% in the case of the United Kingdom. Naidoo (2007) estimated the determinants of student mobility to the United Kingdom during 1985-2003, finding higher tuition fees resulted in less demand for international education.
In the meantime, some studies found opposite results on the effect of tuition fees. For example, tuition fees area positive determinant of international student mobility for two reasons (Beine, Noel and Ragot 2014). First, higher tuition fees reflect higher education quality, so countries with higher tuition fees are more attractive to international students. Second, reverse causality accounts for the positive relation. The attraction and acceptation just occur among students who can afford tuition fees; in most cases, universities have little incentive to accept foreign students without financial means.
It seems that tuition-free policies could be an important advantage in attracting foreign students, but what accompanied with the booming phenomenon of study abroad is the fiercer competition of applying for top universities, as high-quality education is always most sought, especially in the case of less developed countries’ students. The effect of tuition fees remains uncertain for different countries, but the experiences and results of the tuition policies are of great value as a guide for assessment and a reference for countries considering new or changing policies. However, the former research mainly focused on the influence of tuition fees on one specific country, particularly in traditional popular destinations. Influence of tuition fees varies between regions, but there is relatively little literature devoted to new destinations. Our paper is based on the early studies and theories but extends analysis to several new international education destinations, but especially Nordic countries. While former studies have mostly paid attention to the effect of increasing tuition fees, here we will estimate the effect of tuition fees by comparing student inflows before and after policy changes. Our analysis will provide evidence regarding the influence of tuition fees policy implementation on international student mobility.
Explaining the mobility of student
When exploring the determinants of international student mobility, there is a variety of economic, social, political and other factors at play in both host country and home country. Despite the fact that this topic has recently drawn unprecedented attention, there are still few empirical studies. Below, we identify and discuss a number of different theoretical and empirical frameworks that will help explain student mobility factors: pull-push, human capital and migration theory, and the gravity model.
Pull-push framework
The “push and pull” framework could explain international student mobility, which basically considers that a combination set of push and pull factors leads to global education inflow and outflow. Push factors are adverse elements operated within the home country that push students to germinate the idea to leave the home country education system and study abroad. Pull factors, on the other hand, attract overseas students and promote them to selectively choose the destination. Many forces act as push or pull factors in global education mobility. Examples are push factors like lack of access to higher education, low income, and poor career prospects in home country make people generate the initial idea to leave. Meanwhile, pull factors like better social benefits and higher quality of education provided in host country offer variable choices.
Empirical analysis on push and pull framework might be organized into analysis based on data obtained from student questionnaires, and analysis based on statistical data.
For the first approach, Mazzarol, Kemp and Savery(1996) conduct a study to examine the reason why international students from Taiwan and Indonesia choose not to study in Australia. They carry out a large scale survey using questionnaires to consult students as well as advisers like teachers and education agents. According to their results, there exist six main “pull” factors that contribute to the international student inflow in the host country. The first one is labeled as cost issues, including: fees, living and travel costs, level of racial discrimination, safety and crime. Second is knowledge and awareness of the host country by the home
country, which is indicated by student knowledge of host country, quality and reputation of education that host country provide, and recognition of the qualifications for selected country have back at the home country. The third factor is about the environment and whether a host country would provide a positive study environment with attractive scenery and living conditions. Recommendations are the fourth factor, indicating that social opinion and references work as a very important factor in the choice of destination. The fifth factor is sociological linkages, which depend on whether students have family or friends already studying or living in a host country. Geographic proximity is the final pull factor, meaning that distance between two countries also impacts education destination choice.
For the second statistical approach, Winkler and Agarwal (1985), using the second approach, studied the demand for US higher education of students from 15 low or middle-income Eastern Hemisphere nations. They collected statistical data from 1954-1973. Results show that the total number of foreign students studying in the US increased rapidly, though the actual proportion of international students who decided to enroll in the US higher education system had initially been declining after Second World War. They connected this phenomenon with per capita income, the growing prices of US education, access to higher education in home countries and changes in immigration benefits of studying in the US.
Similarly, McMahon(1992) examined, based on the post-World War II world market situation, the flow of international students from 18 developing countries studying in developed countries in the 1960s and 1970s. He uses two models: the outbound push model suggests national economic wealth, the level of home country involvement in global trade, the priority state of domestic education and access to national education opportunities affect home country student outflow; the inbound pull model suggests that foreign student inflow in the host country is related to relative economy size of home country to host country, trade concentration between home and host country, foreign assistance from host country and host nation educational institution support2.
Human capital and Migration theory
Human capital theory implies that individuals intentionally choose to invest in themselves through education or training; this can also be done by migration. Sjaasted (1962) was one of the earliest to raise the point that migration cannot be treated in isolation, and costs and returns in the migration process are at least as important. In human capital migration theory, labor consciously migrates to increase benefits to its constituents. The main focus is on whether labor decides to migrate, where most studies focus on the return one expects to gain from migration compared to staying (Kan, 1999). Using a two-sector internal trade model with unemployment, Harris and Todaro (1970) studied the process of urban-rural migration in relation to the difference of urban-rural expected earnings. One crucial assumption of their model is that the urban-rural migration will continue to exist as long as the expected urban income is higher than the value of agricultural products – individuals maximize their expected utility. The net difference of economic benefits, mainly wages, is the cause of internal migration. Harris and Todaro argue that, in this case, when wages lack flexibility, it is optimal to offer a policy package that consists of partial wage subsidies (or direct government employment) and free migration restrictions. The new theoretical base for the economics of migration has expanded and highlighted the role of decisions to migrate as a socially collective choice. Such theories indicate that social relationships play a relevant role in decision-making to maximize utility of a group. For students, the “utility-maximizing group” mostly refers to their family, who share the risk and payback of the decision to move. Family background (education level and occupation), unemployment rate in domestic labor market (Stark and Bloom, 1985), social opinions and links (Mazzarol, Kemp and Savery, 1996) can therefore all be vital determinants of choice.
Younger groups such as high school graduates are probably the most mobile group in terms of migration. Schwatz(1976) proposed that migration levels and migration distances increase with education level and decreases according to age. Human capital theory implies that individuals continue to invest in higher education until the marginal benefit of investment is equal to the marginal cost, which is the cost of borrowing to funding higher education in a perfect capital market (Winkler and Agarwal, 1985). Benefits in this context chiefly include
wage, net economic advantage, employment opportunities, consumption opportunities, cultural amenities and many others (Korpi and Clark, 2011).
From the view of consumption theory, higher education students choose migration so as to obtain current consumption utility. A variety of beneficial factors contribute to creating higher current utility. Mixon(1992) took these variables into consideration when he considered climate; Sá et al.(2004 and 2006) proved the importance of where university locates; Fenske, Scott, &Carmody (1972), and Winkler and Agarwal(1985) underlined the effects of price and financial aid on education system.
Tuckman (1970) began this trend when considering interstate out-migration of college freshman in the United States under the theoretical foundation of investment or consumption theory of demand. Per capita income (which serve as a proxy for family income) and average price within-state colleges charge both impose positive effects on out-migration among states. At the same time, travel cost3 decreases out-migration. However, when he isolates voluntary4
out-migration from involuntary out-migration, the income effect becomes insignificant.
To extend Tuckman’s study, Mixon (1992) enlarged the dependent variables in a new model to include university location and quality, along with public aid. The results he received were more comprehensive; he confirmed the ambiguous effects of family income5 and the positive
effects tuition fees have on out-migration. Also, states with high quality academic colleges see less voluntary out-migration. He also pointed out that students prefer coastal area, warm climates and more public aid, though the effects of these desires are insignificant.
Gravity model
In the 1960s, Tinbergen originally introduced the gravity model as more of an empirical approach based on Gravitation of Newton’s Law to predict bilateral trade flows between two areas. International trade study has used the model widely ever since. Explanatory variables in his standard equation of gravity model are economic size (usually measured as GDP) and 3 A shortcoming here is he uses number of public college in states as a proxy to estimate travel cost
4Voluntary migration means relocation with personal desires, in this case, it refers to the situation student decides
to out-migrate even there exist within-state college.
5 The reason is, as Mixon points out, we can’t define out-state university as normal or inferior
distance (which represents the cost of trading) between two areas. Later, the specification of gravity model has been adjusted and extended by adding more factors such as common language and colonial links which may influence bilateral trading. J.E.Anderson and E. Van Winncoop(2003) noted that relative trade cost has an impact as a way to estimate country a specific fixed-effect. The general form of gravity equation is:
Xij=GSiMjDij (1)
whereXijis trade flow from countryito countryj,Gis a constant which does not depend oni
orj, which could represent a variable such as world liberalization.SiandMjrepresent the size of countriesiandj,respectively.Dijindicates geographic distance betweeniandj.
Given the nature of multiplicative formation, the common and more practical way to estimate gravity equation is to take a logarithm of all variables in both sides, so it becomes:
lnXij=lnG+lnSi+lnMj+lnDij (2)
It is much easier to estimate this log-liner equation by using ordinary least square regression, which also functions to make the data more succinct.
In this simple form, distance captures bilateral trade cost between two countries. Moreover, additional cost becomes precisely measurable by adding a number of other variables like common language, colonial links, or common boarders, depending on analysis requirements. More importantly, the logic of gravity model is applicable to empirical studies in all the previously reviewed theoretical framework, since explanatory variables used in the gravity equation exactly reflect the main idea they discussed. Gradually, vast amounts of literature involve foreign direct investment, labor force mobility, internal or international migration and tourism in order to make use of gravity equation.
There are handful studies treat international higher education as temporary or permanent migration, or the same as tourism provided by a host country and as a service trade. Our topic falls in this category, and the gravity model is applicable here. From this point of view, international student mobility is proportionally related to the population and GDP of both
countries, inversely proportional to the geographical distance between them.
Some have added more potential factors as a test. Leppel (1993) first applied the gravity model to education choice to identify determinants of students’ choice of college enrollment. Data employed in his research is based on information about students who chose to take an offer of acceptance from a certain university in the United States in 1990. He used an innovative logarithmic form of gravity model and the main results showed that distance and SAT points significantly affect choice of enrollment. Students who live far away from the location of the university with higher SAT points are less likely to accept the offer. However, at a certain point, greater distance stops acting as a negative impact factor anymore. Moreover, Leppel determined that age, gender, marital status, family income, and program of study did not contribute to the final stage of decision-making.
Sá et al. (2004 and 2006) carried out two studies that focused on determinants of high school graduates entering higher education (university or professional college) in the Netherlands. In the first study, they looked at university entrance and modified the gravity model to emphasize the importance of university features. The study confirmed how distance has a negative effect on student movement. The scope of university measured in numbers of available programs was also positively related to the decision to attend. They extended this study’s range to university and professional college, or no higher education at all, to further investigate the role of higher education accessibility in the enrollment choice in 2006. This time they adjusted a multinomial choice model in a utility maximization framework, taking into account both potential relevance of localized social interactions and impact of space. The main findings support the study’s previous conclusion that geographical accessibility has an outstanding role to encourage further education. Meanwhile, gender, nationality, high-school performance, etc., all have varying influence on whether students continue education or not.
Strongly proved by adequate empirical studies, the gravity model was still criticized for its earlier lack of theoretical background. Anderson (1979) made the earliest attempt to provide a clear theoretical background for gravity model. He came up with a model with country of origin, in which he assumed that goods are differentiated by country of origin (known as the Armintong Assumption) indicating different consumer preferences. Following that, Bergstrand (1985, 1989) continued to reveal the connection between gravity model and the
old and new trade theories. He showed that gravity model can derive from Krugman (1979)’s one-sector monopolistically competitive model. Other than these, Deardoff (1998) proved one can deduct the gravity model from the Heckscher-Ohlin model6 as well. He emphasized that,
just as the one-sector monopolistically competitive model, any plausible trade model would yield something similar to the form of the gravity model. Because of this, empirical achievement of gravity model does not have to prove anything, but instead remain steadily “a fact of life” according to Deardoff.
Data
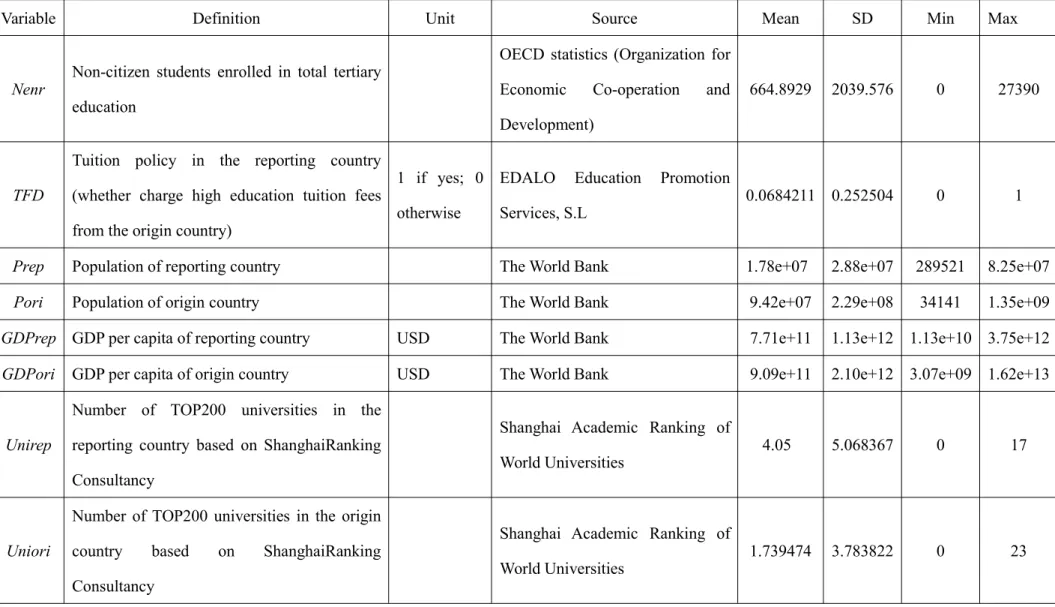
Table 2 shows the source of all the data, as well as some descriptive figures.
Description of the dependent variable
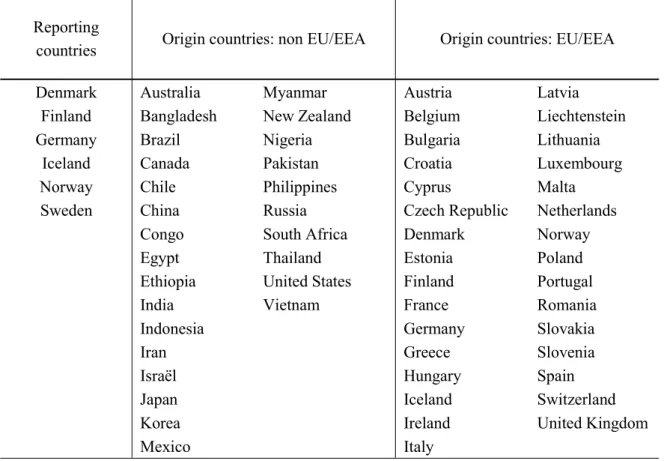
We employ multi-destination country and multi-origin country data in this essay, but since the objective is to estimate the influence of tuition fees policy on six reporting countries, only unilateral inflow is relevant to this study. To estimate the effects of tuition fee policies, we included two groups at the origin side: EU/EEA countries and non EU/EEA countries. The EU/EEA group includes foreign students from all the EU/EEA countries and Switzerland; the non EU/EEA group includes foreign students from non-EU/EEA OECD countries and other non-OECD countries with large population size7. (See Table 3). Here, the hypothesis is that
population and the economic development of a country are linked closely with the education service trade situation. Among the reporting countries of Denmark, Finland, Germany, Iceland, Norway and Sweden, Denmark and Sweden have carried out higher education tuition fees measures aimed at non-EU/EEA students. Finland was in the trial period of tuition fees, while Germany, Iceland and Norway continue to provide free higher education for all students.
6 The Heckscher-Ohlin model is a mathematical model of international trade, the main idea is that country will
export products using abundant endowments and import products using their rare endowment.
7 Countries in the list of the world’s 30 most populous countries are considered as large population size in this
Table 2: Data source
Variable Definition Unit Source Mean SD Min Max
Nenr Non-citizen students enrolled in total tertiary
education
OECD statistics (Organization for Economic Co-operation and Development)
664.8929 2039.576 0 27390
TFD
Tuition policy in the reporting country (whether charge high education tuition fees from the origin country)
1 if yes; 0 otherwise
EDALO Education Promotion
Services, S.L 0.0684211 0.252504 0 1
Prep Population of reporting country The World Bank 1.78e+07 2.88e+07 289521 8.25e+07
Pori Population of origin country The World Bank 9.42e+07 2.29e+08 34141 1.35e+09
GDPrep GDP per capita of reporting country USD The World Bank 7.71e+11 1.13e+12 1.13e+10 3.75e+12
GDPori GDP per capita of origin country USD The World Bank 9.09e+11 2.10e+12 3.07e+09 1.62e+13
Unirep
Number of TOP200 universities in the reporting country based on ShanghaiRanking Consultancy
Shanghai Academic Ranking of
World Universities 4.05 5.068367 0 17
Uniori
Number of TOP200 universities in the origin country based on ShanghaiRanking Consultancy
Shanghai Academic Ranking of
Table 3: List of countries
Reporting
countries Origin countries: non EU/EEA Origin countries: EU/EEA Denmark Australia Myanmar Austria Latvia
Finland Bangladesh New Zealand Belgium Liechtenstein Germany Brazil Nigeria Bulgaria Lithuania
Iceland Canada Pakistan Croatia Luxembourg Norway Chile Philippines Cyprus Malta Sweden China Russia Czech Republic Netherlands
Congo South Africa Denmark Norway Egypt Thailand Estonia Poland Ethiopia United States Finland Portugal India Vietnam France Romania Indonesia Germany Slovakia Iran Greece Slovenia Israël Hungary Spain Japan Iceland Switzerland Korea Ireland United Kingdom Mexico Italy
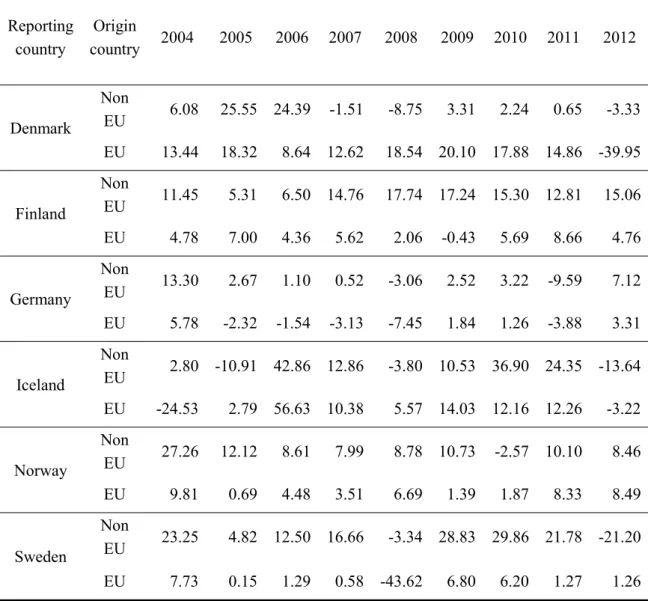
The following table and figures help capture the general features of the dependent variables in our econometric model by providing intuitive display of the foreign students’ enrollment from 2003 to 2012. They intend to reveal the influence of higher education tuition fees by comparing the changes of enrollment in each group by country.
Table 4 visually shows the enrollment growth rate in our six reporting countries. First we look at the non-EU/EEA group. The growth rate in Denmark decreased from 24.39% to -8.75% during 2006-2008, and then it reached a stable level of around 2% after 2008. Sweden also experienced a dramatic decrease after the implementation of tuition fees in 2011. At the same time, Finland, Germany and Norway maintain a relatively steady growth rate. We notice the most fluctuated growth rate came from Iceland, but this may not reflect any specific changes and may not be comparable due to Iceland’s total number of non-EU/EEA students is relatively small, along with its actual economy and land mass. For instance, the yearly average number of non-EU/EEA students enrolled in higher education programs was only 170 during our time period of investigation. As a result, a one-student change could result in a
significant adjustment in the growth rate in Iceland.
Table 4: Enrollment growth rate of foreign students (2003-2012) Reporting country Origin country 2004 2005 2006 2007 2008 2009 2010 2011 2012 Denmark Non EU 6.08 25.55 24.39 -1.51 -8.75 3.31 2.24 0.65 -3.33 EU 13.44 18.32 8.64 12.62 18.54 20.10 17.88 14.86 -39.95 Finland Non EU 11.45 5.31 6.50 14.76 17.74 17.24 15.30 12.81 15.06 EU 4.78 7.00 4.36 5.62 2.06 -0.43 5.69 8.66 4.76 Germany Non EU 13.30 2.67 1.10 0.52 -3.06 2.52 3.22 -9.59 7.12 EU 5.78 -2.32 -1.54 -3.13 -7.45 1.84 1.26 -3.88 3.31 Iceland Non EU 2.80 -10.91 42.86 12.86 -3.80 10.53 36.90 24.35 -13.64 EU -24.53 2.79 56.63 10.38 5.57 14.03 12.16 12.26 -3.22 Norway Non EU 27.26 12.12 8.61 7.99 8.78 10.73 -2.57 10.10 8.46 EU 9.81 0.69 4.48 3.51 6.69 1.39 1.87 8.33 8.49 Sweden Non EU 23.25 4.82 12.50 16.66 -3.34 28.83 29.86 21.78 -21.20 EU 7.73 0.15 1.29 0.58 -43.62 6.80 6.20 1.27 1.26
We include the growth rate of enrollment of EU/EEA students as a comparable factor. The table shows the growth rate maintained at a much more steady level in the EU/EEA group. Another result we found from the figures is that tuition fees have different effects on the non-EU/EEA group and the EU/EEA group. In Denmark, the growth rate is higher in non-EU/EEA countries before 2007. After 2007, the growth rate in EU/EEA countries became higher. At the same time, the other five reporting countries have a higher average growth rate in non-EU/EEA countries. Among them, Sweden achieved higher growth rates in the non-EU/EEA countries up until the tuition fee policy was put into effect.
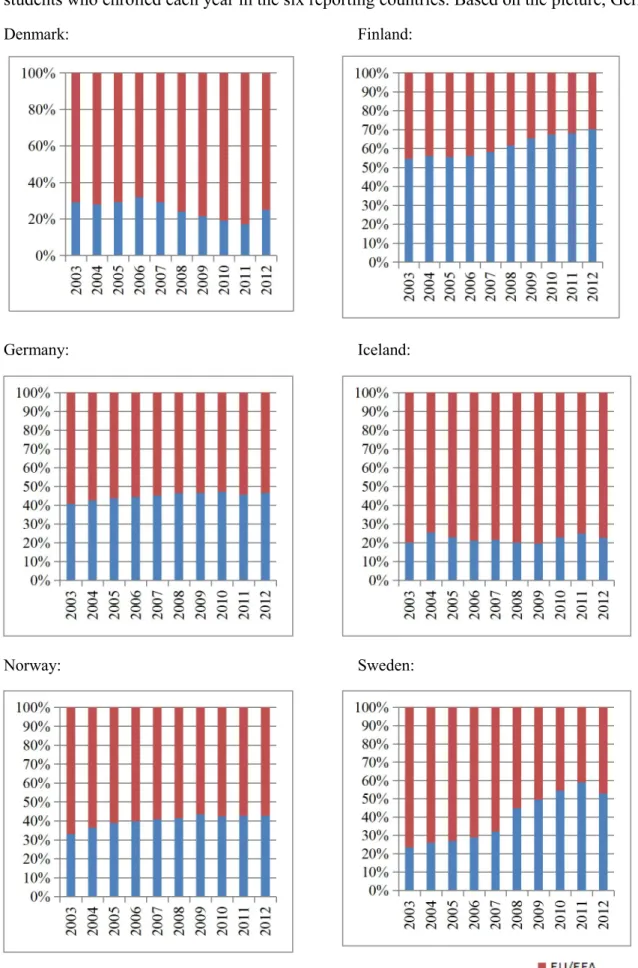
Figure 1 reveals the percentage of non-EU/EEA foreign students and EU/EEA foreign students who enrolled each year in the six reporting countries. Based on the picture, Germany,
Denmark: Finland:
Germany: Iceland:
Norway: Sweden:
Iceland and Norway maintained a more stable proportion of non-EU/EEA and EU/EEA students. Both Germany and Norway had around 40% of non-EU/EEA students, and the percentage continued to increase slightly. The percentage in Iceland was close to 20%, the lowest of all reporting countries. On the contrary, Finland exhibited the greatest number of non-EU/EEA foreign students and the upward trend continued. In 2012, among the 57 origin countries in our model, 70% of foreign students in Finland came from outside Europe. Moreover, Finland was the only country wherein the amount of non-EU/EEA students exceeded EU/EEA foreign students during our sample’s time period.
Be differ from these countries without full higher education tuition fees, Denmark and Sweden went through a downward trend of the proportion of non EU/EEA students after introducing such tuition fees. Denmark’s share of students began decreasing after 2006 and the proportion of non-EU/EEA students has dropped over 10% after the new tuition policy took effect. The declining trend lasted for five years before rising in 2012. An immediate decrease also took place in Sweden, where the proportion of non-EU/EEA students decreased from 59% to 53% in a single year.
Description of the independent variable
Combing all the information from the above parts we discussed and the requirements of this study, we chose a gravity equation and the determinants of student inflow include:
The implementation of tuition fees. A dummy variable is used as the indicator of tuition fees policy and registration fees are not considered as a part of tuition fees here. Since the tuition dummy varies over time, we can access the impact of tuition fees on student inflows. The expectation is that the international student inflows decrease a considerable amount after the implementation of new tuition fees policy. Then we will estimate the impact of tuition fees policy by comparing the effect with other determinants.
Population of origin and reporting countries: population is one of the core variables in gravity models. It captures the size of a country’s human component and has been proved to be a positive determinant of trade flow between countries. Student inflow is expected to be an increasing function of population in origin and reporting countries.
GDP per capita of origin and reporting countries: GDP per capita is the measurement of the economic capability of a country. According to Cummings (1984), GNP per capita is a helpful indicator which reflects economic capacity. Following this method, GDP per capita is employed to capture the level of income. High GDP per capita enables students to pay tuition fees and living costs, two main considerations of studying abroad. The influence of GDP per capita of origin countries is supposed to positively affect student inflow, whereas the effects of GDP per capita of reporting countries are more complicated. On one hand, a country with high GDP per capita often provides high quality education, a core and undoubted attraction for foreign students. On the other hand, high GDP per capita creates obstacles for international students as it reflects higher living and study costs8.
University rankings of origin and reporting countries: The quality of a university is another core attraction for foreign students. Bouwel and Veugelers (2009) proved positive and significant effect of higher education system quality has on the direction and size of student bilateral flow, using an extended gravity model. Two measures they have used as quality indicator: relative impact of a country’s publications9 and the number of universities in the
Shanghai’s Top 200 academic ranking a country has. We in this study choose the second measurement - Shanghai’s Top 200 academic ranking of world universities, suggesting that a host country with more high ranking universities is more attractive for foreign students. The numbers of top universities of origin countries are also included, since study in a domestic country is an alternative for international students. If the education quality is higher in the origin country or it can satisfy the needs of domestic students, the student outflow from this origin country is expected to be relatively less than other countries with lower education quality.
Languages and distances are two basic determinants in gravity model and they were included in most international student mobility scholarship. However, we excluded language and distance variables in our adjusted model. This is because its purpose is to estimate the
8 Unless tuition is free.
9 To measure the relative effect, they compare share of a country’s research citations in world total citations,
relatively to the share of this country’s publications in world total publications. If the ratio is above 1, then the country’s research attracts more citation than rest of the world. Otherwise it represents the opposite result.
effects of tuition fees due to policy changes, rather than investigate all the possible determinants of student inflow. The other reason is that the method is analyzing the influence of tuition fees policy on student inflows using fixed effect. This makes time-invariant variables not adaptive in this model.
Empirical specification of the gravity equation and findings
We use an extended gravity equation to analyze the influence of tuition policies. Our objective is to identify the effects of taking the treatment of tuition fees through the variation of student inflow, so are only concerned with time-variant variables. The equation includes the basic variables of a gravity model: GDP per capita in reporting and origin countries. We added a few other variables to capture the characteristics changing with time which may influence foreign student inflows. Since we are only interested in the impact of time-variant variables, fixed effects are employed to control for possible unobserved factors that may exert influence beyond the independent variables and enable us access to the net effect of the determinants. Here time fixed effect and country-pair fixed effect appear in our model, due to the student inflow that time and other country specific factors may affect. By estimating the parameters in the model, we attempt to explain the possible influence of tuition fees on reporting countries.
The adjusted equation used in this study is:
lnNenrijt =β0 +β1TFDijt +β2lnPrepit + β3lnPorijt + β4lnGDPrepit + β5lnGDPorijt + β6Unirepit +
β7Uniorijt+ Yearg +αij +εijt
i=1, 2, …, M j=1, 2, …, N
whereiindicates reporting countries and jindicates origin countries, andtindicates year. The sample size is M = 6 and N = 58. The dependent variable Nenrijt is the number of students
enrolled in reporting country i from origin countryj in year t. Then,rep stands for reporting countries and ori stands for origin countries. The independent variable TFD is a dummy variable taking the value “1” if tuition fee is charged and “0” otherwise; P is the current
population; GDP is GDP per capita; Uni is the number of Shanghai’s Top 200 academic ranking of world universities. So as to include the time and country fixed effects, time variable Yeargstands for the year dummies from 2003 to 2012 and the country pair indicator
αij accounts for the bilateral dimension of reporting and original countries, it represents the
panels in our model, reveals whether the observation is corresponding to reporting country i
and origin country j.Each country pair has its own unique features and some characteristics within the country pair may impact the determinant variables, so we need to control for this by using fixed effect model. Here, we have 342 possible country pairs for the 6 reporting countries and the 58 origin countries. Finally,εijtis the error term.
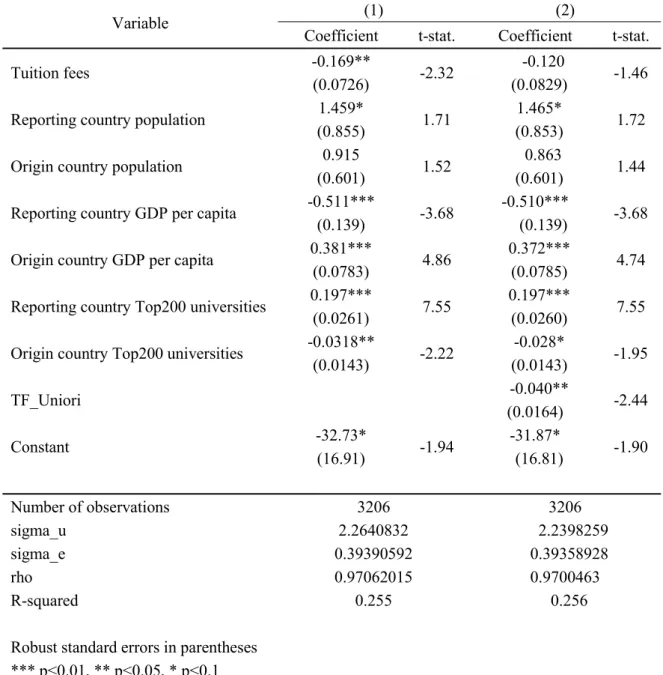
Column (1) in table 5 shows the results of the fixed effect estimation, which seem reasonable in our model. Our research discovered that tuition fees negatively affect international student inflow. The coefficient implies that if all other factors remain unchanged, student inflows are 16.9% less in the group treated with tuition fees than that without. The negative effects of tuition fees have triggered public discussion especially in traditional destinations. The media often blame the UK higher education institutions for declining international student inflow by increasing tuition fees (Garner, 2014; Jobbins, 2014). In some studies, tuition fees charged from international students are considered as additional revenue (Kweik 2001); increasing tuition fees also has a negative effect on foreign student enrollment numbers (Maslen, 2005). The problems faced by the countries that carried out their new tuition fees policy in recent years are not only decreasing international student enrollment, but also competition with traditionally popular countries which have already charged tuition fees for a long time. However, even in our case, we cannot say that tuition fees are the most significant or the most powerful determinant in the model. The influences of other variables are also noteworthy.
The populations of the reporting and origin country both positively affect student inflow, but the reporting country population variable is just significant at the 10% level and the origin country population is insignificant. The number of students who decide and are able to study abroad in our sample countries is fairly small compared with the population of the whole country. The impact of population is thereby limited because study abroad is a socio-economic activity rather than a simple population- related migration phenomenon.
According to almost all of the related studies mentioned above, economic income is rather critical, but the effect of population is not that significant.
The effect of GDP per capita of each reporting country negatively affects student inflows. The multi-destination countries method was seldom adopted in preceding literatures, which focus on international student inflow. As such, the impact of GDP per capita of the reporting countries is not taken into account in many studies, so there are few explanations concerning the influence of GDP per capita in reporting country. Price levels of a host country were found to exert a negative influence on student mobility in the Erasmus program (Gonzalez and Mesanza, 2010). In spite of differences in the emphasis of the two indexes, they reflect the living costs in the reporting country. High GDP per capita should not necessarily be regarded as a disadvantage for attracting international students. Wei (2013) found that students from developing countries put more weight on economic factors than students from developed countries; students from developed countries prefer to choose a more developed one as their foreign education destination. The main determinant here is actually the gap between GDP per capita in destination and origin countries. So students from developing countries are more concerned about expenditures and the purchasing power parity due to the huge economy gap with destination countries.
The sign of GDP per capita of origin countries tends to be in line with expectations, as they are all significant at the 1% level. Results suggest that the increase of GDP per capita in an origin country increases student outflow from that country. It confirms the importance of the economic situation, providing evidence that GDP per capita is a more significant determinant compared to the population size of an origin country.
High education quality contributes to the attraction of students in both reporting and origin countries. A survey about why students wish to study abroad shows that 82% of the students who intend to study abroad agree that “better educational facilities overseas” is their primary motivator. The most important reason for seeking this education, agreed by 84% of the interviewees, is to “enhance career prospects”. When the survey became more specific on factors of choosing a certain host country, 69% selected the answer of “educational reputation of the host country” (Bourke, 2000). Our study empirically confirmed the importance of education quality by employing university ranking as the indicator of education quality and
reputation. The effects of university rankings are significant in both reporting and origin countries.
The coefficients of year dummy variables10 show an overall endogenous increasing trend
during time. Migration theory in education could be one sufficient explanation of this phenomenon. The decisions of migration are generally made based on anticipated benefits and moving costs, so the conditions of the preceding migrators became a relevant reference objective. In the international education case, the number of past students exerted positive pressure on current students. There are two small fluctuations during the period: the coefficient decreased from 0.393 in 2007 to 0.311 in 2008, and decreased from 0.502 to 0.431 in the last two years.
In column (2), the extra variable “TF_Uniori”11 helps analyze the effects of university
ranking. This variable captures the role of higher education quality and the tuition costs of studying abroad for origin countries. In turn, this assists in interpreting whether tuition fees have a greater impact on origin countries with better higher education quality. Higher numerical number is given to origin country which be charged with tuition fees, and origin country with better higher education quality. A negative and significant effect can be observed from the result. Influence is different regard to the higher education quality in origin countries. Charging tuition fees does have a greater negative impact on economies with better higher education according to the regression results.12
10 See Appendix 1
11 HereTF_Uniori = TFDijt* Uniorijt
Table 5: Regression results
Variable (1) (2)
Coefficient t-stat. Coefficient t-stat. Tuition fees -0.169** -2.32 -0.120 -1.46
(0.0726) (0.0829)
Reporting country population 1.459* 1.71 1.465* 1.72 (0.855) (0.853)
Origin country population 0.915 1.52 0.863 1.44 (0.601) (0.601)
Reporting country GDP per capita -0.511*** -3.68 -0.510*** -3.68 (0.139) (0.139)
Origin country GDP per capita 0.381*** 4.86 0.372*** 4.74 (0.0783) (0.0785)
Reporting country Top200 universities 0.197*** 7.55 0.197*** 7.55 (0.0261) (0.0260)
Origin country Top200 universities -0.0318** -2.22 -0.028* -1.95 (0.0143) (0.0143) TF_Uniori -0.040** -2.44 (0.0164) Constant -32.73* -1.94 -31.87* -1.90 (16.91) (16.81) Number of observations 3206 3206 sigma_u 2.2640832 2.2398259 sigma_e 0.39390592 0.39358928 rho 0.97062015 0.9700463 R-squared 0.255 0.256 Robust standard errors in parentheses
*** p<0.01, ** p<0.05, * p<0.1
Note: time dummies are used in the regression
Conclusions
The change in international student inflow is one of the most direct results due to higher education tuition fees policy. The number of non-EU/EEA students in Denmark decreased after the tuition fees policy came into effect, but increased again after several years having recovered from the initial shock. However, both the increase rate and the proportion of non-EU/EEA students have not fully recovered during the time of this study’s investigation.
Sweden experienced a similar decrease of non-EU/EEA students in the short run, though its long run results are unknown due to the limitation of data period. At the same time, in the group which was not treated with tuition fees during 2003 to 2012, the increase rate of non-EU/EEA students had an increased tendency and the proportion of non-EU/EEA students was relatively stable. Since tuition fees shocked non-EU/EEA students in both Denmark and Sweden, the immediate drop of student inflow from outside Europe was unavoidable. Based on migration theory, tuition fees would lead to increasing moving costs for students, meaning that foreign students would require higher expected benefits from study abroad to offset the increased economic costs of the venture. Even so, the expansion of the Danish scholarship system may be responsible for the resurgence of enrolment. Another possible reason is that, under the fast developing international education market, the demand for higher quality education has increased rapidly, especially in less developed countries. We have observed exogenously growing international student inflow overtime, so countries with better higher education quality still have the advantage in attracting more tuition-paying students.
It is no surprise to find the exogenous growing of student inflow during time in the background of the prosperous of international education trade. The empirical study based on fixed effect method also indicates that charging tuition fees for non-EU/EEA students placed negative pressure on the number of non-EU/EEA students enrolled. Among the determinants, population in reporting country, GDP per capita of origin country and number of TOP 200 universities in reporting country are three push factors that promoted international students to choose the country of destination. According to the results, the quality of university is one factor that plays a significant role in international student mobility, so improving the reputation of university is an effective measure to attract more foreign students. Other variables, including GDP per capita, number of TOP 200 universities and tuition fees policy in reporting country all proved to be pull factors in our model. However, reporting country population shows no significant relationship with student inflow, so that the economic situation is more relevant for the decision to study abroad. In addition, the impacts of tuition fees are also measured on whether it influence more on origin countries with better higher education quality, a negative and significant effect is observed.
students in the international education market. For instance, the famous Erasmus program in Europe has been boosting the bilateral student flow into European countries since 1987 (Gonzalez, Mesanza and Mariel, 2012). Meanwhile, different methods have been implemented to attract non-EU/EEA students. Scholarships are a general method to offset the negative effects of tuition fees on international student mobility. Denmark began providing scholarships to qualified non-EU/EEA students in 2006. The total amount increased from DKK 2,000,000 in 2006 to DKK 59,000,000 in 2011. In Sweden, about 120 scholarships were issued to non-EU/EEA students in one year after the 2011 implementation of tuition fees (Nordic Council of Ministers 2013: Tuition Fees for International Students: Nordic Practice, p. 13). Even so, the specific impacts of scholarships are difficult to estimate empirically, due to the unpredictability of scholarships and limited access to data.
This study was motivated by the experience of participating in the international higher education and be affected by the varying tuition policy in the recent years. Based on the early studies’ contributions to international student mobility and the effects of tuition fees, this study attempts to estimate the impact on student mobility with and without tuition fees. Although the negative effect of tuition fees on student inflow seems to be common-sensical, this study provides empirical evidence to reflect the direct influence of higher education tuition fees policy.
The first limitation of this study is that some other possible time-variant determinants like safety levels, scholarships, or employment status in a country are not included because of the lack of resources or reasonable measurements. Tuition fees hikes during this period are also not taken into consideration, but it is also one of the possible variables that may realistically affect student mobility. Another limitation is international competition becoming more intense when a nation begins to charge tuition fees, as tuition-free policy was an important advantage for attracting internationals previously. We do not take influence of this potential interaction into consideration but underline the direct effect of tuition fees. Given these limitations, we have been able to assess the impact of tuition fees on student mobility, controlling for several observable and unobservable push and pull factors. Findings suggest that the implementation of tuition fees has a negative effect on the mobility of student.
References
Anderson, J. E. (1979) ‘A Theoretical Foundation for the Gravity Equation’, The American Economic
Review, 3/1/1979, vol. 69, issue 1, January, pp. 106-116.
Anderson, J. E. and van Wincoop, E. (2003) ‘Gravity with Gravitas: A Solution to the Border Puzzle’,The
American Economic Review, vol. 93, issue 1, January, pp. 170-192.
Beine, M., Noël, R. and Ragot, L. (2014) ‘Determinants of the international mobility of students’,
Economics of Education Review, vol. 41, pp. 40-54.
Bergstrand, J. H. (1985) ‘The gravity equation in international trade: some microeconomic foundations and
empirical evidence’,The Review of Economics and Statistics, vol.67, no. 3, January, pp. 474–181.
Bergstrand, J. H. (1989) ‘The generalized gravity equation, monopolistic competition and the
factor-proportions theory in international trade’,The Review of Economics and Statistics, vol. 71, no. 1,
January, pp. 143–153.
Bohman, E. (2014) ‘Attracting the World: Institutional Initiatives' Effects on International Students'
Decision to Enroll’,Community College Journal of Research and Practice, vol. 38, no. 8 pp. 710-720.
Bourke, A. (2000) ‘A Model of the Determinants of International Trade in Higher Education’, Service
Industries Journal, vol. 20, issue. 1, January, pp. 110-138.
Bouwel, L. V. and Veugelers, R. (2009) ‘Does university quality drive international student flows?’, DRUID Summer conference, Copenhagen.
Campbell, R. and Siegel, B. N. (1967) ‘THE DEMAND FOR HIGHER EDUCATION IN THE UNITED
STATES, 1919-1964’,American Economic Review, vol. 57, issue 3, June, pp. 482-495.
Cantwell, B. (2015) ‘Are International Students Cash Cows? Examining the Relationship between New International Undergraduate Enrollments and Institutional Revenue at Public Colleges and
Universities in the US’,Journal of International Students, vol. 5, no. 4, Sep-Oct, pp. 512-525.
Centre for International Mobility CIMO, Finland (2014) Tuition fee trial period 2010-2014, [Online],
Available: http://www.studyinfinland.fi/tuition_and_scholarships/tuition_fees/trial_period_2010_2014
Chowdhury, M. B. (2012) ‘Growth and dynamics of Australia's education exports’,Applied Economics, vol.
44, issue 7, pp. 879-888.
Cummings, W. K. (1984) ‘Going Overseas for Higher Education: The Asian Experience’, Comparative
Deardorff, A. V. (1998) Determinants of Bilateral Trade: Does Gravity Work in a Neoclassical World?, Cambridge, Mass.: National Bureau of Economic Research.
Dearden, L., Fitzsimons, E. and Wyness, G. (2011)The Impact of Tuition Fees and Support on University
Participation in the UK, Centre for the Economics of Education, [Online], Available: http://www.eric.ed.gov/contentdelivery/servlet/ERICServlet?accno=ED529853
EDALO Education Promotion Services, S.L.Compare tuition fees schemes in Europe, [Online], Available:
http://www.studyineurope.eu/tuition-fees [Nov 2015].
Fenske, R. H., Scott and Craig, S. (1972) ‘A Comparison of Freshmen Who Attend College in Their Home Community and Freshmen Who Migrate to College’, American Coll. Testing program, Iowa City, Iowa.
Garner, R. (2014) ‘Tuition fee hike blamed as international students at UK universities fall by a quarter’,
Independent.co.uk, [Online], 2 Apr, Available:
http://www.independent.co.uk/student/news/tuition-fee-hike-blamed-as-international-students-at-uk-u niversities-fall-by-a-quarter-9231151.html
González, C. R., Mesanza, R. B. and Mariel, P. (2011) ‘The determinants of international student mobility
flows: an empirical study on the Erasmus programme’,Higher Education, vol. 62, Issue 4, January,
pp. 413-430.
Harris, J.R. and Todaro, M. D. (1970) ‘Migration, unemployment and development: a two-sector analysis’,
American Economic Review, vol. 60, issue 1, March, pp. 126-142.
Jobbins, D. (2014) ‘Fees, tough visa rules blamed for foreign students dip’, University World News,
[Online], 2 Apr, Available:
http://www.universityworldnews.com/article.php?story=20140402104158289
Kan, K. (1999) ‘Expected and unexpected residential mobility’,Journal of Urban Economics, vol. 45, issue
1, January, pp. 72-97.
Korpi, M., Clark, W.A.V., and Malmberg, B. (2011) ‘The urban hierarchy and domestic migration: the interaction of internal migration, disposable income, and the cost of living, Sweden 1993–2002’,
Journal of Economic Geography, vol. 11, no. 6, November, pp. 1051-1077.
Krugman, P. (1980) ‘Scale economies, product differentiation and the pattern of trade’, American
Economic Review, vol. 70, issue 5, January, pp. 950-959.
Kwiek M. (2001) ‘Globalization and higher education’, Higher education in Europe, vol. 26, no. 1, pp.
27-38.
Higher Education, vol. 34, issue 3, January, pp. 387-398.
Maslen, G. (2005) ‘Falling Chinese student numbers threaten income’, The Times Higher Education
Supplement, April.
Mazzarol, T., Kemp,S. and Savery, L.(1996)International students who choose not to study in Australia:
An examination of Taiwan and Indonesia, Canberra: Australian International Education Foundation. McMahon, M. E. (1992) ‘Higher education in a world market: An historical look at the global context of
international study’,Higher Education, vol. 24, issue 4, December, pp. 465-482.
Muller, V. (1994) ‘Trapped in the body: Transsexualism, the law, sexual identity’, The Australian Feminist
Law Journal, vol. 3, no. 2, August, pp. 103-10.
Mixon Jr, M. G. (1992) ‘Factors Affecting College Student Migration across States’, International Journal
of Manpower, vol. 13, issue 1, pp. 25 – 32.
Naidoo, V. (2007) ‘Research on the Flow of International Students to UK Universities: Determinants and
Implications’,Journal of Research in International Education, vol. 6, no. 3, pp. 287-307.
Nordic Council of Ministers (2013) Tuition Fees for International Students: Nordic Practice, pp7 and pp.
13.
OECD (2011) Educationat a Glance, pp. 321.
Sá, C., Florax, R.J.G.M. and Rietveld, P. (2004) ‘Determinants of the Regional Demand for Higher
Education in the Netherlands: A Gravity Model Approach’,Regional Studies, vol. 38, no. 4, June, pp.
375-392.
Sá, C., Florax, R.J.G.M. and Rietveld, P. (2006) ‘Does Accessibility to Higher Education Matter? Choice
Behavior of High School Graduates in the Netherlands’,Spatial Economic Analysis, vol. 1, no. 2, pp.
155-174.
Schwartz, A. (1973) ‘Migration, age, and education’,Journal of Political Economy, vol. 84, issue 4, August,
pp. 701-719.
ShanghaiRanking Consultancy (2015) Academic Ranking of World Universities, [Online],Available:
http://www.shanghairanking.cn/#
Sjaastad, L. A. (1962) ‘The costs and returns of human migration’,Journal of Political Economy, vol. 70,
issue 5, October, pp. 80-93.
Stark, O. and Bloom, D.E. (1985) ‘The New Economics of Labor Migration’, The American Economic
Tinbergen, J. (1962)Shaping the World Economy: Suggestions for an International Economic Policy, New York: The Twentieth Century Fund.
Tuckman, H. P. (1970) ‘Determinants of college student migration’, Southern Economic Journal, vol. 37,
issue 2, October, pp. 184-189.
UNESCO (2014) Global Flow of Tertiary-Level Students, [Online] , Available:
http://www.uis.unesco.org/Education/Pages/international-student-flow-viz.aspx#sthash.0BVmmxwa.d puf
Wei, H. (2013) ‘An Empirical Study on the Determinants of International Student Mobility: A Global
Perspective’, Higher Education: The International Journal of Higher Education and Educational
Planning, vol. 66, no. 1, July, pp. 105-122
Winkler, D. R. and Agarwal. V. B. (1985) ‘Foreign demand for United States higher education’, Second Annual Meeting of the Association of Public Policy Analysis and Management, Washington, D.C., September.
Appendix
1. Regression results of time dummy variables
2. Testing for heteroscedasticity