©Universiti Malaysia Pahang
DOI: http://dx.doi.org/10.15282/ijame.11.2015.15.0196
2332
ARTIFICIAL NEURAL NETWORK OPTIMIZATION MODELING ON
ENGINE PERFORMANCE OF DIESEL ENGINE USING BIODIESEL FUEL
M.R. Shukri, M.M. Rahman, D. Ramasamy and K. Kadirgama
Faculty of Mechanical Engineering,
Universiti Malaysia Pahang
26600 Pekan, Pahang, Malaysia
Email: [email protected]
Phone: +6094246239; Fax: +6094246222
ABSTRACT
This paper presents a study of engine performance using a mixture of palm oil methyl
ester blends with diesel oil as biodiesel in a diesel engine, and optimizes the engine
performance using artificial neural network (ANN) modeling. To acquire data for
training and testing of the proposed ANN, a four-cylinder, four-stroke diesel engine was
fuelled with different palm oil methyl ester blends as biodiesel, operated at different
engine loads. The properties of biodiesel produced from waste vegetable oil were
measured based on ASTM standards. The experimental results revealed that blends of
palm oil methyl ester with diesel fuel provided better engine performance. An ANN
model was developed based on the Levenberg-Marquardt algorithm for the engine.
Logistic activation was used for mapping between the input and output parameters. It
was observed that the ANN model could predict the engine performance quite well with
correlation coefficients (R) of 0.996684, 0.999, 0.98964 and 0.998923 for the
in-cylinder pressure, heat release, thermal efficiency, and volume, respectively. The
predicted MSE (mean square error) error was between the desired outputs, as the
measured and simulated values were obtained as 0.0001 by the model. Long-term
effects on engine performance when running on biodiesel fuel can be further studied and
improved.
Keywords
: Artificial neural network, biodiesel, engine performance, palm oil methyl
ester.
INTRODUCTION
Fossil fuel and major greenhouse gas and global warming effects have increased due to
the dependence of many countries since in Middle East possessing over 55% of their
energy needs [1-7]. The combustion of fossil fuel produces CO that contributes to major
greenhouse gas and global warming effects. Due to the instability of the price of fossil
fuel, biofuel has attracted attention due to its attribute of being renewable. Nitrogen
oxide from diesel engines is a significant pollutant which requires proper control
strategies to mitigate health and environmental impacts [8-13]. Compression ignition
(CI) engines are much more fuel-efficient. Although the compression ignition engine is
the best choice for fuel economy, there is the problem of nitrogen oxides and
particulate matter, as well as the release of polycyclic aromatic hydrocarbons (PAHs),
carcinogenic effects and the controlled matter of heavy-duty diesel engines under the
US-HDD temporary cycle. In fact, due to the diminishing petroleum reserves and
2333
environmental pollution caused by the emission of exhaust gases from petroleum
engines, alternative fuels are becoming important for diesel engines and have to be
developed as soon as possible [14, 15]. Biodiesel has the potential to improve fuel
efficiency and decrease the emission of exhaust gases, so many countries in Europe are
interested in the evaluation of biodiesel fuels production. Biodiesel is typically defined
as an alternative fuel in which vegetable oil uses the reaction of methanol to the
presence of a catalyst to produce methyl esters and glycerin [16]. Furthermore, biodiesel
has the additional advantage of being biodegradable because it is from plant material,
and has the potential to be domestically produced so that demand for petroleum oil can
be reduced. Compared with conventional diesel fuel, biodiesel’s levels of carbon
monoxide, particulate matter (PM), and nitrogen oxides (NOx) in the combustion
emission of exhaust gases are reduced and the CO2 level as a greenhouse gas is also
decreased [17]. Nowadays, researchers are finding that some alternative fuels can be a
countermeasure to unstable oil prices. Alternative fuels include bio petrol, hydro fuel,
and biodiesel among the new sources of energy for vehicles. However, these alternative
fuels are still undergoing further research before they can be practically used as reliable
sources of energy in combustion engines. Crude oil is the most common form of fossil
fuel or non-renewable energy found in Malaysia and is in demand in many countries
such as Japan, Singapore, South Korea and Thailand. The high quality and low sulfur
content are factors in this demand [18].
Despite the active exportation of oil, the government still needs to import a huge
amount of crude oil to fulfil local demand. An unstable uncontrolled oil price leads to
high government expenditure in the budget, due to the policy of highly subsidized fuel
for the local market in the future. Therefore, the Malaysian Palm Oil Board (MPOB)
established by the Government has for many years been conducting research on the
potential of crude palm oil as an alternative fuel and substitute for the diesel fuel derived
from petroleum. The MPOB currently produces a wide range of biodiesel products from
animal fats and vegetable oils. Biodiesel products include the famous palm oil-based
methyl ester [19] or processed-liquid palm oil (PLPO). It can be blended with diesel in
certain percentages or can be used in current diesel engines. Malaysia, as the world’s
largest manufacturer of palm oil, with 17.7 million tons in 2008 [20] is the largest
exporter of biodiesel fuel due to the large stock amount of palm oil. Thus, by using
biodiesel, it is able to reduce the dependency on diesel and also benefits the planters
with increasing palm oil prices [21-23]. In order to reduce particulate matter and
nitrogen oxides and other exhaust gas emissions, the coupled use of biodiesel fuel
blends as another fuel can reduce current demand for and shortages of fossil fuel and
also help reduce pollution emissions and improve engine performance, yielding more
efficient, economical and clean emissions as well. The objectives of this study are to
investigate the engine performance using biodiesel in a diesel engine and to develop an
optimization model for the engine performance using the artificial neural network
technique.
METHODS AND MATERIALS
The experimental study was carried out on a 4-cycle, 4-cylinder, indirect injection (IDI),
water-cooled Mitsubishi 4D68 diesel engine. An eddy-current Dynalec dynamometer,
model ECB-200F SR 617 type water-cooled with 150 kW was used to load the engine.
The diesel engine is coupled with the eddy-current dynamometer to load the engine,
with a throttle speed sensor to give feedback to control the engine rpm, an air flow and
2334
fuel flow rate sensor to measure the fuel consumption and a crank encoder sensor with
an in-cylinder pressure sensor to determine the pressure and volume in-cylinder
according to the engine crank angle. All combustion gases pass through the exhaust
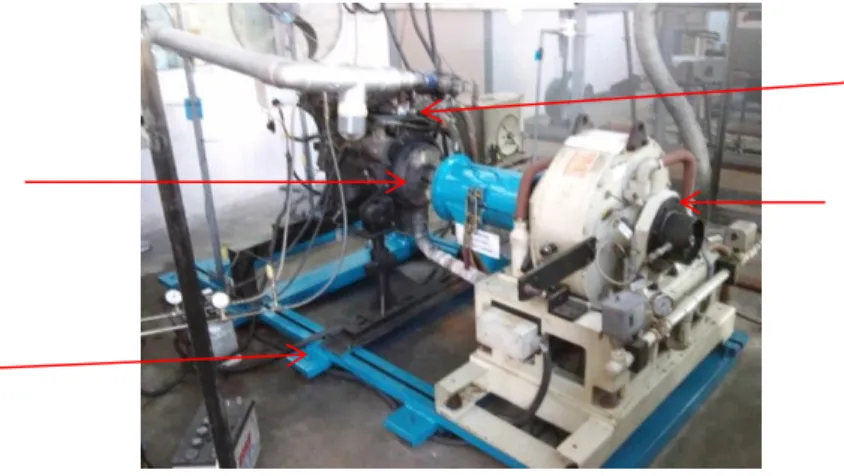
manifold. Figure 1 shows the diesel engine test rig which is placed with a pressure
transducer, crank angle encoder, and a load cell having several measurement
equipments, such as different thermocouples, the eddy-current dynamometer with
dynamometer coupling, assisted by different types of hose to connect the air box, air
heater and exhaust chamber. The detailed specifications of the engine are shown in
Table 1.
Figure 1. Diesel engine test rig.
Table 1. Diesel engine specifications.
Description
Specification
Manufacturer
Mitsubishi Motors Corporation Japan
Type / Model
Diesel / 4D68
Number of cylinders
4
Combustion chamber
Swirl chamber
Total displacement (dm
3) 1998
Piston stroke
82.7
Compression ratio
22.4.1
Lubrication system
Pressure feed, full-flow filtration
Power
64.9 kW @ 4500 rpm
Maximum torque
177 Nm @ 2500 rpm
Water pump type
Centrifugal impeller type
EGR type
Single type
Fuel system
Electronic distributor-type injection pump
After connecting the diesel engine with the dynamometer by a drive shaft
couple, throttle actuators integrated with the engine control the engine speed. This is
operated by a servo motor to turn the throttle actuator, depending on the experiment
requirement. The dynamometer has a load cell control provided by a Dynalec
ECB-200F 150 kW. The torque measurement can be obtained by the Dynalec dynamometer
with the load cell controller shown in Figure 2. This dynamometer can absorb a
maximum power rating of 150 kW (2500–13000 rpm) and is able to measure the torque
rating up to 60 kN (1500–2500 rpm). The load cell is the strain gauge, where the force is
Coupling
Test rig
Diesel Engine
2335
exerted from the rotation of the dynamometer arm and analog input manipulated by the
computer to the engine brake power value. The kinematic viscosity is also an important
property that has to be considered to ensure better engine performance. The testing
utilized ASTM standards in which the procedure testing temperature was 40ºC on the
standard viscosity measurement equipment shown in Figure 3.
(a) (b)
Figure 2. (a) Engine speed sensor and (b) load cell sensor.
Figure 3. Viscosity measurement setup.
In order to develop an artificial neural network (ANN) model to get the best
prediction results, several architectures were estimated and trained using the experiment
data. Firstly, a back-propagation algorithm was utilized for testing, training and
validation processes. This algorithm is used to supervise the training technique, where
the weight and biases of training networks are set randomly at the start of the training
stage. A gradient descent rule for the minimization process of error is achieved. In the
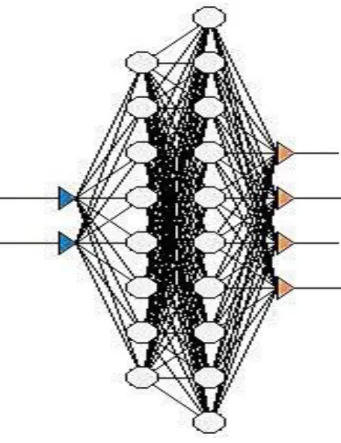
network architecture, there are two input and four output parameters in the experimental
data evaluation. The two input variables are the engine crank angle in degrees and the
RPM
pick-up
sensor
Load cell
Water gauge
Simple chamber Temperature bath2336
engine speed in rpm with the conventional diesel engine. The four output parameters
include the pressure in-cylinder in bar, heat release in percentage, thermal efficiency in
percentage and volume generated in dm³. Thus, the two input variables at the input layer
consist of two neurons related to the crank angle of the diesel engine and its engine
speed. Figure 4 shows the architecture of the ANN model for the prediction of engine
performance using biodiesel as fuel.
Figure 4. Architecture of artificial neural network.
Table 2. Summary of network evaluated.
Name
Architecture
Training
algorithm
Avg training
error
Avg test error
Network 1
2-2-3-4
Quick
Propagation
0.007896
0.008176
Network 2
2-4-3-4
Conjugate
Gradient
Descent
0.04778
0.004887
Network 3
2-5-3-4
Quasi-Newton
0.00441
0.004532
Network 4
2-6-5-4
Limited
Memory
Quasi-Newton
0.004399
0.004524
Network 5
2-8-10-4
Levenberg–
Marquardt
0.004199
0.004224
Network 6
2-7-5-4
Batch Back
Propagation
0.004473
0.004557
Pressure
in-cylinder
Heat release
Thermal
efficiency
Engine speed
Engine crank
angle
Volume
2337
The complexity of the problem and experimental data set can be designed based
on the number of neurons and hidden layers in each layer. In this project, two hidden
layers were used to make sure that the input variables make an equal contribution in the
ANN models. The logistic activation function was selected for the hidden layer
activation and the same was applied at the output layers. Furthermore, for the training
and testing performance the mean squared error (MSE) set at 0.0001 was preferred for
all ANN models. Finally, an R-squared and correlation analysis between the neuron
network response and related targets was performed in order to investigate the network
response in more detail. Table 2 shows a summary of the network evaluated. After
different training algorithms were tested, the Levenberg–Marquardt training algorithm
was selected.
RESULTS AND DISCUSSION
Three different blends, B5, B10 and B20, are used in this study. The blend properties
are summarized in Table 3. B5 is the standard benchmark used in the experiment. It can
be observed that the density, kinematic viscosity, flash point and cetane number
increase with increase of the POME mixture, indicating the increase of the blend
mixtures. However the heating values decrease with increase of the POME mixture.
Thus, it can be observed that B10 can be more powerful and fuel-efficient, having the
best cetane number and heating value.
Table 3. Fuel properties.
Fuel properties
B5
B10
B20
Diesel Fuel
Heating value (MJ/kg)
48.1392
46.783
46.6585
45.2
Density (kg/m
3)
835
837
843
820
Kinematic viscosity (cst@40ºC)
3.67
3.73
3.85
3.05
Cetane number
48.1
55.1
51.6
47
Flash point(ºC)
116
108
118
80
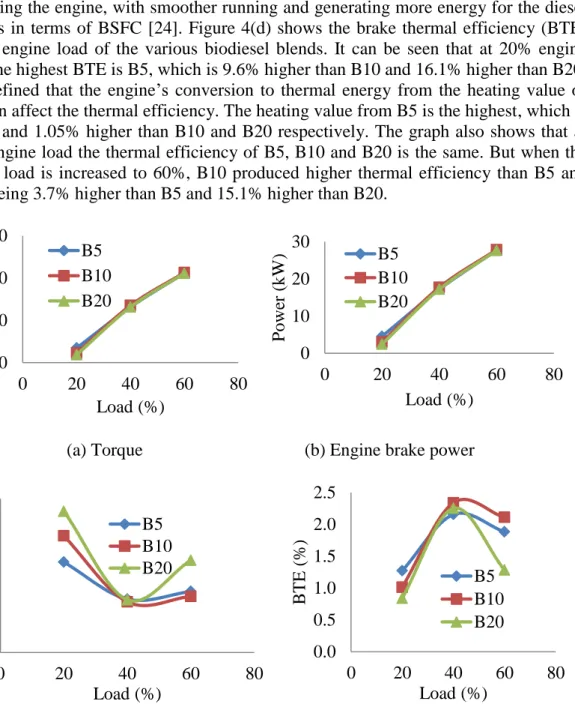
Figure 4(a) presents the variation of torque with engine loading and fuel blends.
It is observed that the torque increases with increase of engine loading. However, there
is no noticeable difference between the fuel blends. However, for other blends the
measured engine torque is lower than that of B5 fuel. The torque delivered with B5 fuel
was higher on average than the torque delivered by B10 and B20 at 20% of engine load.
Figure 4(b) shows the brake power against biodiesel blends and engine loading. The
engine was running at a constant speed of 2500 rpm. As can be seen, B5 produces more
power than B10 and B20 at 20% of engine load. It is observed that engine power
increases with increase of engine loading. However, there are no noticeable differences
of engine power between the fuel blends. Figure 4(c) represents brake specific fuel
consumption (BSFC) versus engine load among the biodiesel blends. When the engine
is 20% loaded, it is observed that B5 has the best BSFC due to having a higher heating
value compared to B10 and B20. Besides, B5 also has low density and kinematic
viscosity fuel properties, which contribute to lower fuel consumption, and even to
maintaining brake power at a constant speed. Although B5 is the best BSFC, at 40% of
engine load it is observed that all the biodiesel blends are the same. Furthermore, B10 at
60% engine load is the lowest compared with B5 and B20. Even though increased
POME in the blends leads to high density, kinematic viscosity and flash point, the
2338
properties of the biodiesel fuel, including lubricity and high oxygen content could be
protecting the engine, with smoother running and generating more energy for the diesel
engines in terms of BSFC [24]. Figure 4(d) shows the brake thermal efficiency (BTE)
versus engine load of the various biodiesel blends. It can be seen that at 20% engine
load, the highest BTE is B5, which is 9.6% higher than B10 and 16.1% higher than B20.
It is defined that the engine’s conversion to thermal energy from the heating value of
fuel can affect the thermal efficiency. The heating value from B5 is the highest, which is
0.96% and 1.05% higher than B10 and B20 respectively. The graph also shows that at
40% engine load the thermal efficiency of B5, B10 and B20 is the same. But when the
engine load is increased to 60%, B10 produced higher thermal efficiency than B5 and
B20, being 3.7% higher than B5 and 15.1% higher than B20.
(a) Torque (b) Engine brake power
(c) Brake specific fuel consumption (d) Brake thermal efficiency
Figure 4. Comparison between the engine performance of biodiesel blends.
Figure 5 presents the variation of brake mean effective pressure (BMEP) against
engine loading conditions. It can be observed that BMEP increases with increase of
engine load and there is no significant variation among the mixture blends (B5, B10 and
B20) at the 60% engine loading condition. Unfortunately, at 20% engine loading it is
observed that BMEP decreases among the blend mixtures, where B5 is 20.32 bar, B10
is 18.03 bar and lastly B20 is 14.67 bar. A similar result was reported by [25], who
compared diesel and sunflower biodiesel blend, where a 5– 10% power reduction was
due to the lower heating value of the biodiesel fuel.
0
50
100
150
0
20
40
60
80
T
orque
(N
m)
Load (%)
B5
B10
B20
0
10
20
30
0
20
40
60
80
P
owe
r (
kW
)
Load (%)
B5
B10
B20
0
2
4
6
8
10
0
20
40
60
80
B
S
F
C
(kg
/kW
.h)
Load (%)
B5
B10
B20
0.0
0.5
1.0
1.5
2.0
2.5
0
20
40
60
80
B
TE
(%
)
Load (%)
B5
B10
B20
2339
Figure 5. Variation of pressure with engine load.
Figure 6. Variation of in-cylinder pressure versus crank angle (degrees).
Figure 6 presents the in-cylinder pressure against crank angle in degrees for
various fuel blends. It can be observed that B10 achieved the highest pressure compared
to the others at an engine speed of 2500 rpm and crank angle of 26º. The lack of
atomization of the biodiesel fuel injection spray in B20 can decrease the combustion
pressure. The higher the density and kinematic viscosity produced, the harder it is for
the fuel to be converted to spray in the combustion chamber of a diesel engine. The
same result was found when comparing pure waste-oil biodiesel and diesel fuel, where
the reported torque loss was about 3% to 5% with the biodiesel fuels. This is because
the higher viscosity of biodiesel affected the power and engine brake effective power
due to the surface tension of biodiesel, which prevents sufficient atom vaporization
during the injection process [26]. B10 achieved the highest pressure due to the high
oxygen content in the biodiesel molecules, bringing an increased rate of combustion,
peak temperature and pressure. The short ignition delay period, high cetane number and
high viscosity lead the biodiesel to the maximum position of peak pressure towards the
top dead center (TDC) after a short period of expansion stroke [27].
0
50
100
150
200
0
20
40
60
80
B
MEP
(kPa)
Load (%)
B5
B10
B20
-5
5
15
25
35
45
55
65
-360-320-280-240-200-160-120 -80 -40 0
40 80 120 160 200 240 280 320 360
P
re
ssure
(ba
r)
Crank angle (ºCA)
B5
B10
B20
2340
Figure 7 shows that heat release occurred starting at the crank angle of -90º and
reached the optimum 100% of heat release at the 90º engine crank angle. It can be
observed that the B10 heat release line trend suddenly increased compared with B5 and
B20. B5 and B20 have similar heat release results occurring after the combustion phase.
The heat release can affect aspects of the engine performance such as pressure
cylinder and thermal efficiency, as it is proportional to both thermal efficiency and
cylinder pressure. The heat release can produce more heat, affecting the pressure
in-cylinder when combustion occurs, and this could generate more torque and thus produce
more powerful brake power in the diesel engine. Similar conclusions were reached by
[28], that heat release from crude sunflower-oil is higher than with diesel fuels because
combustion of the diesel fuel started earlier than crude sunflower-oil and the diesel fuels
produced a shorter ignition delay period.
Figure 7. Variation of heat release versus crank angle (degrees).
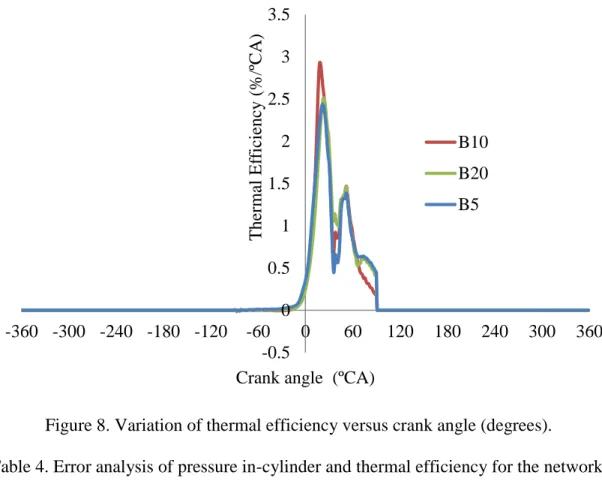
Figure 8 shows that B10 has higher thermal efficiency than B5 and B20. At an
engine load of 40% with 2500 rpm in constant speed, the heat release from B10 is the
highest compared to B5 and B20. Thus, thermal efficiency over crank angle for B10 can
give the optimum biodiesel fuel performance. When comparing the fuel consumption, it
can be proved that the higher the thermal efficiency of the biodiesel generated, the
higher the fuel consumption efficiency. Even though B10 has moderate values of
density, kinematic viscosity and heating, the experiment shows that B10 is the optimum
fuel compared to the other biodiesels. According to [24], the improvement in brake
thermal efficiency was obtained by the increasing content of biodiesel fuel with the 10%
and 20% blends. This is because increasing the biodiesel content also increases the
lubricity contained in biodiesel.
-20
0
20
40
60
80
100
120
-360 -300 -240 -180 -120
-60
0
60
120
180
240
300
360
H
ea
t
re
le
ase
(
%
)
Crank angle (ºCA)
B5
B10
B20
2341
Figure 8. Variation of thermal efficiency versus crank angle (degrees).
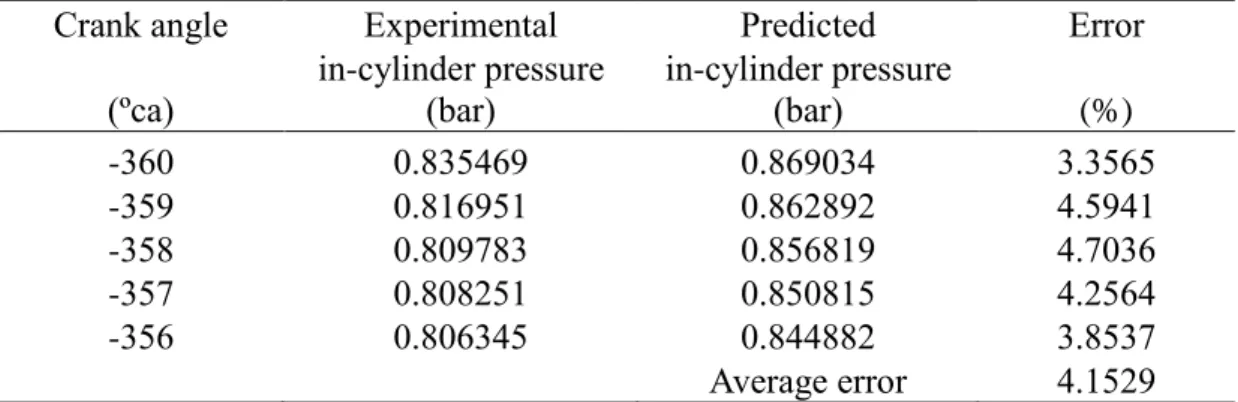
Table 4. Error analysis of pressure in-cylinder and thermal efficiency for the network.
Best Network
Training
(a)
Iteration
68
Network error
0.000268
Error improvement
9.74
× 10
−9(b)
Pressure in-cylinder
Target
Output
AE
ARE
Mean
4.729599
4.733764
0.271206
0.473278
Std dev
7.817052
7.740119
0.28072
10.04117
Min
-0.05744
0.192107
0.000037
0.000018
Max
45.80025
42.94433
3.282978
1007.13
Correlation
0.999949
R-squared
0.999894
(c)
Thermal efficiency
Target
Output
AE
ARE
Mean
0.072676
0.045581
0.040116
5.31
× 10
−16Std dev
0.253665
0.259151
0.030342
4.06
× 10
−16Min
-0.05289
-0.05289
0.00001
0.000514
Max
1.714909
1.614221
0.516145
2.04
× 10
−16Correlation
0.98657
R-squared
0.96233
-0.5
0
0.5
1
1.5
2
2.5
3
3.5
-360 -300 -240 -180 -120
-60
0
60
120
180
240
300
360
The
rma
l
Ef
fic
ienc
y
(%
/ºC
A)
Crank angle (ºCA)
B10
B20
B5
2342
The ANN was tested against output data for pressure in-cylinder and thermal
efficiency and results utilized the Levenberg–Marquardt training algorithm, which was
evaluated against about 18 cycles of the diesel engine. After 68 iterations, the network
error between the target and output is 0.000268 and the training is stopped. Table 4(a)
represents the error analysis between the target and output of the ANN models. The
error of output generated using the ANN in terms of pressure in-cylinder and thermal
efficiency is shown in Table 4(b) and (c). It is observed that the accuracy of the pressure
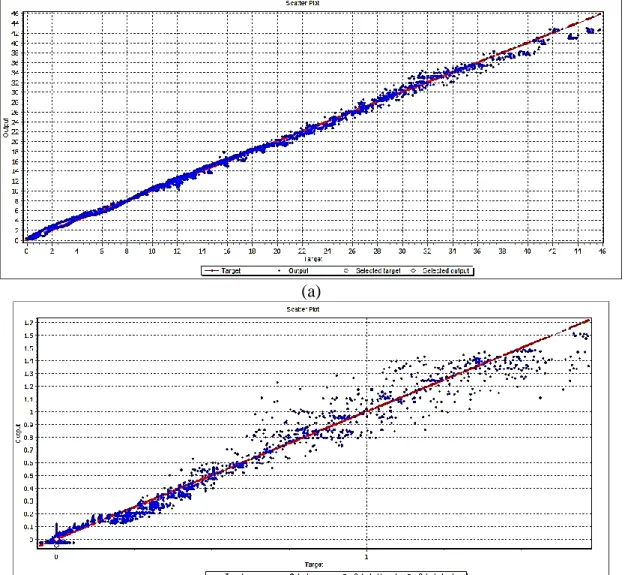
in-cylinder and thermal efficiency is 99.9894% and 96.233% respectively. In order to
make sure that the target and output are acceptable, Figure 9 shows the scatter plot
between the pressure in-cylinder and thermal efficiency respectively. It can be seen that
it is mostly scattered near the perfect correlation line for both pressure in-cylinder and
thermal efficiency.
(a)
(b)
Figure 9. Scatter plot
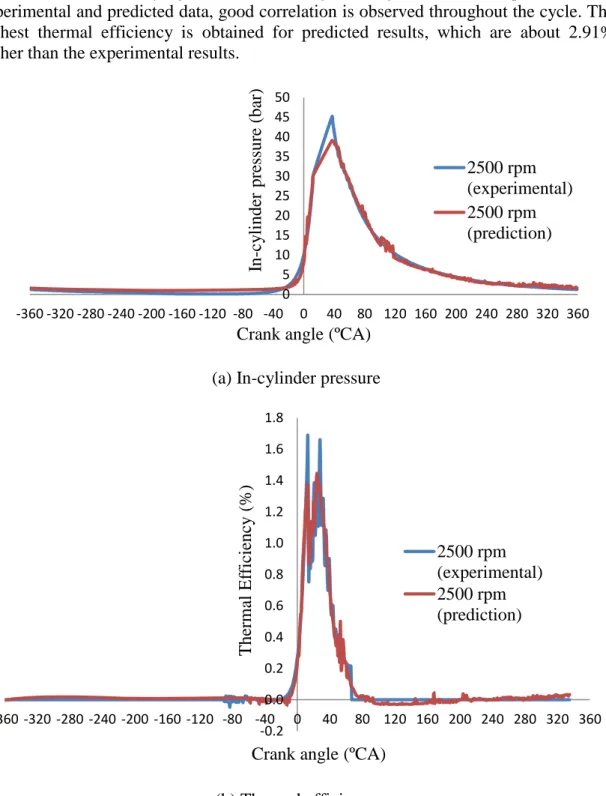
In Figure 10(a), the prediction using ANN models shows that the highest
pressure obtained by the experimental data is 45.28 bar and the lowest is 39.27 bar for
predicted data. Both the experimental and predicted data were run at 2500 rpm engine
speed. It can be concluded that the ANN models can predict different engine speeds
2343
according to the crank angle of the diesel engine. Figure 10(b) represents the variation
of the thermal efficiency against the crank angle in degrees. From comparison of the
experimental and predicted data, good correlation is observed throughout the cycle. The
highest thermal efficiency is obtained for predicted results, which are about 2.91%
higher than the experimental results.
(a) In-cylinder pressure
(b) Thermal efficiency
Figure 10. Comparison between prediction and experimental data for in-cylinder
pressure and thermal efficiency.
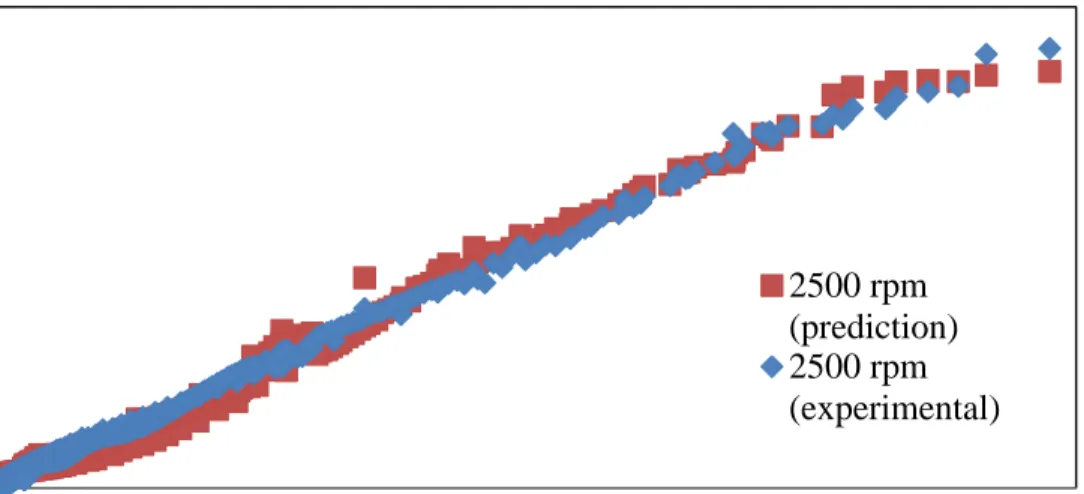
Comparison between the experimental data and the ANN predicted results
showed slight differences in values. Figure 11 shows the scatter plot of pressure
in-cylinder and thermal efficiency between the predicted and experimental results. It can
be seen that the scattered results are well distributed. The experimental results and the
0 5 10 15 20 25 30 35 40 45 50 -360 -320 -280 -240 -200 -160 -120 -80 -40 0 40 80 120 160 200 240 280 320 360