ANNUAL REPORT
2009
enTra’S enVIronMenTaL poLICy MuST STarT By
DeVeLopInG anD eDuCaTInG our own orGanISaTIon.
about entra eiendom 05
Ceo’s statement 06
organisational chart/the management group 08
2009 highlights 10
project development 12
Directors’ report 15
key fi gures and fi nancial information 22
market development 28
our property portfolio 33
about our properties 39
corporate governance 43
corporate social responsibility 48
ifrs consolidated fi nancial statements 66
notes 69
annual fi nancial statements 116
notes 122
declaration by the board of directors and Ceo 133 entra eiendom’s board of directors 134
auditor’s report 135
fi nancial calendar 136
addresses 137
CONTENTS
From Entras headquarter in Biskop Gunnerus gate 14 A, Oslo
proFITaBLe MeaSureS HaVe reDuCeD THe
annuaL enerGy ConSuMpTIon oF enTra’S
BuILDInGS By approX. 19 GwH aS oF 2009.
THaT IS equIVaLenT To aLMoST Two year’S
enerGy ConSuMpTIon aT poSTHuSeT In oSLo.
Posthuset, Biskop Gunnerus gate 14, Oslo
-19
GWh
Entra Eiendom is owned by the Norwegian state. It is administered through the Ministry of Trade and Industry. The company has a required rate of return equivalent to that of private property companies.
The company was founded on 1 July 2000, as a result of a parlia-mentary resolution to move the Statsbygg properties that operated in a competitive market into a separate company.
Entra has a head offi ce and four regional offi ces. The company’s head offi ce is situated in Oslo. The regional offi ces are located in Oslo, Bergen, Trondheim and Kristiansand.
Entra’s business concept is to add value by developing, leasing and ope-rating attractive and exceptionally environmentally friendly premises.
The company’s vision is to increase the effi ciency and enhance the reputation of its customers. The buildings it leases shall be environ-mentally effi cient, modern and fl exible, and shall make a positive con-tribution to their environments. Entra takes its corporate social respon-sibility seriously, and promotes good urban development.
entra’s values are: Focused Honest responsible ambitious entra’s slogan is: GooD HoSTS.
entra eiendom is a leading norwegian property company, which
has the primary objective of providing premises to cover the public
sector’s needs, whilst operating on commercial principles.
enTra eIenDoM aS
Key FIGureS aT 31 DeC. 2009 2008
property-related
Estimated market value (NOK millions) 20 249 19 165
Total gross fl oor space (BTA) 1 152 127 1 140 572
Floor space under management (BTA) 948 595 970 711
Occupancy rate for management portfolio 96.1 % 97.5 %
Weighted average remaining lease term (years) 9.8 10.1 financial
EBITDA 1 094.1 955.0
Management income 541.6 415.9
Comprehensive income for the year 744.8 -2 601.0
Total assets 21 343.4 20 091.3
Equity ratio 31 % 29 %
ABOUT
That was how Entra managed to deliver good fi nancial results in 2009. The strong fi gures refl ect both operational improvements and the fact that Norwegian property values rose over the course of the year. Entra’s employees added value, achieved our owner’s required rate of return and worked strategically to reduce the company’s exposure to risk. Entra is focusing hard on operational improvements.
During 2009 we honed our market strategy. Going forward, Entra will strengthen its position in the Oslo region, Bergen and Trondheim. Simultaneously we are actively looking for projects of strategic interest in other major Norwegian cities. Growth shall mainly be driven by offi ce blocks and cultural and educational buildings. The company will also pursue opportunities in the health sector.
The overall objective of Entra’s strategy is to reinforce the company’s future market position by becoming the environmental leader in its industry. At the close of 2009, Entra’s portfolio con-sisted of around one million square metres of leased premises, in addition to a signifi cant volume of properties under development. In 2009 Entra drew up a specifi c, binding environmental strategy. We apply stringent environmental standards to both the
refur-“Good hosts” is entra’s slogan, and it is the guiding principle
behind everything we do. It’s about looking after our customers,
the wider community and the environment. you do not become
good hosts from one day to the next; it requires hard, long-term
work. It requires competent and committed members of staff ,
wise investments and a desire to continuously improve.
aMBITIouS GoaLS
–GOOD
RESULTS
Ceo’S STaTeMenT:
bishment of existing buildings and the development of new builds. We cannot become the environmental leader in our industry by making bold claims; what it requires is long-term work and clear prioritisations. That takes time. But at Entra, what we care about are the results.
Report to parliament no. 29 on Entra Eiendom (2008– 2009) was discussed by the Storting (Norwegian parliament) in June 2009, and describes our shareholder’s ownership objec-tives. In the report, our owner emphasises that the company’s main objective is to provide premises to cover public sector needs, whilst operating on commercial principles. The report also reiterates the expectation that Entra shall be socially responsible; that fi nancial and ethical considerations shall go hand in hand throughout the company’s activities; that fea-tures of architectural and cultural value shall be managed pro-perly; and that the company has a responsibility to help make the building and construction industry more environmentally friendly. We are constantly striving to fulfi l those expectations.
Property markets are subject to rapid fl uctuations in prices, vacancy rates and, above all, investment. 2009 started with rising offi ce vacancies, falling rents and very few property
transactions. However, by the end of the year transaction numbers were increasing and there was cautious optimism in the rental market. Short-term market fl uctuations mean that we must take a long-term view, be willing to invest and manage risk carefully in all of our activities. During the tur-bulent period that we have just put behind us, Entra’s portfolio of relatively long and secure leases performed fairly well.
Entra does not just focus on buildings, it also cares about the people in them. Our buildings can facilitate good, creative working environments. We strive to increase our customers’ effi ciency and enhance their reputations. We want to become the environmental leader in our industry. And we want to fulfi l the high expectations of our customers and owner in terms of corporate social responsibility. The results we achieved in 2009 demonstrate that Entra is ready to meet these challenges and to continue growing.
Th e overall objective of entra’s strategy is to reinforce the company’s future market position by becoming the environmental leader in its industry.
Kyrre olaf Johansen Chief executive offi cer
THe oVeraLL oBJeCTIVe oF enTra’S STraTeGy IS To
reInForCe THe CoMpany’S FuTure MarKeT poSITIon By
BeCoMInG THe enVIronMenTaL LeaDer In ITS InDuSTry.
From left: Nils Fredrik Skau, Sverre Vågan, Kyrre Olaf Johansen, Ingrid Schiefloe, Rune Olsø, Anders Hernæs, Bjørn Holm and Torodd Bøystad.
DIreCTor oF proJeCTS anD DeVeLopMenT Bjørn Holm DIreCTor oF MarKeTInG anders Solaas (takes up position in 2010) TeCHnICaL DIreCTor
nils Fredrik Skau
CFo
anders Hernæs (acting)
VICe Ceo
Torodd Bøystad
DIreCTor oF HuMan reSourCeS
Sverre Vågan
DIreCTor oF STraTeGy anD BuSIneSS DeVeLopMenT
rune olsø
DIreCTor oF CoMMunICaTIonS anD SoCIaL reSponSIBILITy
Ingrid Schiefl oe CHIeF eXeCuTIVe oFFICer
Kyrre olaf Johansen
THe ManaGeMenT
GROUP
organisational structure – entra eiendom
New police statioN iN Bærum
The new police station at Kjørbo in Bærum was officially opened. The property was developed in close cooperation with the Asker and Bærum Police District. The new police station combines an existing office block that has been refurbished with a brand new, specially designed building housing police cells, a shooting range and a control centre.
BergeN property fully leased
Norconsult and the Consumer Council of Norway moved into Valkenddorfsgate 6 in Bergen. The Norwegian Welfare and Labour Organisation (NAV) signed a lease for pre-mises in the same building. This means that the building is fully leased.
eNtra oN the move
Entra’s Central and Northern Norway office moved into Brattørkaia 17 B in Trondheim, and PricewaterhouseCoopers signed a lease for 2,000 square metres in the same building.
New premises iN stavaNger
State-owned Electronic Chart Centre AS moved into totally refurbished offices at Lerviks-veien 32 in Stavanger.
coNstructioN starts iN stavaNger
The Mayor of Stavanger, Leif Johan Sevland, broke ground on the con-struction and refurbishment project at Professor Olav Hanssens vei in Stavanger.
report to parliameNt oN eNtra
Report to parliament no. 29 on Entra Eiendom was discussed by the Storting. The report states that Entra’s main objective is to provide pre-mises for the public sector, whilst operating on commercial principles. It contains no specific guidelines on how much space the company can lease to the private sector.
purchase aNd sale iN hamar
Entra bought and then sold on Parkgata 36, Statens Hus, in Hamar. The property was purchased from Nordea Liv Norge and sold on to UP Entra AS, which is owned by Entra Eiendom AS (50 percent) and Utstillingsplassen Eiendom AS (50 percent).
collocatioN iN stavaNger
Stavanger City Council moved into Nytorget 1. The National Youth Club Organisation collo-cated its activities in Stavanger.
electric car fleet
Entra acquired 15 electric cars in collaboration with Move About, which can be rented by tenants in three selected buildings in Oslo and Entra employees.
HIGHLIGHTS
2009
complete refurBishmeNt iN tøyeN
Hagegata 22 in Tøyen in Oslo was fully refurbished. This approx. 11,000 square metre office block, constructed in 1976, consists of 11 floors above ground and two basement levels. The property forms part of the Tøyen Senter shopping district. A lease was signed with NAV for the first six floors of the building.
eNtra sold:
Øvre Slottsgate 2 B in Oslo Storgata 162 in Porsgrunn The company cabin in Kragerø
eNtra sigNed sales coNtracts for: Grini Næringspark 13/14 in Bærum
eNtra eieNdom accepted Bids oN: Jeløgata 2 in Moss
Holbergsgate 6 in Skien
Jernbanegata 4 in Mysen (sections) Tollbugata 1 in Sandefjord Løkkebakken 20 in Kragerø the Nav peNsioN service moves
to porsgruNN
The NAV pension service moved into new premises in Sverres gate 20 in Porsgrunn. 2,500 square metres were totally refurbished.
stateNs hus iN moss haNded over
The converted and refurbished premises at Statens Hus in Vogts gate 17 in Moss were completed and handed over to the tenants. Tax Region East has started using the new premises. The other tenants are the County Governor of Østfold and the Office of the Auditor General of Norway. The property is fully leased.
liNkiNg Bjørvika aNd gamle oslo
Bjørvika Utvikling AS, in which Entra holds an ownership interest through Oslo S Utvikling AS, started building a footbridge over the tracks at Oslo Central Station. The bridge will connect the district of Gamle Oslo to the new seafront at Bjørvika.
refurBishmeNt iN pilestredet
Entra returned the fully refurbished “Blitz” house in Pilestredet 30C to the City of Oslo. The refurbishment of the historic buildings at Pilestredet 30 A, B and C was completed. The facades of the buildings and the flat where the painter Edvard Munch lived as a child are of great historic value, so the work was done in close consultation with the Cultural Heritage Management Office in Oslo.
oslo Z
In Oslo, work progressed on the new offi ce block behind the customs house in Schweigaards gate 15, right adjacent to the tracks at Oslo Central Station. The inter-esting design of the building has led to it being called Oslo Z. The building has seven fl oors above ground level, comprising approx. 15,000 square metres of total fl oor space. It is ideally located in relation to the new foot and cycle bridge across the railway tracks, as one end of the bridge is integrated into the building. The tenants are the police and The Norwegian Directorate for Education and Training, who both moved in at the turn of the year 2009/2010.
Valkendorfsgate 6 in Bergen
In Bergen, a major refurbishment project is underway at Valkendorfsgt. 6. This approx. 13,500 square metre property is being completed in stages for the various tenants. Tenants include Norconsult, NAV, the Consumer Council of Norway, Gulating Court of Appeal and the Norwegian International Ship Register. The whole project is due for completion in spring 2010.
professor olav Hanssens vei 10 in Stavanger
In Stavanger, work has started at Professor Olav Hanssens vei 10 on a 13,500 square metre new build and the refurbishment of a further approx. 22,500 square metres. The existing buildings include an administration block built in 1986 and extended in 1997, as well as a separate warehouse for storing rock cores. The biggest tenants are the Norwegian Petroleum Directorate and the Petroleum Safety Authority Norway, who will remain in the property during the construction phase. When completed in 2012, the property will have approx. 36,000 square metres of fl oor space.
Middelthuns gate 29 in oslo
Work has started on the total refurbishment of Middelthuns gate 29 in Oslo, which is due for completion in May 2011. The tenant, the Norwegian Water Resources and Energy Directorate, has temporarily moved out. The property has approx. 21,000 square metres of fl oor space.
DeVeLopMenT
Developing new and existing properties is what enables
entra to add value. ongoing development projects in 2009:
PROJECT
enTra IS FoCuSInG on BuILDInGS
CLoSe To puBLIC TranSporT LInKS.
Oslo Z, Schweigaards gate 15, Oslo
THe aVeraGe enerGy ConSuMpTIon oF enTra’S BuILDInGS
SHaLL Be LeSS THan 200 KwH per Square MeTre By 2012.
Vøyenenga skole, Borgenveien 1–3, Bærum
<200
kWh
ENTRA’S ACTIVITIES IN 2009
Entra’s main objective is to provide premises for the public sector, whilst operating on commercial principles in line with those of private companies in the industry. The company has both public and private sector customers, occupying several types of properties. Its properties are mostly located in Oslo, Trondheim, Bergen, Sta-vanger and Kristiansand, with the main focus being on Oslo and Eastern Norway. The largest customer group is the public sector, which makes up 80 percent of the company’s tenants.
At the close of 2009, the Group managed 1,056,867 square metres spread across 123 properties, including ten properties under development.
The transaction market was weak in the fi rst half of the year, but improved slightly in the second half. Transactions in the offi ce property market reached their lowest level since 2002. The slow market in the fi rst half of the year had little impact on the company’s activities. In line with our new market strategy, we have initiated the sale of several smaller properties that no longer fall within the Group’s main area of focus. There is strong interest for several of these properties, and we are making satisfactory progress with the sales process.
entra eiendom aS and the entra eiendom Group are engaged
in the letting, management, operation, sale, purchase and
development of real estate in norway. entra eiendom has its
head offi
ce in oslo, and four regional offi
ces located in oslo,
Kristiansand, Bergen and Trondheim.
annuaL STaTeMenT
DIRECTORS’
Investments in development projects and the completion of new premises fell from NOK 1,384 million in 2008 to NOK 922.6 million in 2009.
The following major (refurbishment) projects were completed in 2009:
• Pilestredet 30 A-C
• Upgrade to the National Library of Norway’s underground storeroom in Oslo
• Police station for Asker and Bærum • NAV pension service in Porsgrunn • Statens Hus in Moss
In 2009, Entra Eiendom started work on a refurbishment and new build project at Professor Olav Hanssens vei 10 in Sta-vanger, as well as the refurbishment of Hagegata 22 and Mid-delthuns gate 29 in Oslo. The new Oslo Z building and the refurbishment of Valkendorfsgate 6 in Bergen started in 2008 and will be completed in 2010. The company has decided to start work on a new build at Pilestredet 28 in Oslo and on the refurbishment and new build project at Malmskriverveien 4 in Bærum.
Activity in the office rental market in Oslo slowed for a second consecutive year. In 2009, rental market activity also slowed in the other cities where the company is located. The rental market picked up slightly towards the end of the year, reflecting a general improvement in the Norwegian economy. Office vacancy levels rose fastest during the first half of the year, but were still rising at the start of 2010. The company’s tenants needed additional space in 2009, which helped to limit the rise in the company’s vacancy rates.
Entra had an occupancy rate of 96.1 percent at the end of 2009, down from 97.5 percent in 2008.
One of Entra’s most important goals is to have satisfied customers. That increases stability and allows the efficient management of the company’s properties. In 2009, 82 percent of the company’s tenants responded to its customer satis-faction survey. 95 percent of customers responded that they look favourably on leasing premises from Entra in the future, whilst 93 percent would recommend Entra to others.
On account of its corporate social responsibility and the obligations that come with being a major player in the property market, Entra continued to focus on good urban development. The projects at Brattørkaia in Trondheim and Bjørvika (through
Oslo S utvikling AS) are examples of this.
In 2009 Entra adopted an environmental strategy for the coming three years. The strategy includes a goal of Entra Eiendom becoming the environmental leader within its industry. The environmental strategy for 2010-2012 has been incorporated into the company’s vision, and also sets out spe-cific goals and strategic areas of focus. Entra Eiendom has set itself the goal of making its properties more eco-friendly. It is important to make our customers realise what we are doing for the environment and to ensure that our staff understand, and are committed to, best environmental practice. The environ-mental strategy shall be implemented through specific mea-sures and action plans. Becoming the market leader in this area will make us more competitive.
part-owned subsidiaries
Brattørkaia AS is developing the Brattørkaia area in Trondheim. The company currently has two properties under development, Brattørkaia 17b and Brattørkaia 14. Brattørkaia 14 will house Rockheim, the national pop & rock experience centre. The Ministry of Culture and Church Affairs is the tenant, and a modern museum will open in spring 2010.
Brattørkaia AS is pushing forward infrastructure improve-ments through Tverrforbindelsen AS. The company is owned by property owners and stakeholders in the area, including Entra Eiendom AS. (Tverrforbindelsen AS is described in greater detail in the section on associates)
Kristiansand Kunnskapspark Eiendom AS has been responsible for developing Sørlandet Science Park, which is located at Gimlemoen 19. The property is now fully up and running, housing a mixture of large tenants such as Agder Research, the publishing house Høyskoleforlaget and the Southern Norway Resource Centre, as well as a number of small businesses attracted by the innovation cluster.
Optimo AS completed the first construction phase at Brek-keveien, and has started selling the second phase of the same project. The company is also responsible for leasing, operating, converting and maintaining the former university college at Bekkestua in Bærum.
Papirbredden Eiendom AS owns the Drammen Science Park, which is mainly leased to higher education institu-tions and a library. The company also owns Union Scene, a modern cultural centre with stages, theatres and offices for the Drammen Municipality department of culture. 2009 is the first full year that both properties have been in full use.
The company also owns an adjacent site, with 18,000 square metres of development potential.
Joint ventures and associates
Entra Eiendom AS owns Krambugata 3 AS in Trondheim jointly with Utstillingsplassen AS and Langøya Invest AS. Choice Hotels is the tenant, which has completed its fi rst full year of operation. The hotel is reporting increasing turnover. Entra Eiendom has decided to sell its share in the company.
In 2009, Kunnskapsbyen Eiendom AS, which Entra Eiendom AS owns jointly with Campus Kjeller AS, Siva Eiendom Holding AS and some minor shareholders, rea-lised the value of the remaining development potential by selling a site at the Kjeller technology cluster. In addition, the company’s wholly-owned subsidiary Kjeller Senterbygg AS completed the construction of Kunnskapsbyens Hus at Kjeller. We have decided to also attempt to sell Kjeller Senterbygg AS. If the subsidiary is sold, Kunnskapsbyen Eiendom AS will not be doing much business, so in due course we will consider winding it up.
Oslo S Utvikling AS, which is owned by ROM Eiendom AS, Linstow AS and Entra Eiendom AS, is one of the major players in the development of Bjørvika. In the Opera Quarter, the company will build a total of approx. 200,000 square metres above ground and a joint cellar of approx. 75,000 square metres.
KLP’s head offi ce is due for completion on 1 April 2010. The sale of 53 fl ats in the top fl oors of the building started at the end of October, and by the turn of the year half of the fl ats had been sold.
The construction of the footbridge between Bjørvika and Schweigaardsgate is progressing well.
Work on the new head offi ce for the DnB NOR Group has started, and the fi rst of three buildings in total will be com-pleted in summer 2012. The remaining two buildings are due for completion at the end of 2012 and 2013 respectively. When the fi nal building is occupied in 2013, around 4,500 DnB NOR employees will have moved to Bjørvika.
The construction of the “Visma” building is going to plan, with completion due in April 2011. Construction of the cellar of the Snøhetta building has started. Phase II, which consists of approx. 70 fl ats, is currently being designed, with construction work expected to start this year and completion slated for the second half of 2012.
Tverrforbindelsen AS in Trondheim is working on the
bridge between Brattørkaia and the station area. The company’s task is to establish a blueprint for building the bridge and to agree the involvement of the various parties.
In 2009, Entra Eiendom acquired a 44 percent ownership interest in Ullandhaug Energi AS in Stavanger. The other investors are Ipark Eiendom and Iris. The company supplies hydronic heating and cooling to buildings in the local area using heat pumps and waste heat recovery. The company plans to dig geothermal wells. Entra’s ownership interest ensures access to green energy for Professor Olav Hanssens vei 10.
Entra owns UP Entra AS jointly with Utstillingsplassen AS. The company develops and manages a total of 87,400 square metres of property in the Hamar region. The company acquired Statens Hus in Hamar from Entra Eiendom AS in the fi rst quarter of 2009. The company owns properties directly and through subsidiaries and joint ventures, and in the fourth quarter it purchased 80 percent of the shares in Kongsvinger Kompetanse- og Næringssenter AS from Entra Eiendom AS and other shareholders.
Youngstorget Parkeringshus AS’s objective is to construct a public underground car park below Youngstorget in Oslo. Entra Eiendom is interested in the car park because it owns properties in the area between Youngstorget and Arbeider-samfunnets plass. The other shareholders in the company are OBOS forretningsbygg, Sparebank 1, Olav Thon and Gårdeier-gruppen Youngstorgetkvartalene.
INCOME STATEMENT AND BALANCE SHEET, FINANCIAL POSITION AND LIQUIDITY
General
The annual fi nancial statements have been fi led on the assumption of the business being a going concern. The Board’s assessment is that this is an accurate assumption. The company is in a healthy fi nancial position, and has strong liquidity.
Income statement and cash fl ow
The Group’s total operating revenues in 2009 were NOK 1,774.9 (1,350.8) million. Rental income in 2009 was NOK 1,452.6 (1,297.5) million. The increase in rental income was due to the completion of projects, including the new builds at Kjørbo, for the Asker and Bærum Police District, and at Brattørkaia 17 B in Trondheim, as well as the refurbishment of Cort Adelersgate 30 in Oslo and Valkendorfsgate 6 in Bergen. Rental income also increased due to the full year eff ect of projects that were completed in 2008, such as the Nonnester quarter in Bergen
and Akersgaten 51 in Oslo.
Operating profi t totalled NOK 1,084.3 (945.6) million. Operating expenses in 2009 totalled NOK 690.1 (407.5) million. The increase in operating expenses was mainly due to the completion of the abovementioned projects, as well as to expenses related to Optimo’s housing project in Brekkeveien.
Changes in the value of investment properties in 2009 totalled NOK 405.9 (-3,491.8) million. The increase in value was primarily due to a reduction in the required rate of return for properties with long, secure leases over the second half of the year. This was due to an improvement in fi nancial markets and greater activity in the transaction market. At 31 December 2009, the company’s net yield based on contractual rents was 6.7 percent (6.9 percent). Market rents fell sharply over the fi rst half of 2009, particularly in the upper segments of the market, but over the second half of the year they stabilised. This has par-ticularly aff ected the values of properties with short remaining lease terms. Overall, the company’s portfolio has a weighted average remaining term of 9.8 years, which helps limit its exposure the fall in market rents. The business risk associated with public sector tenants is considered to be low.
Net fi nancial items in 2009 totalled NOK -560.5 (-534.3) million. The Group’s share of profi t from associates and joint ventures totalled NOK 17.8 (4.5) million.
The Group’s profi t before taxation for 2009 was NOK 1,037.5 (-3,822.1) million. The tax expense for the year totalled NOK 290.8 million (income of NOK 1,222.5 million).
The Entra Eiendom Group’s profi t after taxation was NOK 746.7 (-2,599.6) million before minority interests, and NOK 631.2 (-2,573.7) million after minority interests.
The Group’s net cash fl ow from operating activities totalled NOK 536.5 (405.0) million. The increase over the previous year was mainly due to a NOK 65.2 million net change in trade receivables and payables. The increase in the Group’s operating income, which exceeded the increase in operating expenses, also helped to boost net cash fl ow from operating activities. Net cash fl ow from investment activities was NOK -990.4 (-1,395.4) million. The main investments in 2009 were the new build projects Oslo Z at Schweigaardsgate 15 B in Oslo and the police station for the Asker and Bærum Police District, the refurbishment of Valkendorfsgate 6 in Bergen, Hagegata 22 in Oslo and Rockheim at Brattørkaia 14 in Trondheim, as well as the refurbishment and extension of the Norwegian Petroleum Directorate’s premises at Professor Olav Hanssens vei 10 in Stavanger. Net cash fl ow from fi nancing activities
was NOK 503.2 (837.8) million in 2009. For 2009 this mainly relates to net new borrowing to fi nance ongoing projects. The net change in cash and cash equivalents for the year was NOK 49.3 (-152.6) million.
BALANCE SHEET AND EQUITY
The Group’s book assets at the close of the year totalled NOK 21,343.4 (20,091.3) million. The book value of the Group’s investment properties and investment properties held for sale rose by NOK 2,622.8 million in 2009. Of the increase, NOK 1,520.4 million was due to the reclassifi cation of the previous year’s development properties to investment properties (in line with the rule change in IAS 40). Investment properties are measured at fair value, based on the average of two external, independent valuations. The Group’s nominal interest-bearing debt increased by NOK 396.0 million in 2009.
The Group’s equity at 31 December 2009 was NOK 6,608.7 (5,854.5) million, equivalent to an equity ratio of 31.0 (29.1) percent. The Board considers the Group’s fi nancial position to be satisfactory.
FINANCING AND LIQUIDITY – FINANCIAL RISK
Financial markets improved signifi cantly in 2009. Unem-ployment growth slowed, and the economy is showing signs of improvement after a period of weakness.
The extremely high fi nancial market risk premiums at the start of the year fell over the course of the summer, and markets were almost back to normal at the close of the year.
The improvement in fi nancial markets over the year improved access to capital at a lower cost. By renegotiation its loans, the company also achieved greater room for manoeuvre in relation to its loan covenants. Overall, this has helped to reduce the company’s refi nancing/liquidity risk.
The Group’s liquid assets, including liquid fi nancial invest- ments, totalled NOK 229.8 million (NOK 204.1 million) at 31 December 2009. In addition, the company had available, undrawn credit facilities with Norwegian banks totalling NOK 5.0 billion (NOK 3.2 billion).
Entra Eiendom is fi nanced through a variety of bank and capital market instruments. By issuing new bonds in the fourth quarter, the company has refi nancing in place for all loans due for payment in 2010. The company’s loan portfolio has a balanced maturity structure.
The management of fi nancing activities is regulated through agreed frameworks in the fi nance strategy and fi nance policy.
A constant evaluation is made of the company’s financial fram-eworks in relation to its other activities. The average interest rate payable on the company’s loans has fallen as a result of falling market interest rates and the company’s responses to the market. The Board considers that the risks associated with the company’s financial exposure fell through 2009.
The company’s interest rate risk is managed in line with a stated finance policy, within a framework that covers the average duration and hedging within various time intervals. The average interest rate on the Group’s portfolio of loans and debt instruments was 5.2 (5.8) percent per annum at 31 December 2009. 69 percent of the Group’s total interest-bearing debt was subject to a fixed interest rate at 31 December 2009. The weighted average duration (fixed interest period) was 4.2 years.
Entra Eiendom shall not take on currency risk, and at the close of the year the company had no such exposure.
Our high proportion of public sector tenants means that credit and counterparty risk are limited. For other customers, credit checks are carried out. Any financial weakness at customers is compensated for through adequate collateral being provided.
The Group’s liabilities at 31 December 2009 totalled NOK 14,734.7 (14,236.9) million. The Group’s nominal interest-bearing debt on that date totalled NOK 11,883.0 (11,487) million, equivalent to 55.7 percent (57.2 percent) of total equity.
PROFIT FOR THE YEAR AND ALLOCATIONS
In 2009 Entra Eiendom AS made a profit after taxation of NOK 68.4 (446.8) million, as set out in the financial statements pre-sented under the Norwegian Accounting Act and Norwegian generally accepted accounting principles.
The Board proposes that Entra Eiendom AS’s profit for the year be allocated as follows:
Transferred from other reserves NOK million -46,1 Proposed dividend NOK million 114,5 The company’s distributable reserves totalled NOK 553.2 million at 31 December 2009.
SHAREHOLDER INFORMATION
The Norwegian Government, through the Ministry of Trade and Industry, owns 100 percent of the company’s shares.
CORPORATE GOVERNANCE
Corporate governance at Entra is based on the principles set out in the Norwegian Code of Practice for Corporate Gover-nance.
Over the course of the year, seven Board meetings were held to discuss matters such as the strategy and development of the Group. There were no changes to the composition of the Board in 2009.
The Group has established a set of values and ethical gui-delines that underpin its operations. Our strategy and overall objectives set out our ambitions, strategic choices and long-term goals. Guidelines, procedures and authorisation struc-tures have been drawn up to support and operationalise the strategy and the overall objectives.
For further details, please see the separate chapter on “Corporate governance” in the company’s annual report.
REPORT TO PARLIAMENT ON ENTRA EIENDOM AS
Report to parliament no. 29 (2008–2009) on Entra Eiendom AS was discussed by the Storting on 4 June 2009. The report and parliament’s resolution describe the owner’s expectations for the company.
WORKING ENVIRONMENT AND STAFF
At the close of 2009, the Group had 167 employees, equivalent to 166.2 full-time equivalents, seven more than at the end of 2008.
Staff turnover at the Group was 5.4 percent in 2009, 4.9 percent lower than in 2008. Adjusted for natural wastage (reti-rement), turnover was 4.8 percent. At the parent company Entra Eiendom AS, turnover was six percent in 2009.
Sickness absence at Entra Eiendom AS was 3.78 percent in 2009, 0.32 percent less than in 2008.
In 2009 Entra Eiendom participated in the staff survey “Great Place to Work”. The survey makes it possible to compare staff satisfaction at the company with other enterprises. Entra Eiendom came out roughly average amongst the participants in the survey. The company aims to do better than that, and improvement measures have been implemented.
There were no occupational accidents that resulted in serious injuries in 2009.
Cooperation with employee organisations was good and constructive during 2009, and made a positive contribution to the running of the company.
EQUAL OPPORTUNITY AND DIVERSITY
In 2009, 24.8 (26.4) percent of Entra Eiendom’s employees were women. Roughly 60 percent of the positions at the company are related to operating the company’s properties, an area where there are usually very few female applicants. We are working to increase the number of women even in this part of our business. 45 percent of the company’s administrative staff are women. Entra Eiendom aims to increase the proportion of jobs at the company held by women. This goal has been incor-porated into recruitment procedures.
Two of the Board’s five shareholder representatives, i.e. 40 percent, are women. One of the two employee representatives on the Board is a woman.
At Entra Eiendom, working time arrangements are the same for both genders, and there is no discrimination in terms of pay and working conditions. Employee benefits, such as flexitime and full pay during sickness and pregnancy, are important planks of our equal opportunity policy.
In 2002 the company signed an inclusive working life agre-ement. Its main focus is on reducing sickness absence and increasing the average retirement age. The company has drawn up a separate policy on older workers, which includes specific measures for their benefit. None of the nine employees who were entitled to retire in 2009 did so.
The company promotes diversity, which includes wanting to recruit more staff from ethnic minorities. This aim has been incorporated into the company’s recruitment procedures, and all qualified applicants from ethnic minorities are invited to an interview. The company’s recruitment drives encourage all qualified candidates to apply, regardless of age, gender, disa-bility or ethnic background.
2.2 percent of the workforce at Entra works part-time, and 33 percent of part-time staff are women.
THE COMPANY’S IMPACT ON THE ENVIRONMENT
Entra Eiendom wants its properties to have as little impact as possible on the environment and to help ensure that resources are used efficiently.
Analyses are carried out for all investments to identify the optimal solution in relation to environmental impact, inves-tment, operation and maintenance. Construction materials are reused wherever possible, and the company aims to use eco-fri-endly materials. Heating is largely provided by hydronic systems, linked to district and local heating. Hydronic heating systems are very flexible in terms of the primary energy source you use.
Entra Eiendom communicates openly with relevant stake-holders in order to minimise the negative impacts on our sur-roundings from the noise, waste and pollution caused by con-struction projects.
For all new builds, conversions and maintenance pro-jects, measures are taken to reduce energy consumption and to maximise recycling. As part of the Group’s environmental policy, a web-based system has been introduced to measure energy consumption, waste and water consumption at our buildings.
enoVa projects
Four ENOVA projects initiated in 2006 and 2007 were still going in 2009. In total, 773,000 square metres of floor space in the company’s properties are covered by energy efficiency pro-jects supported by ENOVA. According to ENOVA’s building sta-tistics, Entra Eiendom’s energy consumption is below average. The aim of the ENOVA projects is to reduce energy con-sumption at our buildings by approx. 19 GWh/year. For 2009, the energy saving achieved was 18.6 GWh/year.
Features of historic value
Features of historic value in the company’s buildings are care-fully looked after in line with current laws and regulations. When disposing of properties comprising buildings structed before 1950, the company follows the regulations con-tained in the fourth paragraph of section 2.1 of the “Order on the disposal of real estate belonging to the state, etc.” (Royal Decree of 19 December 1997).
FUTURE DEVELOPMENT
The market is cautiously optimistic. The Norwegian economy has emerged from the financial crisis in better shape than was feared at the start of 2009. In the autumn there were signs that growth was returning to the European and American econ-omies, after a sharp contraction from autumn 2008 into early 2009.
Rents have fallen less than was feared, and they remain at relatively high levels. The sharp slowdown in the global economy from autumn 2008 through early 2009 means that there is still a strong focus on risk. Banks went from being very restrictive in their lending for commercial property at the start of 2009 to being overwhelmingly positive towards the end of the year.
Employment is expected to continue falling in Norway at
the start of 2010, and the global economic recovery is fragile. High levels of government debt in several major economies, and the consequent need for fiscal tightening, is one of the biggest uncertainty factors. A need for fiscal tightening in Norway has also been expressed. For Entra it will be important to continue offering space and energy efficient premises.
Entra must retain the trust of its customers, owner, employees and of society as a whole. Focusing hard on com-prehensively meeting the company’s corporate social responsi-bilities, including its environmental goals, and on integrating them into the day-to-day operations and development of the company, should improve the future prospects of the company.
Market developments
The market was very nervous in the first half of 2009, leading to lower rental activity and falling rents. Rents fell most in the top segment of the market, and much less for properties with more normal rents. In spite of the slight fall in rents in 2009, the general level of rents is still higher than it was in 2007. This has helped improve the profitability of many property com-panies. The prospects for the labour market brightened over the second half of the year. Financial and macroeconomic risks have fallen. Employment is expected to continue falling in early 2010, but so far the impact has been limited in the indus-tries that typically lease a lot of office space. Office vacancy
rates are still rising, but are expected to peak in the first half of 2010. Rents will therefore remain under pressure, but they are not expected to change significantly. Demand for modern premises in attractive locations is expected to grow. Centrally located properties close to public transport hubs, with modern and flexible premises, which are efficient to run, will continue to have a competitive advantage in 2010.
Financial developments
Entra Eiendom’s equity ratio has improved, and the company has long-term external financing. Refinancing has been secured for all of the loans that mature in 2010, and the company has renegotiated its loan agreements to increase its financial fle-xibility.
The company is attempting to reduce financial risk by actively using various interest rate hedging instruments.
It is the Board’s view that Entra’s strong cash-flow and balance sheet give it a good financial platform. Entra will con-tinue to build on that platform to achieve profitable growth in line with the company’s strategy. The company is involved in several major development projects. Entra Eiendom continues to have a conservative financial risk profile.
The Board is of the opinion that the Group has laid good foundations for further growth and development.
Oslo, 26.03.2010
Grace Reksten Skaugen Chairman of the Board
Martin Mæland Vice-chairman of the Board
Ottar Brage Guttelvik Board member
Tore Benediktsen Board member (employee representative)
Gerd Kjellaug Berge
Board member Finn Berg JacobsenBoard member
Mari Fjærbu Åmdal Board member (employee representative)
Kyrre Olaf Johansen Chief executive officer
anD FInanCIaL InForMaTIon
KEY FIGURES
More THan 98 % oF THe properTIeS
LeaSeD By enTra are LInKeD To a
weB-BaSeD enerGy MonITorInG SySTeM.
From Entra's headquarter in Biskop Gunnerus gate 14 A, Oslo
>98 %
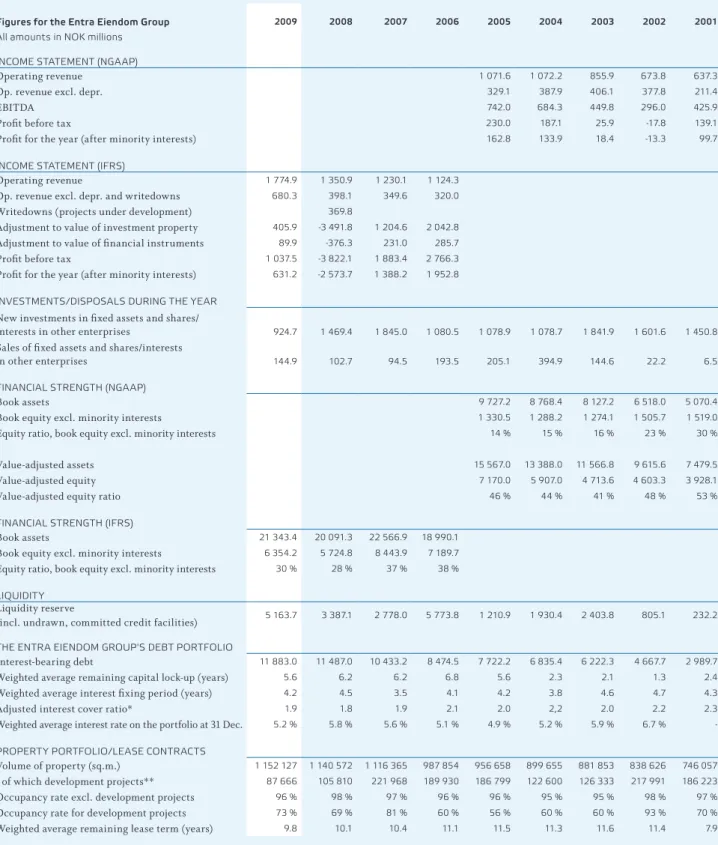
22 enTra annuaL reporT 2009figures for the entra eiendom group all amounts in noK millions
2009 2008 2007 2006 2005 2004 2003 2002 2001
InCoMe STaTeMenT (nGaap)
Operating revenue 1 071.6 1 072.2 855.9 673.8 637.3
Op. revenue excl. depr. 329.1 387.9 406.1 377.8 211.4
EBITDA 742.0 684.3 449.8 296.0 425.9
Profit before tax 230.0 187.1 25.9 -17.8 139.1
Profit for the year (after minority interests) 162.8 133.9 18.4 -13.3 99.7 InCoMe STaTeMenT (IFrS)
Operating revenue 1 774.9 1 350.9 1 230.1 1 124.3
Op. revenue excl. depr. and writedowns 680.3 398.1 349.6 320.0
Writedowns (projects under development) 369.8
Adjustment to value of investment property 405.9 -3 491.8 1 204.6 2 042.8
Adjustment to value of financial instruments 89.9 -376.3 231.0 285.7
Profit before tax 1 037.5 -3 822.1 1 883.4 2 766.3
Profit for the year (after minority interests) 631.2 -2 573.7 1 388.2 1 952.8 InVeSTMenTS/DISpoSaLS DurInG THe year
New investments in fixed assets and shares/
interests in other enterprises 924.7 1 469.4 1 845.0 1 080.5 1 078.9 1 078.7 1 841.9 1 601.6 1 450.8
Sales of fixed assets and shares/interests
in other enterprises 144.9 102.7 94.5 193.5 205.1 394.9 144.6 22.2 6.5 FInanCIaL STrenGTH (nGaap)
Book assets 9 727.2 8 768.4 8 127.2 6 518.0 5 070.4
Book equity excl. minority interests 1 330.5 1 288.2 1 274.1 1 505.7 1 519.0
Equity ratio, book equity excl. minority interests 14 % 15 % 16 % 23 % 30 %
Value-adjusted assets 15 567.0 13 388.0 11 566.8 9 615.6 7 479.5
Value-adjusted equity 7 170.0 5 907.0 4 713.6 4 603.3 3 928.1
Value-adjusted equity ratio 46 % 44 % 41 % 48 % 53 %
FInanCIaL STrenGTH (IFrS)
Book assets 21 343.4 20 091.3 22 566.9 18 990.1
Book equity excl. minority interests 6 354.2 5 724.8 8 443.9 7 189.7
Equity ratio, book equity excl. minority interests 30 % 28 % 37 % 38 % LIquIDITy
Liquidity reserve
(incl. undrawn, committed credit facilities) 5 163.7 3 387.1 2 778.0 5 773.8 1 210.9 1 930.4 2 403.8 805.1 232.2
THe enTra eIenDoM Group'S DeBT porTFoLIo
Interest-bearing debt 11 883.0 11 487.0 10 433.2 8 474.5 7 722.2 6 835.4 6 222.3 4 667.7 2 989.7
Weighted average remaining capital lock-up (years) 5.6 6.2 6.2 6.8 5.6 2.3 2.1 1.3 2.4
Weighted average interest fixing period (years) 4.2 4.5 3.5 4.1 4.2 3.8 4.6 4.7 4.3
Adjusted interest cover ratio* 1.9 1.8 1.9 2.1 2.0 2,2 2.0 2.2 2.3
Weighted average interest rate on the portfolio at 31 Dec. 5.2 % 5.8 % 5.6 % 5.1 % 4.9 % 5.2 % 5.9 % 6.7 % -properTy porTFoLIo/LeaSe ConTraCTS
Volume of property (sq.m.) 1 152 127 1 140 572 1 116 365 987 854 956 658 899 655 881 853 838 626 746 057
- of which development projects** 87 666 105 810 221 968 189 930 186 799 122 600 126 333 217 991 186 223
Occupancy rate excl. development projects 96 % 98 % 97 % 96 % 96 % 95 % 95 % 98 % 97 %
Occupancy rate for development projects 73 % 69 % 81 % 60 % 56 % 60 % 60 % 93 % 70 %
Weighted average remaining lease term (years) 9.8 10.1 10.4 11.1 11.5 11.3 11.6 11.4 7.9
From the financial year 2007 (with comparative figures for 2006), the Group started reporting its financial results under IFRS. The table shows key figures from the company’s income statement and figures relating to its financial strength for the period 2001–2005 under NGAAP and for 2006–2007 under IFRS. It should be noted that the value-adjusted equity for the period 2006–2007 (IFRS) represents the Group’s equity less tax liabilities on unrealised increases in the value of investment properties and financial instruments.
* The interest cover ratio is calculated with an adjustment for investment-related items:
Operating profit adjusted for provisions for future liabilities+depreciation+refurbishment costs+financial income
Interest expenses
** For the period 2001-2007 future development potential is included in the figure for development projects.
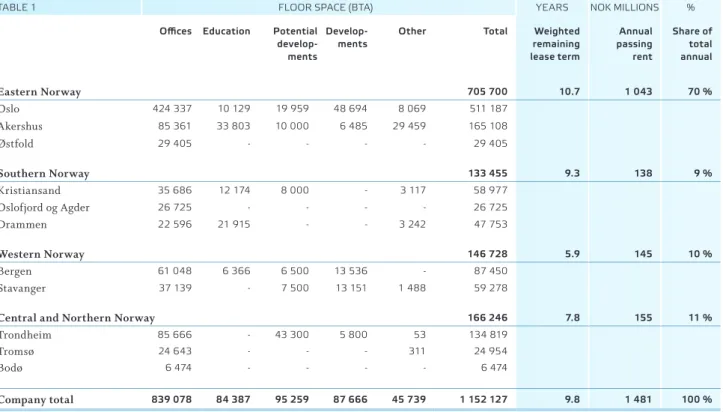
table 1
FINANCE
DEVELOPMENTS IN THE FINANCIAL MARKETS
2009 was a year marked by a turnaround in the global macro-economic situation. The financial crisis resulted in dramatic slowdown in the global economy in late 2008 and early 2009. As a result, central banks and governments introduced extensive monetary and fiscal stimulus measures in order to limit the contraction. Gradually the global economy started to recover, and by autumn 2009 most OECD economies had returned to growth, after four or five quarters of in some cases sharp falls in GDP.
The Norwegian economy experienced a downturn at the start of 2009. Mainland Norway’s GDP stopped falling in the second quarter, but growth remained significantly below trend throughout the rest of the year. After the second quarter, Nor-wegian household consumption grew strongly, making it an important factor in the Norwegian mainland economy’s turna-round from contraction to expansion. This growth in house-hold consumption is partly attributable to highly expansionary monetary and credit policy in the shape of low interest rates and liquidity injections into banks. Meanwhile, housing and business investment in mainland Norway, excluding public sector investment, fell throughout 2009.
FINANCIAL ACTIVITIES OVER THE COURSE OF THE YEAR
The Group’s finance strategy shall support the implementation of the adopted business strategies, with the main focus being on ensuring access to capital and managing the company’s financial risk. The aim is to minimise the Group’s finance costs, whilst ensuring the most appropriate capital structure to assist the future development of the company.
Entra Eiendom’s finance policy forms the overall framework for the Group’s financial management, and defines objectives, responsibilities and areas of authority for the handling of financial activities. The finance policy supports the company’s other commercial activities, and is revised annually.
The company’s financial risk management is also described in Note 3 to the consolidated accounts on page 80. The most important areas of the company’s financial risk management are handled separately:
refinancing risk
The company aims to limit its refinancing risk by diversifying its sources of capital and by operating within the following framework:
• A maximum of 30 percent of the company’s financing shall
mature within the next twelve months.
• Diversification between different types of borrowing instru-ments.
• Diversification between loan providers.
• Liquidity requirements for the coming 12 months shall be covered through committed credit facilities.
• Short-term financing through commercial paper shall be hedged with back stop facilities covering the volume which falls due within the next six months.
Financial markets are still affected by the uncertainty resulting from the credit crisis. Future long-term financing is expected to be more expensive than in the past, and this had some impact on our portfolio during 2009.
However, as a result of the measures to reduce refinancing risk described above, the Group is expected to achieve good financing terms, in view of the safe nature of its business.
Interest rate risk
The company’s strategy for positioning itself in relation to the interest rate markets reflects the fact that it has properties with a range of risk profiles and remaining lease terms. The company’s risk tolerance in terms of its financial activities is assessed on the basis of the overall business model and exposure, bearing in mind the strategy and structure of its indi-vidual investments. Along with the company’s current view of interest rates, it forms the basis for adjustments to the interest rate structure within the framework of the norm portfolio. The norm portfolio specifies that the weighted duration of the port-folio should be 3–6 years, with a neutral position at 4 years and a diversification of instruments in different «time buckets».
The Group has reduced its exposure to interest rate risk by having a significant proportion of fixed-interest debt (69 percent at 31 December 2009), but also aims to retain suffi-cient flexibility to allow it to adapt its exposure to changes in risk levels and markets. The company is exposed to fluctua-tions in short-term interest rates, although this only affects the variable rate portion of its portfolio.
Currency risk
The Group’s business is only based on and exposed to Nor-wegian kroner (NOK). The company shall therefore not take on direct currency risk. All potential loans and associated interest payments in foreign currency shall be fully hedged for profit, cash flow and balance sheet effects.
Credit and counterparty risk
New transactions shall be entered into after assessing the indi-vidual counterparty’s creditworthiness. Any inadequate credit-worthiness shall be compensated for by a demand for guaran-tees linked to the relevant situation.
As we are in a period of weaker economic growth, in general there may be a higher risk of bankruptcy. Entra Eiendom has a very high-quality customer portfolio, with a high proportion of public sector tenants, but we are increasing our focus on the credit risk attached to the remaining tenants.
OVERALL KEY FIGURES
Financial strength
By developing its property and lease contract portfolio, the company has built up signifi cant assets since its establishment. During 2008 and the fi rst half of 2009, the value of our pro-perty portfolio fell signifi cantly as a result of a shortage of fi nancing and the higher rates of return required by the market. The market outlook continues to be weak. However, the company believes that the company’s very secure and long-term cash fl ow will help the value of the company’s portfolio to hold up better than the general market for offi ce properties. This was demonstrated by the rise in value of the portfolio towards the end of last year.
The Group has a cautious fi nance strategy and a strong equity ratio that ensures fi nancial fl exibility throughout the economic cycle. One important goal for the Group’s mana-gement of its capital structure is to ensure that it maintains a
good credit rating, allowing it to borrow from lenders on reaso-nable terms.
Also see the description in Note 3 on page 80.
Fig. 2 shows the historical fi gures for our equity and equity ratio. Signifi cant falls in the value of the our property portfolio led a decline in equity during 2008, but this turned around towards the end of 2009.
As of the fi nancial year 2007 (with comparative fi gures for 2006), the Group started reporting its fi nancial results under IFRS. Figure 2 shows changes in estimated book and value-adjusted equity over the period 2001-2005 under NGAAP and over the period 2006–2007 under IFRS. The value-adjusted equity for the period 2006–2007 represents the Group’s equity less potential tax liabilities on unrealised increases in the value of investment properties and fi nancial instruments, so what is shown is the equity after tax. At 31 December 2009, deferred tax on the unrealised increase in value totalled NOK 1,885 million, which also provides a working capital buff er for the company.
Liquidity and cash fl ow
The Group has a strong current, positive cash fl ow from ordinary operations. The Group’s net cash fl ow from operating activities totalled NOK 537 million in 2009.
Revenues are to a large extent based on long-term contracts with reliable tenants. 80 percent of the tenants in the Group’s pro-perty portfolio were from the public sector at 31 December 2009.
EQUITY DEVELOPMENT 0 1 000 2 000 3 000 4 000 5 000 6 000 7 000 8 000 9 000 60 % 50 % 40 % 30 % 20 % 10 % 0 % 2001 2002 2003 2004 2005 2006 2007 2008 2009 Fig. 2
Total book equity Total value-adjusted equity
Drawn loans Committed credit facilities
Total book equity Total value-adjusted equity Percentage NOK MILLION
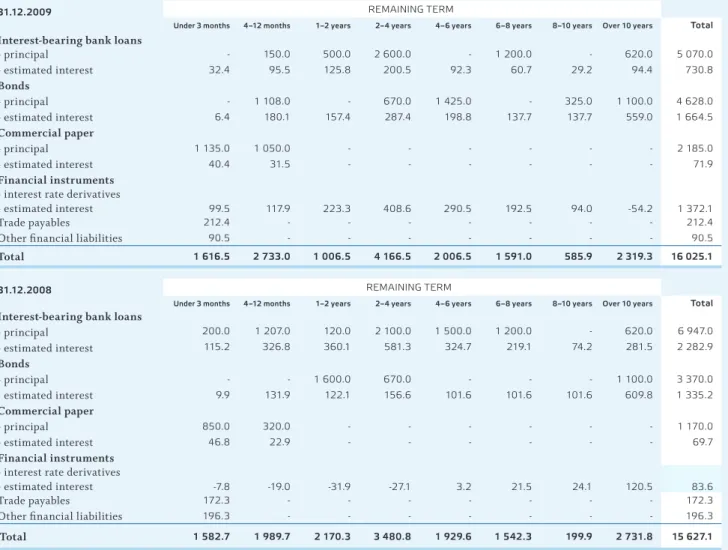
DEBT MATURITY STRUCTURE
DISTRIBUTION OF THE COMPANY’S DEBT PORTFOLIO
<1 year 1–2 years 2–4 years 4–6 years 6–8 years 8–10 years Over 10 years NOK MILLION
Fig. 3
Fig. 5
shows the company’s balanced maturity profile in relation to interest rate exposure at 31 Dec. 2009.
FIXED INTEREST MATURITY PROFILE
0 % 10 % 15 % 5 % 20 % 25 % 30 % 35 % Under 1 year
1–2 years 2–4 years 4–6 years 6–8 years 8–10 years Over 10 years Percentage of the portfolio
0 1 000 1 500 500 2 000 2 500 3 000 3 500
DEVELOPMENT OF TOTAL ASSETS
0 5 000 10 000 15 000 20 000 25 000 2001 2002 2003 2004 2005 2006 2007 2008 2009 NOK MILLION Fig. 1
shows how the company’s total assets grew from when the company was founded to 31 Dec. 2009.
Total assets – book Total assets – value-adjusted
Bank loans to subsidiaries 9 % Commercial paper 18 % Stock exchange listed bonds 30 % Mortgage bonds 9 %
Bank loans to Entra 34 %
Fig. 4
shows the share of different types of loans in the company’s debt portfolio at 31 Dec. 2009. EQUITY DEVELOPMENT 0 1 000 2 000 3 000 4 000 5 000 6 000 7 000 8 000 9 000 60 % 50 % 40 % 30 % 20 % 10 % 0 % 2001 2002 2003 2004 2005 2006 2007 2008 2009 Fig. 2
Total book equity Total value-adjusted equity
Drawn loans Committed credit facilities
Total book equity Total value-adjusted equity Percentage NOK MILLION
DEBT MATURITY STRUCTURE
DISTRIBUTION OF THE COMPANY’S DEBT PORTFOLIO
<1 year 1–2 years 2–4 years 4–6 years 6–8 years 8–10 years Over 10 years NOK MILLION
Fig. 3
Fig. 5
shows the company’s balanced maturity profile in relation to interest rate exposure at 31 Dec. 2009.
FIXED INTEREST MATURITY PROFILE
0 % 10 % 15 % 5 % 20 % 25 % 30 % 35 % Under 1 year
1–2 years 2–4 years 4–6 years 6–8 years 8–10 years Over 10 years Percentage of the portfolio
0 1 000 1 500 500 2 000 2 500 3 000 3 500
DEVELOPMENT OF TOTAL ASSETS
0 5 000 10 000 15 000 20 000 25 000 2001 2002 2003 2004 2005 2006 2007 2008 2009 NOK MILLION Fig. 1
shows how the company’s total assets grew from when the company was founded to 31 Dec. 2009.
Total assets – book Total assets – value-adjusted
Bank loans to subsidiaries 9 % Commercial paper 18 % Stock exchange listed bonds 30 % Mortgage bonds 9 %
Bank loans to Entra 34 %
Fig. 4
shows the share of different types of loans in the company’s debt portfolio at 31 Dec. 2009.
Interest cover ratio
The Group had an adjusted interest cover ratio of 1.9 at the close of 2009 (1.8 in 2008). This metric is improving. The fi gure is based on the company’s operating cash fl ow, ignoring investment-related and any extraordinary items and gains on disposals. The interest cover ratio is an important key fi gure for various fi nancial services companies when they assess the company. The fi gure shows that the company is in a strong position to service its debts.
FINANCING/BALANCE SHEET
equity
Our owner, the Norwegian Government through the Ministry of Trade and Industry, measures its return on the basis of divi-dends and increases in value, and have set a target of achieving a market rate of return on value-adjusted equity.
Loan capital
The Group’s total (nominal) debt at the close of 2009 was NOK 14,735 million, of which NOK 11,883 million was interest-bearing debt.
These fi gures include the fi nancing costs for joint ven-tures and for companies in which Entra Eiendom AS holds a stake of at least 51 percent. The management of properties and fi nancing of joint ventures is handled separately, and is tailored to the underlying activities of the individual project/ company.
The maturity structure of the Group’s long-term interest-bearing debt is illustrated in Fig. 3.
The average remaining term to maturity of available credit facilities was 5.6 years at 31 December 2009. The company continues to have a strong position in the banking and capital markets. The company has a close relationship with a wide range of large, professional banks that provide it with banking services and that are capable of contributing to the company’s future development.
Over the course of 2009 credit markets improved, with credit spreads coming down off the peaks reached during the crisis. However, there is still a lot of uncertainty in the markets, and the expectation is that it will take some time for access to capital and credit spreads to return completely to normal.
The company’s debt portfolio is made up of loans from Norwegian and foreign fi nancial institutions, and direct credit acquired through the issue of debt instruments on the Norwegian capital market. At 31 December 2009, 57 percent of the company’s fi nancing came from the money and capital markets. Entra issued commercial paper and bonds during 2009. In November 2009 the company issued the following new bonds:
• 5 year at 4.95 % fi xed rate, NOK 975 million
• 5 year at fl oating rate, NOK 450 million
• 10 year at 5.55 % fi xed rate, NOK 325 million
In conjunction with issuing the above bonds, Entra Eiendom repurchased NOK 657 million of bonds maturing 22 June 2010 or earlier. EQUITY DEVELOPMENT 0 1 000 2 000 3 000 4 000 5 000 6 000 7 000 8 000 9 000 60 % 50 % 40 % 30 % 20 % 10 % 0 % 2001 2002 2003 2004 2005 2006 2007 2008 2009 Fig. 2
Total book equity Total value-adjusted equity
Drawn loans Committed credit facilities
Total book equity Total value-adjusted equity Percentage NOK MILLION
DEBT MATURITY STRUCTURE
DISTRIBUTION OF THE COMPANY’S DEBT PORTFOLIO
<1 year 1–2 years 2–4 years 4–6 years 6–8 years 8–10 years Over 10 years NOK MILLION
Fig. 3
Fig. 5
shows the company’s balanced maturity profile in relation to interest rate exposure at 31 Dec. 2009.
FIXED INTEREST MATURITY PROFILE
0 % 10 % 15 % 5 % 20 % 25 % 30 % 35 % Under 1 year
1–2 years 2–4 years 4–6 years 6–8 years 8–10 years Over 10 years Percentage of the portfolio
0 1 000 1 500 500 2 000 2 500 3 000 3 500
DEVELOPMENT OF TOTAL ASSETS
0 5 000 10 000 15 000 20 000 25 000 2001 2002 2003 2004 2005 2006 2007 2008 2009 NOK MILLION Fig. 1
shows how the company’s total assets grew from when the company was founded to 31 Dec. 2009.
Total assets – book Total assets – value-adjusted
Bank loans to subsidiaries 9 % Commercial paper 18 % Stock exchange listed bonds 30 % Mortgage bonds 9 %
Bank loans to Entra 34 %
Fig. 4
shows the share of different types of loans in the company’s debt portfolio at 31 Dec. 2009. EQUITY DEVELOPMENT 0 1 000 2 000 3 000 4 000 5 000 6 000 7 000 8 000 9 000 60 % 50 % 40 % 30 % 20 % 10 % 0 % 2001 2002 2003 2004 2005 2006 2007 2008 2009 Fig. 2
Total book equity Total value-adjusted equity
Drawn loans Committed credit facilities
Total book equity Total value-adjusted equity Percentage NOK MILLION
DEBT MATURITY STRUCTURE
DISTRIBUTION OF THE COMPANY’S DEBT PORTFOLIO
<1 year 1–2 years 2–4 years 4–6 years 6–8 years 8–10 years Over 10 years NOK MILLION
Fig. 3
Fig. 5
shows the company’s balanced maturity profile in relation to interest rate exposure at 31 Dec. 2009.
FIXED INTEREST MATURITY PROFILE
0 % 10 % 15 % 5 % 20 % 25 % 30 % 35 % Under
1 year 1–2 years 2–4 years 4–6 years 6–8 years 8–10 years Over10 years Percentage of the portfolio
0 1 000 1 500 500 2 000 2 500 3 000 3 500
DEVELOPMENT OF TOTAL ASSETS
0 5 000 10 000 15 000 20 000 25 000 2001 2002 2003 2004 2005 2006 2007 2008 2009 NOK MILLION Fig. 1
shows how the company’s total assets grew from when the company was founded to 31 Dec. 2009.
Total assets – book Total assets – value-adjusted
Bank loans to subsidiaries 9 % Commercial paper 18 % Stock exchange listed bonds 30 % Mortgage bonds 9 %
Bank loans to Entra 34 %
Fig. 4
shows the share of different types of loans in the company’s debt portfolio at 31 Dec. 2009.
Entra Eiendom’s fi nancing has negative pledge as its main principle. Its lease agreements nevertheless make it possible to use other forms of loans for some of its portfolio. For further details see Note 3 on page 80.
At 31 December 2009, the Group had available com-mitted undrawn facilities of NOK 4,965 million with which to cover future refi nancing and investment requirements, as well as to provide a back stop for the company’s commercial paper portfolio.
With the current structure, the company’s refi nancing risk is seen as very low, but the company continuously assesses its future fi nancing requirements.
INTEREST RATE HEDGING
Naturally, Entra Eiendom has signifi cant fi nancial risk asso-ciated with fl uctuations in general NOK interest rate levels. On the basis of the current interest rate view, the Group’s interest rate exposure is managed actively through a portfolio of interest rate instruments within the framework of the specifi ed fi nance strategy. The company uses the interest rate instruments that at any given time are most suited to cover the various risks that it faces. See Note 3 on page 80 for further details.
The company considers it important for it to have a signifi cant proportion of variable rate loans in its portfolio, to give it fl e-xibility in terms of its interest rate positioning and to allow it freedom of action in the event of changes to its requirements or market conditions. As a result of the company’s interest
rate portfolio, the company’s average borrowing cost appears robust in the face of changes in general market rates.
MARKET VALUE OF THE COMPANY’S DEBT
In accordance with IFRS, the company’s debt and fi nancial instruments are measured at fair value on the balance sheet, with changes in value recognised through profi t or loss. The net change in the value of the company’s fi nancial instru-ments during 2009 was NOK 89.9 million. This was a result of rising market interest rates, which increase the value of deri-vatives and bond debt, off set by a fall in value resulting from a change in the diff erence between actual and market interest rates on bank loans.
EQUITY DEVELOPMENT 0 1 000 2 000 3 000 4 000 5 000 6 000 7 000 8 000 9 000 60 % 50 % 40 % 30 % 20 % 10 % 0 % 2001 2002 2003 2004 2005 2006 2007 2008 2009 Fig. 2
Total book equity Total value-adjusted equity
Drawn loans Committed credit facilities
Total book equity Total value-adjusted equity Percentage NOK MILLION
DEBT MATURITY STRUCTURE
DISTRIBUTION OF THE COMPANY’S DEBT PORTFOLIO
<1 year 1–2 years 2–4 years 4–6 years 6–8 years 8–10 years Over 10 years NOK MILLION
Fig. 3
Fig. 5
shows the company’s balanced maturity profile in relation to interest rate exposure at 31 Dec. 2009.
FIXED INTEREST MATURITY PROFILE
0 % 10 % 15 % 5 % 20 % 25 % 30 % 35 % Under 1 year
1–2 years 2–4 years 4–6 years 6–8 years 8–10 years Over 10 years Percentage of the portfolio
0 1 000 1 500 500 2 000 2 500 3 000 3 500
DEVELOPMENT OF TOTAL ASSETS
0 5 000 10 000 15 000 20 000 25 000 2001 2002 2003 2004 2005 2006 2007 2008 2009 NOK MILLION Fig. 1
shows how the company’s total assets grew from when the company was founded to 31 Dec. 2009.
Total assets – book Total assets – value-adjusted
Bank loans to subsidiaries 9 % Commercial paper 18 % Stock exchange listed bonds 30 % Mortgage bonds 9 %
Bank loans to Entra 34 %
Fig. 4
shows the share of different types of loans in the company’s debt portfolio at 31 Dec. 2009.
DeVeLopMenTS
after several years of very strong growth in
employment and demand for offi
ce space, employment
fell in 2009. Fewer companies wanted to move, and
the volume of new contracts in the offi
ce market fell.
THE RENTAL MARKET IN GREATER OSLO
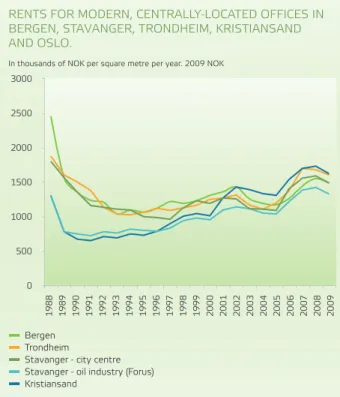
An increase in the construction of new offi ce blocks during the boom years 2004-2008 led to more offi ce space being completed in 2009 than in previous years. The fall in employment and increase in offi ce space led to a marked rise in offi ce vacancy rates and falling rents. The vacancy rate rose fastest, and rents fell most, during the fi rst half of 2009. The labour market improved in the second half of the year. Towards the end of 2009, we signed several good lease contracts at slightly higher rents. However, the volume of contracts remains too low to absorb suffi cient fl oor space to reduce vacancy rates.
Employment in Norway fell less than had been expected at the start of 2009. In spring 2009 it was expected to fall just over one percent, whereas the estimates towards the end of the year were below half a percent. Big government stimulus packages and excep-tionally low interest rates were two of the important reasons for this. In Oslo and Akershus the number of people in employment fell slightly more than the national average. However, fi gures from Statistics Norway suggest that employment in industries that are typically big users of offi ce space has held up well. Manufacturing,