Supervisors:
prof. dr. ir. H.A. Reijers, TU/e
dr. ir. I.T.P. Vanderfeesten, TU/e
Data-centric Business Process
Modelling: A Comparison of
Methods
By
W.L.M. van de Crommert
BSc Industrial Engineering
Student identity number: 0631920
In partitial fulfilment of the requirements for the degree of
Master of Science
MANAGEMENT SUMMARY
MANAGEMENT SUMMARY
Management Summary
As the environment and competition of firms is dynamic and increasingly complex, businesses should be able to continuously adapt their way of working in order to remain competitive. In this attempt to remain competitive and act on changes in technology and environment, busi-ness processes play an important role.
Business process design and redesign, often used under the heading of Business Process Management, is well known and used in practice. In the last decade however, also new initia-tives were proposed; so-called data-driven methods try to extend the activity-centric ap-proaches, by focusing on the main data-objects in the process.
Although different attempts exist, much is currently unknown about these initiatives. Even though the ideas sound promising, many alternatives exist and few of these methods are cur-rently actively used. In a previous study (Diaz Garcia, 2011) carefully selected three leading methods and conducted a first comparative study on these methods, identifying strengths that were claimed by the developers of the methods, and using an experiment to test whether these strengths were perceived by users as well.
This study continues were the previous ended. Again the Data-driven Process Structures of the University of Ulm, Product Based Workflow Design of the Eindhoven University of Technology, and Artifact-Centric Process Modelling of IBM Watson Research Laboratory, are considered. However, in contrast to the study performed by Diaz Garcia, this study tries to acquire more specified information on the user’s perceptions towards the methods.
Four main phases can be distinguished in this study:
1. In the first phase, literature is studied in order to capture claims made by the developers of the methods, that address one or multiple quality attributes. The five quality attrib-utes used in this Theoretical Evaluation are: Functionality, Usability, Efficiency, Main-tainability, and Flexibility. The obtained claims are used to create an overview of the contents and focus of the methods, and at the same time enable the mapping of the methods to each other. An overview of this set of claims can be found in Table 7. 2. The second phase, called the Empirical Evaluation, includes three workshop sessions
in which participant actively work with one of the methods. Not only do they read about the important entities of a method, they are also provided with examples and even exercises, in order to obtain some hands-on experience. A questionnaire and dis-cussion are used to gather the users’ perceptions of the methods.
3. The third phase is used to compare the claims acquired in the Theoretical Evaluation with the perceptions obtained in the Empirical Evaluation. Perceptions can support or contradict the claims, and sometimes are indecisive. In addition it can occur that claims are unaddressed in the workshops, or perceptions are identified that do not directly relate to a claim. These are captured as well.
4. Using both the claims of the developers and the statements made by the participants, the different methods are individually evaluated. After stating a methods strengths and weaknesses, the methods are compared to one another, capturing relative strengths and weaknesses, as well as opportunities for improvement.
MANAGEMENT SUMMARY One of the main findings of this study was that indeed users currently are not used to using methods that go beyond ordinary process modelling. Struggling with fairly simply examples, it can be said that an extensive training is required in order to use these kind of methods for complex, practical situations.
With respect to the Data-Driven Process Structures, proposed by the University of Ulm, it can be said that this method is very efficient and highly maintainable. This high efficiency and maintainability is achieved using very generic models, which can be difficult to formulate. Though the method is currently most often applied in the manufacturing domain, where struc-tured products are modelled, it might be interesting to use this method in other environments, in order to test its applicability to other domains.
The Product-Based Workflow Design focused not on efficiency of modelling or on main-tainability, but instead is used to optimise the process that is modelled. Users of the workshops struggled with the complexity of negative paths (knock-outs), used in the Product Data Model; participants preferred a tree-like structure without these alternative routings.
The final method discussed, Artifact-Centric Process Modelling, proved to be fairly difficult for the participants. The creation of these models proved to be fairly complex; and even though the artifacts described are self-explaining, the models that incorporate these artifacts are still difficult for business users. The claimed added value for analysing, managing, and controlling the business operations, in addition, remained somewhat unclear.
As can be seen, each of these methods has its own strengths and weaknesses; it might however be possible for these (and other) methods, to tackle some of their own weaknesses by incorpo-rating functionality that is based on other methods.
Artifact-Centric Process Modelling, for example, could try to incorporate some of the as-pects of efficiency and maintainability, used in Data-Driven Process Structures. For PBWD it might be interesting to increase its readability, improving understandability for business users. As can be seen, data-centric process modelling methods can still be improved; refinements are required to all of the methods. However, data-centric modelling methods do propose some interesting ideas for improving the analysis, management, and control of business operations.
ACKNOWLEDGEMENTS
Acknowledgements
The Master Thesis in front of you is the result of the research I conducted during the past seven months. Many persons helped me and supported me during this process, and I would like to express my thanks to them here.
First of all, I would like to thank my supervisors: Hajo Reijers, for the interesting discus-sions we had that helped me push my research to a higher level, and Irene Vanderfeesten, for her continuous support and optimism. Both of you helped me to overcome periods in which progress came to a halt, finding new spirit to tackle the encountered problems.
Secondly, I would like to thank the people who contributed to this thesis in one way or another. Manfred Reichert from the Ulm University, and Emily Rong Liu from the IBM Wat-son Research Laboratory, who helped me adjusting and improving the tutorials. Furthermore, I would like to thank all business professionals and students that participated in the workshops, and thereby contributed to results of the Empirical Evaluation.
I also thank my colleagues from the Paviljoen, especially Han and SG, for the estimated total of 1000 cups of coffee we drank together, and the often welcome distraction during long days. Han, special thanks for the feedback and discussions on different parts of my study.
Patricks, thanks for the wonderful time I had in Eindhoven, you were great.
The last words are for my family, for their continuous support and confidence in me. You encouraged me, and helped me to put things in perspective. Thank you all.
Wim van de Crommert Eindhoven, January 2013
CONTENTS
Contents
List of Figures ... 6 List of Tables ... 6 1 Introduction ... 7 1.1 Research Goal ... 7 1.2 Research Design ... 81.3 Structure of the Report ... 9
2 Preliminaries ... 10
2.1 Business Process Management ...10
2.2 Process Modelling Perspectives ...10
2.3 Data-driven Process Structures ...11
2.4 Product-based Workflow Design ...13
2.5 Artifact-centric Process Modelling ...15
2.6 Qualitative Research ...18
2.7 Method Evaluation Model ...20
3 Theoretical Evaluation ... 22
3.1 Quality and quality attributes ...22
3.2 Claims by Developers ...23
4 Empirical Evaluation ... 28
4.1 Methodology ...28
4.2 Results ...31
5 Results ... 39
5.1 Evaluation: Data-Driven Process Structures ...39
5.2 Evaluation: Product-Based Workflow Design ...41
5.3 Evaluation: Artifact-Centric Process Modelling ...43
6 Discussion ... 46
6.1 Discussion Method Evaluations...46
6.2 Comparison of Methods ...51
7 Conclusion ... 56
7.1 Limitations and Future Research ...57
7.2 Future Research ...58
8 References ... 59
LIST OF FIGURES
List of Figures
Figure 1 - Research Design ... 8
Figure 2 - Data Model ... 12
Figure 3 - Lifecycle Coordination Model ... 12
Figure 4 - Data Structure ... 13
Figure 5 - Data-driven Process Structure ... 13
Figure 6 - Product Data Model ... 15
Figure 7 - Step 1 : Create Business Artifact Information Model ... 17
Figure 8 - Step 2: Create Artifact Lifecycles ... 17
Figure 9 - Method Evaluation Model ... 21
Figure 10 - Overview of Workshop Structure ... 28
Figure 11 - Perceived Ease of Use ... 33
Figure 12 - Perceived Usefulness ... 33
List of Tables
Table 1 - Step 3: Create Services ... 18Table 2 - Step 4: Create Associations ... 18
Table 3 - Different Levels of Coding ... 19
Table 4 - Selected Quality Attributes ... 23
Table 5 - Articles Used for Claims ... 24
Table 6 - Hierarchy of Coding ... 24
Table 7 - Theoretical Evaluation: Claims by Developers ... 26
Table 8 - Cronbach's alpha ... 32
Table 9 - Overview Discussion: Data-Driven Process Structures ... 34
Table 10 - Overview Discussion - Product-Based Workflow Design ... 35
Table 11 - Overview Discussion - Artifact-Centric Process Modelling ... 36
Table 12 - Results exercises: Data-Driven Process Structures ... 37
Table 13 - Results exercises: Product-Based Workflow Design ... 37
Table 14 - Results exercises: Artifact-Centric Process Modelling ... 38
Table 15 - DDPS: Strengths and Weaknesses ... 48
Table 16 - PBWD: Strengths and Weaknesses ... 49
Table 17 - ACPM: Strengths and Weaknesses ... 51
INTRODUCTION
1
Introduction
As the environment and competition of firms is dynamic and increasingly complex, businesses should continuously adapt their way of working in order to remain competitive. In this attempt to remain competitive and act on changes in technology and environment, business processes play an important role; both physical, like manufacturing processes and logistics, and non-physical processes (e.g. digital forms). The field that addresses the design, redesign and man-agement of processes is called Business Process Manman-agement (BPM) (Hammer, 2010), (Van der Aalst, Ter Hofstede, & Weske, 2003).
The activity-centric approach of BPM is widely known and accepted. In the last decade however, also new initiatives were proposed that aim at improving activity-centric methods; so-called data-centric methods try to extend the activity-centric approaches, by focusing on the main data-objects in the process.
Although different attempts exist, much is unknown regarding these initiatives. Therefore, in this study, the data-centric methods of three institutes are evaluated: Data-driven Process Structures of the University of Ulm, Product Based Workflow Design of the Eindhoven Uni-versity of Technology, and Artifact-Centric Process Modelling of IBM Watson Research La-boratory. These methods were selected as the main data-centric BPM approaches by Diaz Garcia in his master thesis on the Evaluation of Data-Centric Process Modelling Approaches (Diaz Garcia, 2011).
Although the selected methods are leading examples, the field of data-driven process mod-elling approaches is still in its infancy; none of the previously named methods is widely accepted nor used. In order to test the users’ perceptions (perceived ease of use and perceived usefulness) of the methods, Diaz Garcia provided participants with a brief description of the approach, followed by a set of models that were created using the method (Diaz Garcia, 2011). This thesis in contrast uses a more active approach: using an empirical setting, participants are provided with self-explaining tutorials, including examples and exercises. Using this hands-on experience, participants are better able to point out strengths and weaknesses of the different methods. Furthermore, a structured approach is used to extract the claimed strengths and weaknesses of the three methods from literature, enabling a comparison of the strengths and weaknesses claimed by the developers, with the ones perceived by participants of the workshops.
1.1
Research Goal
As briefly mentioned at the beginning of this chapter, three methods will be evaluated on both a theoretical and practical level: not only will the study be used to determine the functionality and added value claimed, but also how these aspects are perceived by users, in order to better understand and compare these different methods. The research goal can be formulated as fol-lows:
INTRODUCTION 1. What are the theoretical differences between the selected methods?
2. What are the modellers’ perceptions towards the different methods? 3. What are the main strengths and weaknesses of the selected methods?
The first research question is addressed by performing an in-depth analysis (literature review) of the three different methods. Different quality attributes are used to take all important char-acteristics into account; a schematic overview helps in comparing the different methods. In order to gather information on modellers’ attitudes towards the different methods, a survey is set up to collect information on users’ perceptions towards the method and specific aspects of this method. Using the Method Evaluation Model (Moody, 2003), information on the users’ perceived ease of use and perceived usefulness is collected. Furthermore, a discussion will be used to acquire information on specific aspects of the approaches.
The final research question helps to define possibilities to improve different aspects of the selected methods. Using the results from both theoretical and empirical evaluation, strengths and weaknesses (e.g. in representation, number of models, complexity, et cetera) are consid-ered. Knowledge obtained here can be used to propose improvements for the existing methods.
1.2
Research Design
Four main stages in the research design can be defined, which will be further explained in their corresponding subsections.
1.2.1 Theoretical Evaluation
In the first phase, which is described in Chapter 3, the available literature is studied in order to find claims made by the developers, regarding functionality or attributes of the method. Using a stepwise coding method, based on the Grounded Theory used in qualitative research, claims are gathered, coded, grouped in concepts, and finally allocated to one of five quality attributes: Functionality, Usability, Efficiency, Maintainability, and Flexibility. The result of the Theoretical Evaluation is a set of claims for each of the methods that indicates what is claimed in literature with respect to different quality attributes.
1.2.2 Empirical Evaluation
Though it is interesting to determine theoretical differences between the methods, this study in addition tries to determine what the perceived similarities and differences of the studied methods are. Therefore, a tutorial is created and respondents are gathered, in order to test the methods in an empirical setting. A total of three workshops is conducted; one for each of the
Theoretical Evaluation (Ch.3)
Empirical
Evaluation (Ch.4) Results (Ch.5) Discussion (Ch.6)
Gathering Developer’s Claims
Gathering User’s Perceptions
Compare Claims
and Perceptions Explain findings
INTRODUCTION methods. The workshops provide different sources of information: a questionnaire, the models created in the exercises, and a group discussion. In order to extract the information from this final source, again Grounded Theory Coding is used. The result of the Empirical Evaluation is a set of users’ perceptions for each of the methods, which again are categorised using the five quality attributes.
1.2.3 Results
In the third phase, the results from the Theoretical Evaluation and the Empirical Evaluation are combined: the claims of the developers are compared to the participants’ perceptions, in order to check whether or not they are consistent with one another. Though most of the im-portant claims are addressed in the workshops, some of the claims were not provided any attention during the workshops; these claims therefore cannot be tested in this section. As a final point, participants’ perceptions that are not captured in claims, will be mentioned at the end of a method’s section, as these results might be interesting for the discussion.
1.2.4 Discussion
Whereas the third phase does not provide an interpretation of the obtained results, in the fourth phase such an interpretation is provided. Often the results of the Empirical Evaluation support the claims of the developers, obviating the need for an extensive discussion. In other cases however, claims might only be supported partially, or even contradicted by the results of the workshops. Especially when the outcomes of the Empirical Evaluation are counterintu-itive, the discussion is used to provide possible explanations of the obtained results. In addition to the interpretation of the results and their causes for an individual method, the second part of the discussion makes a comparison of the different methods, identifying relative strengths and weaknesses of the methods to each other. Opportunities for improvement for each of the methods will be addressed here as well.
1.3
Structure of the Report
This document is structured as follows:- Chapter 2 - Preliminaries introduces the Business Process Management discipline, three data-centric methods, Grounded Theory Coding, and the Method Evaluation Model. - Chapter 3 - Theoretical Evaluation documents the process of the Theoretical Evaluation,
selecting relevant articles and extracting the claims.
- Chapter 4 - Empirical Evaluation describes the Empirical Evaluation, the creation of ma-terials for the workshops, and the extraction of information from the obtained data. - Chapter 5 - Results documents the combination of the results of both evaluations.
PRELIMINARIES
2
Preliminaries
Before the actual study is reported upon, first some prior knowledge is considered. The concepts and theories used in this thesis will first be briefly introduced in this chapter. The chapter is structured as follows: first, some general information on BPM and, more specifically, data-driven modelling will be provided. Though briefly, this section addresses basic knowledge re-quired to understand this thesis. After this general introduction, a more in depth view on three data-centric modelling methods will be provided: Data-Driven Process Structures (2.3), Prod-uct-Based Workflow Design (2.4), and Artifact-Centric Process Modelling (2.5), which together form the subject of this study, will be granted a closer look. The final topic addressed in this chapter is an evaluation method used in the empirical evaluation of this study.
2.1
Business Process Management
Although different definitions of BPM exist, (Van der Aalst, Ter Hofstede, & Weske, 2003) provide a very clear yet complete definition of BPM:
“Supporting business processes using methods, techniques, and software to
design, enact, control, and analyse operational processes involving humans,
organisations, applications, documents and other sources of information.”
When decomposing this definition, one sees that it involves business processes (what), methods techniques and software (how), to design, enact, control, analyse (why), involving humans, organisation, applications, documents and other sources (with whom). Although not included in the definition by (Van der Aalst, Ter Hofstede, & Weske, 2003), BPM is seen as a continuous process; a good design is never final, since environment and techniques continuously change (Hammer, 2010).
BPM helps to achieve both operational benefits (consistency, cost, speed, quality, service) and strategic benefits (flexibility, globalisation, merger, ERP implementation) (Hammer, 2010). Business Process Management provides the benefit that seemingly incompatible goals can be achieved by creating a new design for the process.
2.2
Process Modelling Perspectives
In (Diaz Garcia, 2011) a clear overview of different BPM perspectives and their goals is pro-vided. The author distinguishes four different perspectives of process modelling, from which the last three tackle problems encountered by the first and most common modelling technique: the activity-centric approach.
Activity-centric Process Modelling: In this traditional type of process modelling, the set of activities that need to be executed, their relations and order of execution, are key concepts; workflow patterns are a well-known example of such an approach. The limitation of activity-centric approaches is the need of a highly structured process; when the process is more dynamic, only idealised models can be created (as accurate models become unmanageable), which merely
PRELIMINARIES serve as idea rather than as concrete model. The lack of flexibility is the major problem con-cerning activity-centric process modelling approaches.
Data-driven Process Modelling: Data-driven or information-driven approaches are based on informational entities handled in a process, which are used as central driver for the design. As many different types of information entities exist or can be created by combining information into new entities, multiple data-driven approaches exist.
Organisational-based Process Modelling: This approach focuses on the different roles in the process, the actions that correspond with these different roles, and the interactions between roles which are required to achieve a certain business goal.
Goal-oriented Process Modelling: As indicated by the name, goal-oriented process modelling focuses on the ultimate goals instead of a focus on the path to achieve these goals. Goals are “statements which declare what has to be achieved or avoided in a company” (Kueng & Ka-walek, 1997). Goals are decomposed into sub-goals which in turn can be directly allocated to activities.
This study will focus on Data-centric Business Process Modelling methods. In a preceding study, Diaz Garcia selected three methods that were renown, covered distinct groups of data-centric methods, and showed prominence of the data perspective (instead of relying on tradi-tional activity-centric modelling techniques). Furthermore, from a practical point of view, he only selected those methods for which it was possible to directly inquire the promoter research-ers. The three selected methods are the Data-Driven Process Structures, Product-Based Work-flow Design and Artifact-Centric Process Modelling (Diaz Garcia, 2011). Each of these methods will be discussed in the following sections: section 2.3 will address the Data-Driven Process Structures of the University of Ulm and Daimler Chrysler, section 2.4 addresses the Product-Based Workflow Design from the Eindhoven University of Technology, and section 2.5 ad-dresses the Artifact-Centric Modelling from IBM Watson Research Laboratory.
2.3
Data-driven Process Structures
Developed in a collaboration between the University of Ulm and Daimler, Data-driven Process Structures proposes a separation of the data structure on the one hand from process logic on the other. Modelling efforts can be reduced by increasing reusability and maintainability, fa-cilitated by the separation of data and process logic.
2.3.1 Main entities
The data-driven process structures approach consists of two different levels: the model level and the instance level. Each of these two levels in turn consists of two models, resulting in a total of four models (Müller, Reichert, & Herbst, 2006), (Müller, Reichert, & Herbst, 2007).
PRELIMINARIES
12
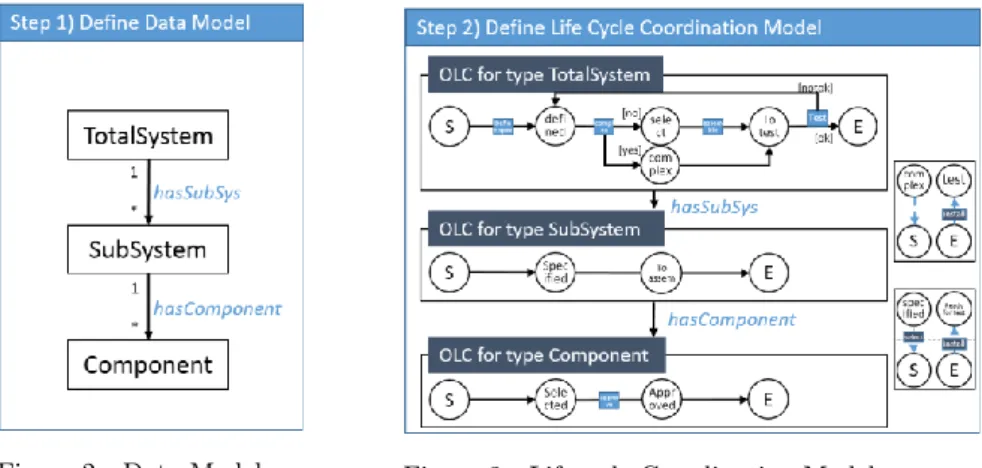
Data Model. The first model created is the Data Model. This model shows all object types incorporated in the model, as well as the relation types between object types. Object types often represent levels of hierarchy, such as system, subsystem, and part.
Object Lifecycles. Second step in the creation of a data-driven process is the creation of object lifecycles. Object lifecycles in data-driven process structures are, in contrast to lifecycles in the artefact-centric approach, not based on a specific object, but merely on an object type. For each object type specified in the data model, a lifecycle is created. When the object types defined in the data model are replaced by object lifecycles, and relation types are replaced by relations between lifecycles, one obtains the Lifecycle Coordination Model (LCM).
Data Structure. In the third step, a Data Model (as created in the first step) is instantiated: object types are replaced by actual objects (including name, type, ..) and the corresponding relations are drawn, thereby creating a Data Structure. It is possible that a subsystem is used by, though not included in, a system; this can be represented by the relations.
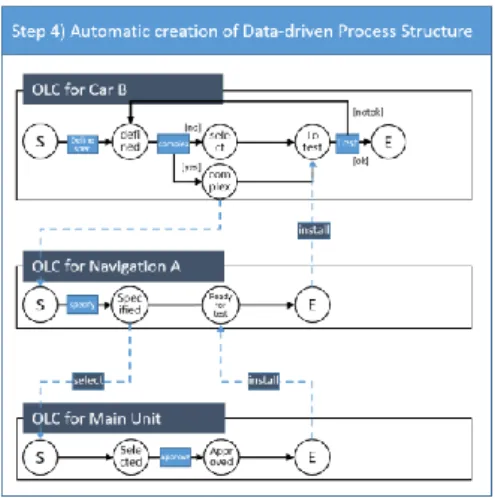
Data-driven Process Structure. The fourth and final step is the automatic creation of a data-driven process structure. Based on the LCM and the Data Structure, the generally defined lifecycles of the LCM can be instantiated using the objects defined in the data structure.
2.3.2 Example: Car Navigation System
To illustrate the described method, the method will be used to explain the addition of a navi-gation system to a car (Müller, Reichert, & Herbst, 2008). The release management (RLM), which systematically tests and releases different systems, subsystems, and components, requires several processes to be executed for each electrical component. These processes should be syn-chronised with processes of other components (test an assembly only after its components are tested individually). Note that the first two steps are performed by domain experts and are not specific for the navigation system, but for the automotive domain as a whole.
The first step is the definition of a Data Model by a domain expert, shown in Figure 2. As can be seen, three levels of hierarchy are defined: TotalSystem, SubSystem, and Component. There are only two different types of relations (hasSubSys and hasComponent) indicating that all SubSystems (Components) are related to the TotalSystem (SubSystem) in an identical way.
PRELIMINARIES Figure 3 shows the Lifecycle Coordination Model: the object lifecycles and relations between these lifecycles. From this representation the link between the object type TotalSystem and the object lifecycle for TotalSystem, as well as its position in the hierarchy, immediately be-comes clear. The relation types defined in the Data Model are also specified; the states of the different object types are connected to each other.
With the first two models defined, the model level is completed. The third model created is the instantiation of the Data Model, and is called the Data Structure (Figure 4). This level is the first level in which the Navigation System has a role: the navigation system is a SubSys-tem used in the TotalSysSubSys-tem (Car B), and includes the Main Unit as only Component.
The final model created is the Data-driven Process Structure (Figure 5). This automatically generated model is constructed in a similar manner as the LCM in Figure 3; the objects of the Data Structure are replaced with object lifecycles, and the relations are added as well.
2.3.3 Remarks
The most beneficial aspect of Data-driven Process Structures is that changes can be made fairly easy: changing the product does not automatically imply a complete redesign of the process structure, but is driven by changes of the product’s data structure; these changes are automatically mapped to adaptations of the corresponding process structure, thereby saving efforts when evolving the process instance structure. In addition, data-driven process structures can easily contain many elements as they are constructed automatically.
2.4
Product-based Workflow Design
PRELIMINARIES data elements, workflow models can be created (Kamphuis, Vanderfeesten, Reijers, & Van Hattem, 2008), (Vanderfeesten, Reijers, & Van der Aalst, 2011).
2.4.1 Main entities
Product-based Workflow Design is inspired by the Bill Of Materials used in manufacturing; however, since some of the aspects of the BOM are unnecessary (for example, cardinalities), an adjusted model for data-centric processes, the Product Data Model, is created (Reijers, Limam, & Van der Aalst, 2003). The main entities of the PDM are discussed below.
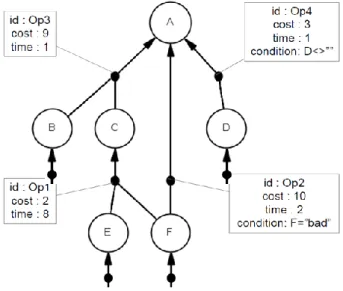
Data Element. Represented as circles that contain the name of the object (or a letter repre-senting this name), data elements are objects that contain specific information. Some elements are determined by the external environment (‘leaf elements’), while other elements are deter-mined by combining information of other objects. Once deterdeter-mined, data elements have fixed values (i.e. they cannot be updated). A special instance of a data element is the Top Data Element, for which the outcome has to be determined, it is the end product/final decision. Production Rule. A production rule (represented by a black dot) is used to combine information of data elements to create a value for another element. In the provided example, information of data elements B and C is combined to create a value for data element A. Rules can be either concrete or abstract; for both types an example is provided.
- Concrete A = 3 * B + C
- Abstract Human judgment on suitability of A based on elements B and C Attributes of Production Rule. Attributes provide information about other characteristics of activating the production rule. For example an identifier, cost and time can be provided. Product Data Model (PDM). This is the main entity of PBWD. It provides a complete over-view of the different data elements and their relations, as well as the according production rules.
2.4.2 Example: the Helicopter Pilot
This example shows the product data model that describes the process to determine someone’s suitability to become a helicopter pilot (Reijers, Limam, & Van der Aalst, 2003). The top element is A, which corresponds to the suitability to become a helicopter pilot. Decisions are based upon psychological fitness, physical fitness (B and C), latest results of a suitability test from the last two years (D), and the quality of reflexes and eyesight (E and F).
As can be seen from the arrows leading directly to a, a decision can be made based upon a combination of psychological and physical fitness {B,C}, results of a previous test {D}, or
{F} quality of eyesight. In a similar way, a value for c can be obtained using the results from
{E,F}.
A decision (either positive or negative) can be made using one of the above described sets of data elements. However, to be able to choose the optimal path, additional information is required about time and cost. This kind of information is added to production rules; executing
PRELIMINARIES a production rule has a specified cost and time; the optimal path is determined by the selected optimisation criterion.
Using the model and its constraints, the best solution with respect to a performance indi-cator (cost, time) can be selected. For the leaf elements in this example (elements that are acquired from external environment) no attributes of the production rules are specified; one can consider the cost and time for creating these elements to be zero.
Using heuristics (Kamphuis, Vanderfeesten, Reijers, & Van Hattem, 2008) or by using the PDM directly (Vanderfeesten, Reijers, & Van der Aalst, 2011), a workflow can be created which is executable. However, both of these methods are not very sophisticated such that most often the PDM is used to obtain new insights in the process and is used as an aid in creating new workflow designs.
2.4.3 Remarks
Product-based Workflow Design proposes a true clean sheet method, only considering the ac-tual data elements used in the process and their relations to each other. In addition, from the methods discussed, PBWD is the only one that is able to generate optimised processes. Limi-tation of the method is the required creation of a PDM, based on for example product specifi-cation, handbooks, production procedures, et cetera. Furthermore, the automatic generation of workflow designs is not yet refined, forcing manual creation of workflow designs. As a final comment, it can be seen as a limitation that data elements cannot be updated, making PBWD a more static method in this sense.
PRELIMINARIES and control business operations (Nigam & Caswell, 2003), (Bhattacharya, Gerede, Hull, Liu, & Su, 2007).
2.5.1 Main entities
In the Artifact-centric Process Modelling approach, five different types of entities can be dis-tinguished: artifacts, a business artefact information model, lifecycles, services, and associa-tions. Together these five are the Business Operations Model, the logical specification of busi-ness process execution.
Business Artifact.Concrete, self-describing, and unique entity that corresponds to a key data object. Artifacts have attributes that contain all information required for executing business processes. One of these attributes is an artifact’s unique identity (ID) that cannot be changed; the other attributes of artifacts can be changed at will. An example of an artifact could be a customer, an invoice, or a task.
Business Artifact Information Model. Overview of all artifacts in a system, including their relations to each other and the corresponding cardinalities. In addition, attributes of artifacts are included as well. Business artifact information models can be described perfectly using Entity-Relationship (ER)-models.
Business Artifact (macro-level) Lifecycle. The lifecycle of an artifact provides its end-to-end process; it describes the states of an artifact from creation to disposal. Artifact may have different life expectancies: some live short, others long, and some are essentially permanent. Service. Unit of work that is meaningful to the business process. Services make changes to one or more artifacts; these changes are transactional; the service has exclusive control over the involved artifacts when making changes. Each service can be decomposed in four properties, which define the actual service in a structured manner. The four key aspects are Inputs, Out-puts, Pre-conditions, and Effects (IOPE). For all required changes, the artifact and attribute that are changed are specified. When an artifact changes state as a result of the service, this is defined here as well.
Association Rules.Changes made by services to artifacts are subject to a number of constraints. These constraints can be procedural (order of execution) or declarative (based on rules and properties) and are captured in rules. For each association rule an Event, Condition, and Ac-tion (ECA) are defined. When required, the person performing the acAc-tion can be added as well (‘By’).
2.5.2 Example: the Restaurant Case
A brief example, based on Nigam and Caswell (Nigam & Caswell, 2003), is shown here to illustrate the described method. The example considers a restaurant case, in which the restau-rant offers a menu consisting of different meal options (e.g. pasta, pizza), thereby offering the opportunity to specify some additional features of the meal option (e.g. sauce). Since the spec-ified meals can be very diverse, the required ingredients are not always directly available; unavailable ingredients should be prepared first (e.g. cutting vegetables). For each customer
PRELIMINARIES the restaurant keeps a Guest Check, on which the different ordered goods and their prices are listed.
The first step in creating an artefact-centric process model is selecting all important arti-facts and linking them to one another.
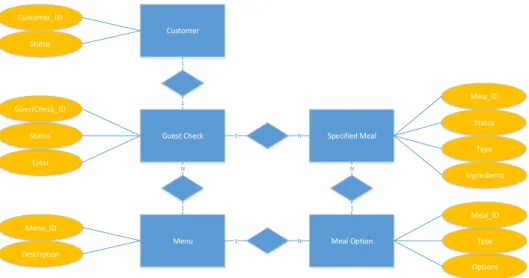
Figure 7 shows the five main artifacts that can be distinguished from the case description (blue rectangles). Where most artifacts are relatively straightforward, meal option and specified meal might require some explanation: on the menu, different meal options are specified. When a customer selects one of these meal options, he or she should directly make some choices re-garding for example sauce and side dish; these choices are captured in the artifact specified meal, which in turn can be sent to the kitchen. Further note that all artifacts have different attributes (yellow ellipse), though all of them have an own, unique, identity (ID).
In the second step lifecycles of artifacts are created. The case description did not provide much information regarding the lifecycle of artifacts; therefore there is relatively much freedom in creating these lifecycles. The lifecycle of the artifact Customer will be explained in Figure 8; other lifecycles are created in a similar way. When a new customer enters the restaurant, he/she will be allocated to a table. The customer is offered a menu, from which a meal can be selected (or specified, referring to the names used in the artifact information model). A cus-tomer then waits for the meal to arrive and starts eating when it does. During or after eating, new meals and/or drinks can be ordered from the menu. If the customer is done eating, he or she asks for the check, pays, and leaves the restaurant.
Figure 7 - Step 1 : Create Business Artifact Information Model Customer
Guest Check Specified Meal
Menu Meal Option
1 1 N 1 1 N 1 N N 1 Customer_ID Status Total Status GuestCheck_ID Menu_ID Description Meal_ID Status Type Ingredients Options Type Meal_ID
PRELIMINARIES When artifacts are defined and linked, and lifecycles are created, the third step is to define the Services that can change states and attributes of artifacts. In Table 1 the service CreateCus-tomerProfile is specified. As can be seen, no input artifacts are required; a Customer artifact is created when a new customer arrives that is not yet created in the system. This customer directly gets an ID and is put in state Allocated to Table.
The final step considered of artifact-centric process modelling is the creation of Rules. Rules determine when a Service is invoked: at a certain event, that meets specified conditions, the according action is performed. The rule stated in Table 2 specifies when service CreateCus-tomerProfile is invoked.
Four steps are currently defined in the creation of an artifact-centric process model. How-ever, the final step performed did not directly lead to a process model; two additional steps can be performed that result in the actual creation of a process model, being i) Design of Conceptual Flow Diagram, and ii) Workflow realisation. These steps are considered too com-plex for inclusion in this thesis; in addition, as the other approaches also stop modelling at this point, this decision should not influence the evaluation.
2.5.3 Remarks
Artifact-centric process modelling provides overviews of all important artifacts and their rela-tions. In addition, the use of lifecycles allows greater flexibility to artifacts, including revision-ing, checks, et cetera. Services and associations clearly specify which artifacts and attributes are changed, in what situation, and what conditions should be met. Although very specific, this set of models and tables might result in a relatively complex method, especially when models become bigger (Bhattacharya, Gerede, Hull, Liu, & Su, 2007); in addition, the relations between all models and tables in this method even further increase its complexity.
2.6
Qualitative Research
With the methods under study discussed in the previous three sections, this section will focus on the qualitative research aspect of this study. As social changes in the world occur rapidly and frequently, traditional deductive methodologies are often difficult to apply. Instead of using deductive methodologies, which test hypotheses from theoretical models using empirical evi-dence, inductive strategies can often be applied; these inductive strategies do not start from theories and testing to quantify the problem, but try to explore or define the problem at hand; empirical data is used to develop theories for the topic of study.
Rule 1 Register New Customer
Events Order is received
Conditions Customer is not yet registered Actions Invoke CreateCustomerProfile
Table 2 - Step 4: Create Associations
Service CreateCustomerProfile
Input (none)
Output Customer
Pre-condition Customer is not yet created Effects - Define Customer ID
- Define state of Customer (Allocated to Table)
PRELIMINARIES An approach that is often used in qualitative research is the Grounded Theory. Using this methodology, one is able to extract information from different types of data (e.g. text, obser-vations, illustrations, spoken word), using a stepwise approach. The next section will elaborate on Grounded Theory Coding, and the aspects relevant for this study.
2.6.1 Grounded Theory Coding
One research method which enables one to extract valuable information from text, observa-tions, spoken word, et cetera, is the Grounded Theory (Glaser & Strauss, 1967), (Strauss & Corbin, 1998). Using a stepwise coding approach, this method is used to analyse data in order to develop one or multiple theories that are “grounded in data”, i.e. are based on the data from the used sources. The method should not be seen as an attempt to create a single truth; it tries to conceptualise what is going on in the data (Flick, 2009).
It can be said that Grounded Theory operates in a reverse fashion from traditional social science research. Instead of formulating hypotheses and test them using the available data, data is obtained, coded, grouped, and finally categorised; the obtained categories can be used to formulate theories, or hypotheses.
Stage Purpose
Codes Identifying anchors that allow the key points of the data to be gathered Concepts Collections of codes of similar content that allows the data to be grouped Categories Broad groups of similar concepts that are used to generate a theory
Theory A collection of explanations that explain the subject of the research
Table 3 - Different Levels of Coding Four main phases can be determined (Flick, 2009):
1. Initial phase 2. Conceptual phase 3. Selective Phase 4. Reflexive phase
Initial phase
After the field and target population are selected and the required data is gathered, the first coding can be done. This open coding is not restricted in any ways, and is most often used to familiarise oneself with the data, creating a deeper understanding of the text (Flick, 2009). Codes are attached to the data, which are still closely related to the text; codes that are similar or even identical can be grouped into concepts, which are the basic building blocks of theories.
Conceptual phase
Using the codes and concepts determined in the initial phase, this second phase is used to define and refine categories, which are used to relate different concepts to a single category.
PRELIMINARIES
Selective phase
In the selective phase, the categories defined in the second phase are evaluated, comparing the core concepts of a category to those of another. In this selective phase, theories can be formu-lated and checked against the data. As the different levels of coding (codes, concepts, and categories) are documented in a structured manner, the coding can be used for formulating different theories as well.
Reflexive phase
In the reflexive phase, the quality of the used methodology is evaluated. Two quality attributes are important in this evaluation: Reliability and Validity of the method. Both these quality attributes will be briefly discussed here, thereby addressing how to tackle possible problems. Reliability. Two aspects regarding reliability are of importance. The first considers a clear separation of statements made by the subjects under study, and statements and interpretations made by the researcher. This distinction should be clear in order to create objective theories, theories that are really grounded in theory. Secondly, the methodology used to extract the information should be clearly and unambiguously defined, enabling others to trace the steps of the researcher.
Validity. The validity concept discussed here is procedural validity. Elaborating on the second aspect of reliability, which states that the used procedure should be clearly defined, procedural validity describes some concrete aspects. Wolcott defines nine important aspects of validity:
(1) The researcher should refrain from talking in the field but rather should listen as much as possible. He or she should (2) produce notes that are as exact as possible, (3) begin to write early, and in a way (4) which allows readers of his or her notes and reports to see for themselves. This means providing enough data for readers to make their own inferences and follow those of the researcher. The report should be as complete (5) and candid (6) as possible. The researcher should seek feedback on his or her findings and presentations in the field or from his or her colleagues (7). Presentations should be characterised by a balance (8) between the various aspects and (9) by accuracy in writing. (Wolcott, 1990).
The main idea that becomes clear from these nine aspects, are that the researcher should try to limit his own input in the discussion, capture the statements of subjects as exactly as pos-sible, and document the used approach completely and transparently. Validity is further in-creased if feedback is provided and used for improving the used approach.
2.7
Method Evaluation Model
Where research often focuses on validating statements, which are either supported or not, evaluating methods is far less straightforward, since they only have pragmatic value: instead of right or wrong, methods are merely effective or ineffective. In order to try and evaluate the design methods of information systems, (Moody, 2003) uses the Technology Acceptance Model
PRELIMINARIES (TAM) as a starting point. TAM measures whether or not users accept the proposed technol-ogy; Moody adapts this model in such a way that is can be used to evaluate technology design methods.
The three main aspects of TAM are perceived ease of use, perceived usefulness, and inten-tion to use. Perceived ease of use corresponds to the extent to which a person believes that using the particular system will be free of effort. Perceived usefulness corresponds to the extent to which a person believes that using the particular system will help achieve the intended objectives. Intention to use corresponds to the extent to which a user intends to use the par-ticular system (Moody, 2003).
To measure the success of a method, two dimensions are proposed:
1. Actual efficacy: whether the method improves performance of the task
a. Actual efficiency: how well are the achievements compared to the required efforts? b. Actual effectiveness: how well are the objectives achieved?
2. Adoption in practice: whether the method is used in practice.
Moody stresses the fact that although a model can be superior to another model, the model is ‘unsuccessful’ if it is not used in practice. A model which is used in practice but does not improve the performance of the task (or at least not significantly) can be considered un-successful as well.
THEORETICAL EVALUATION
3
Theoretical Evaluation
In this chapter, the Theoretical Evaluation will be described. The first section of this chapter addresses the definition of quality, and the selection of quality attributes. These definitions and selected attributes will be used in both the Theoretical Evaluation (described in this chap-ter) and in the Empirical Evaluation (described in Chapter 4). For all three modelling methods, literature is studied for statements made by the developers of the methods, which address aspects and attributes of the different methods. Using Grounded Theory Coding, as described in section 2.6.1, these statements are coded and grouped, resulting in a set of claims made by the developers; which is the end product of this Theoretical Evaluation.
3.1
Quality and quality attributes
Before any evaluation (Theoretical or Empirical) can be conducted, one should first define quality, and define and select quality attributes. The following two subsections address these definitions, which will be used in the Theoretical Evaluation as well as in the Empirical Eval-uation.
3.1.1 Quality
Before defining different attributes of quality, a definition for quality is provided first. The IEEE Standard Glossary of Software Engineering Terminology (IEEE, 1990) proposes two alternative definitions:
1. The degree to which a system, component, or process meets specified requirements; 2. The degree to which a system, component, or process meets customer or user needs or
expectations.
The first definition addresses the specified requirements of an entity, while the second focuses the customer’s needs and expectations. In the Theoretical Evaluation the focus is on the spec-ified requirements: capturing claims made by the developers, which address aspects and at-tributes of the methods. In this first evaluation, the quality atat-tributes are only used to group the different aspects and attributes of the selected methods. The second evaluation, the Em-pirical Evaluation, focuses on the users’ perspective (capturing the needs and expectations of the users), thereby addressing the second definition of quality.
3.1.2 Quality attributes
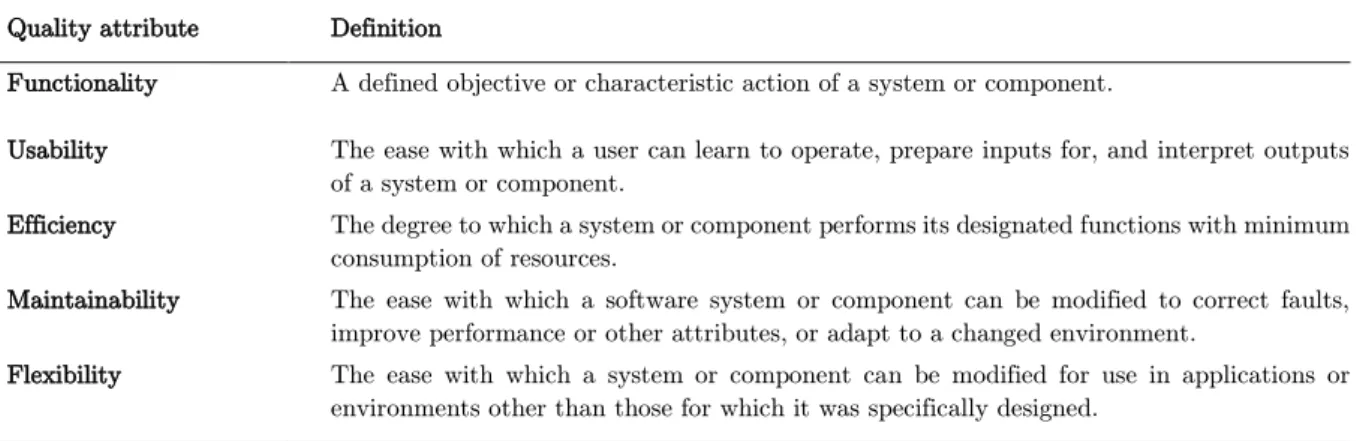
The ISO/IEC 9126 (Software Engineering - Product Quality) is an international standard for the evaluation of software quality. Though the evaluation considered in this report is not directly a software quality evaluation, the ISO standard provides a great starting point for evaluating conceptual modelling methods. The six different quality attributes distinguished by ISO/IEC 9126, being functionality, reliability, usability, efficiency, maintainability, and port-ability, will be briefly addressed, providing short definitions of these attributes as used in the IEEE Standards. As already mentioned, not all concepts described in ISO/IEC 9126 are di-rectly useful for this evaluation. Since the selected concepts are normally considered in a soft-ware environment, some of the selected attributes relate specifically to softsoft-ware, and are not
THEORETICAL EVALUATION suitable for evaluating a conceptual modelling method. The attributes that not suit conceptual modelling will be discussed first.
Reliability, specifically in its provided definition of “a system performing under stated con-ditions for a specific period of time”, is not considered, since the actual creation of a system or model is outside the (selected) scope of the method. Using the same reasoning, portability (“the ease with which a system or component can be transferred from one hardware or software environment to another.”) can be left out as well.
An important attribute that is not incorporated in the ISO/IEC 9126, but that might be interesting for this study, is flexibility. Although flexibility is to some extent related to porta-bility, it better fits the quality of process modelling methods. Flexibility is defined by the IEEE as “The ease with which a system or component can be modified for use in applications or environments other than those for which it was specifically designed.” (IEEE, 1990). The flex-ibility attribute thus takes into account whether the approach is usable in a variety environ-ments, or that it is constrained to specific environments or domains.
The complete list of quality attributes selected for this study can be found in Table 4.
Table 4 - Selected Quality Attributes
3.2
Claims by Developers
Literature of the selected methods is explored for quotes made by developers regarding aspects and attributes of their method. These quotes are coded and grouped using Grounded Theory Coding, after which claims can be defined. These claims are used to create a mapping of the selected methods to each other; such a mapping is essential for a fair comparison, as the meth-ods differ in origin, use, and goal.
The selection of articles will be discussed in section 3.2.1, the coding process will be dis-cussed in section 3.2.2, and the acquired claims are provided in section 3.2.3. Finally, section
Quality attribute Definition
Functionality A defined objective or characteristic action of a system or component.
Usability The ease with which a user can learn to operate, prepare inputs for, and interpret outputs of a system or component.
Efficiency The degree to which a system or component performs its designated functions with minimum consumption of resources.
Maintainability The ease with which a software system or component can be modified to correct faults, improve performance or other attributes, or adapt to a changed environment.
Flexibility The ease with which a system or component can be modified for use in applications or environments other than those for which it was specifically designed.
THEORETICAL EVALUATION number of claims not necessarily implies a ‘better’ method; additional claims merely indicate that more is studied (or at least claimed) by developers.
The following approach is used to determine the set of articles. First, the names of the different methods were inserted in the Google Scholar search engine. The articles that indeed related to the methods targeted in this study (using knowledge from previous search attempts, authors, and abstracts) were selected and sorted in a decreasing order of times cited. For each method, the two articles that were cited most were used as input for the Theoretical Evaluation. An exception is made for (Vanderfeesten, Reijers, & Van der Aalst, 2011): while (Vanderfeesten, Reijers, & Van der Aalst, 2008) was cited more often, it considered a conference proceeding, while another article from the same authors and with a (nearly) identical title was published in a journal. Table 5 provides an overview of the selected articles.
3.2.2 Coding the Articles
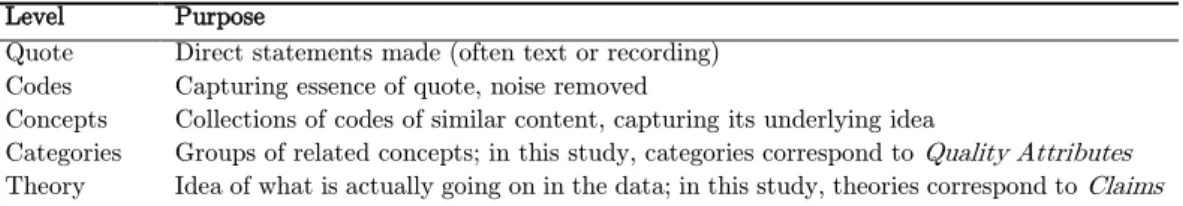
The articles selected in section 3.2.1 are studied and directly coded; codes capture the essence of quotes from the articles. This first ‘open coding’ helps understanding the article, while at the same time it initiates the coding process. Similar or identical codes can be grouped into concepts; these collections of codes describe the underlying idea of multiple codes. The final level in this coding hierarchy is obtained when similar concepts are grouped in order to obtain categories. Categories are special in this study, as they correspond to the quality attributes selected in section 3.1.2. For each of these categories (or ‘quality attributes’), theories (‘claims’) can be defined, using the different levels of coding as a guide. An overview of the used hierarchy of coding is provided in Table 6.
Method Year Article # Cited
DDPS (2007) Müller, D., Reichert, M., & Herbst, J. (2007). Data-Driven Modeling and Coordination of Large Process Structures. Lecture Notes in Computer Science, 4803, 131-149.
68 (2008) Müller, D., Reichert, M., & Herbst, J. (2008). A New Paradigm for the Enactment and
Dynamic Adaptation of Data-Driven Process Structures. Lecture Notes in Computer Sci-ence, 5074, 48-63.
59
PBWD (2003) Reijers, H., Limam, S., & Van der Aalst, W. (2003). Product-Based Workflow Design. Jour-nal of Management Information Systems, 20(1), 229-262.
120 (2011) Vanderfeesten, I., Reijers, H., & Van der Aalst, W. (2011). Product-Based Workflow
Sup-port. Information Systems, 36(2), 517-535.
48 ACPM (2003) Nigam, A., & Caswell, N. (2003). Business Artifacts: An Approach to Operational
Specifi-cation. IBM Systems Journal, 42(3), 428-445.
218 (2007) Bhattacharya, K., Gerede, C., Hull, R., Liu, R., & Su, J. (2007). Towards Formal Analysis
of Artifact-Centric Business Process Models. LNCS, 288-304.
146
Table 5 - Articles Used for Claims
Level Purpose
Quote Direct statements made (often text or recording) Codes Capturing essence of quote, noise removed
Concepts Collections of codes of similar content, capturing its underlying idea
Categories Groups of related concepts; in this study, categories correspond to Quality Attributes
Theory Idea of what is actually going on in the data; in this study, theories correspond to Claims Table 6 - Hierarchy of Coding
THEORETICAL EVALUATION Using this transparent approach, claims can be derived from text, while remaining all original information intact. The coding process is not only used for identifying internal similarities in a method; formed concepts can also be used externally, identifying topics addressed in multiple methods. The resulting set of claims for each method is grounded in literature, and can be used in the evaluation and comparison of the three data-centric methods. Please note that this theoretical evaluation itself is not intended to judge or rate the methods; its most important goal is to create a mapping of the methods to each other, thereby providing a basis for a fair empirical evaluation.
3.2.3 Acquired Claims
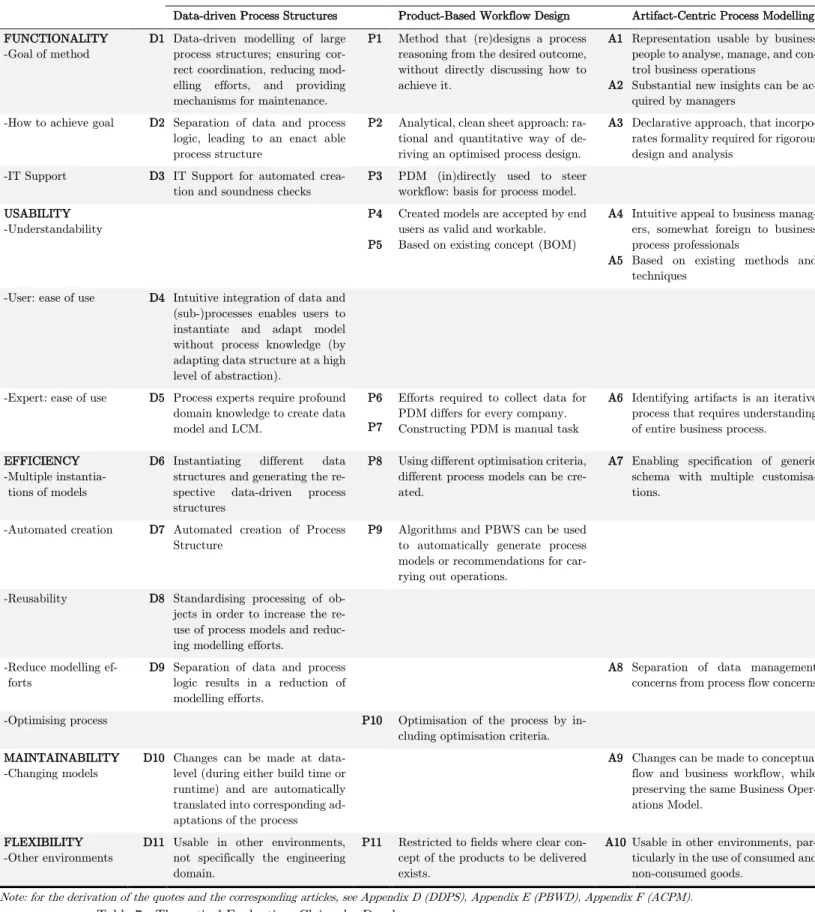
Table 7 contains all claims that were extracted from the literature, clustered to their corre-sponding quality attributes; note that this clustering neither adds nor removes information, as it merely proposes an order of representation of the selected claims. The original coding tables can be found in Appendix D (DDPS), Appendix E (PBWD), and Appendix F (ACPM). In order to enhance understanding of the set of claims provide in Table 7, some examples and interesting parts of the table will be highlighted.
From Table 7 one can for example deduce that with respect to Efficiency, all methods allow multiple instantiations of their models (see D6, P8, and A7). While Product-Based Workflow Design mentions the creation of different process models based on different optimisation crite-ria, Artifact-Centric Process Modelling and Data-Driven Process Structures stresses the spec-ification and instantiation of generic schemas with multiple customisations.
The claims that are allocated to Flexibility even show greater similarities; all developers claim that their method is applicable in other domains, though the developers of PBWD temper this by stating that a clear concept of the product should exist (claim P11).
Not all claims made by the developers are purely positive claims. For example claim D5 (attribute: Usability) addresses that experts should require profound business knowledge in order to be able to create the models used in the approach; this could be explained as negative, as creating the models becomes a task that can only be performed by some experts. It should therefore be noted that once these claims will be tested, one should carefully take into account whether the support/contradiction considers positive or negative statements.
The set of claims that is provided in Table 7 is most importantly intended to be in accord-ance with the selected literature; it might be that additions to this table could be made when additional articles were selected, or when the developers themselves were asked to provide input based on the given quality attributes. However, as the used articles were selected with great care and the claims were extracted in a comprehensive and structured manner, the set of claims should be at least representative.
THEORETICAL EVALUATION
Table 7 - Theoretical Evaluation: Claims by Developers
METHODS
Data-driven Process Structures Product-Based Workflow Design Artifact-Centric Process Modelling FUNCTIONALITY
-Goal of method
D1 Data-driven modelling of large process structures; ensuring cor-rect coordination, reducing mod-elling efforts, and providing mechanisms for maintenance.
P1 Method that (re)designs a process reasoning from the desired outcome, without directly discussing how to achieve it.
A1
A2
Representation usable by business people to analyse, manage, and con-trol business operations
Substantial new insights can be ac-quired by managers
-How to achieve goal D2 Separation of data and process logic, leading to an enact able process structure
P2 Analytical, clean sheet approach: ra-tional and quantitative way of de-riving an optimised process design.
A3 Declarative approach, that incorpo-rates formality required for rigorous design and analysis
-IT Support D3 IT Support for automated crea-tion and soundness checks
P3 PDM (in)directly used to steer workflow: basis for process model. USABILITY
-Understandability
P4
P5
Created models are accepted by end users as valid and workable. Based on existing concept (BOM)
A4
A5
Intuitive appeal to business manag-ers, somewhat foreign to business process professionals
Based on existing methods and techniques
-User: ease of use D4 Intuitive integration of data and (sub-)processes enables users to instantiate and adapt model without process knowledge (by adapting data structure at a high level of abstraction).
-Expert: ease of use D5 Process experts require profound domain knowledge to create data model and LCM.
P6 P7
Efforts required to collect data for PDM differs for every company. Constructing PDM is manual task
A6 Identifying artifacts is an iterative process that requires understanding of entire business process.
EFFICIENCY -Multiple
instantia-tions of models
D6 Instantiating different data structures and generating the re-spective data-driven process structures
P8 Using different optimisation criteria, different process models can be cre-ated.
A7 Enabling specification of generic schema with multiple customisa-tions.
-Automated creation D7 Automated creation of Process Structure
P9 Algorithms and PBWS can be used to automatically generate process models or recommendations for car-rying out operations.
-Reusability D8 Standardising processing of ob-jects in order to increase the re-use of process models and reduc-ing modellreduc-ing efforts.
-Reduce modelling ef-forts
D9 Separation of data and process logic results in a reduction of modelling efforts.
A8 Separation of data management concerns from process flow concerns
-Optimising process P10 Optimisation of the process by
in-cluding optimisation criteria. MAINTAINABILITY
-Changing models
D10 Changes can be made at data-level (during either build time or runtime) and are automatically translated into corresponding ad-aptations of the process
A9 Changes can be made to conceptual flow and business workflow, while preserving the same Business Oper-ations Model.
FLEXIBILITY -Other environments
D11 Usable in other environments, not specifically the engineering domain.
P11 Restricted to fields where clear con-cept of the products to be delivered exists.
A10 Usable in other environments, par-ticularly in the use of consumed and non-consumed goods.
THEORETICAL EVALUATION
3.2.4 Comparison
Table 7 can be used to compare the methods. Using the categories and concepts in the left column, one can pick a concept that is addressed by multiple methods, and compare the meth-ods on that concept. The high level description of the concept enables the comparison between methods. It should however be noted that the identified claims merely address the same con-cept; the exact contents of the claims might be different.
An example is provided in order to illustrate the described approach. Suppose one wants to know whether models should be created by hand or can be generated automatically. At the header Efficiency, one will find ‘Automated Creation’, and will see that at least to some extent the Data-Driven Process Structures and the Product-Based Workflow Design claim to provide some automated creation possibilities (and hence can be compared).
Two important notes should be made regarding the use of Table 7. Firstly, one should note that the concepts are defined using the selected articles. Therefore, the list of concepts might not be complete: the concepts should only be seen as a classification of the identified claims, an aid in reading the table and identifying similarities and differences. The second aspect to consider is that an empty cell in Table 7 does not necessarily imply that the method does not have any initiatives regarding this concept; the concept is merely not discussed in the selected articles. Though the selected articles should provide an objective and representative set of claims, it is possible that specific concepts are not addressed in the selected articles, and thereby not captured in Table 7.
EMPIRICAL EVALUATION
4
Empirical Evaluation
For the Empirical Evaluation of the three methods, workshops are used to acquire peoples’ perceptions and opinions about the selected methods. A total of three workshop sessions is conducted; in each of these sessions one of the methods is studied and discussed, thereby obtaining the participants impressions of the method.
This chapter addresses the approach used for this Empirical Evaluation, and is structured as follows: first, in section 4.1, the used methodology is discussed. Next, in section 4.2, the actual results of the Empirical Evaluation are provided. In Chapter 5 these results will be combined with the results from the Theoretical Evaluation.
4.1
Methodology
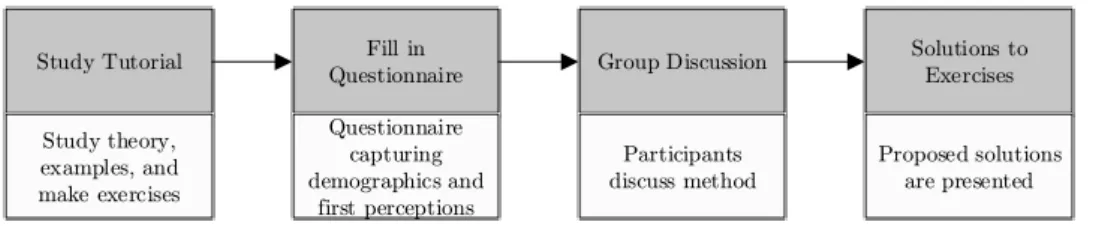
The three methods are evaluated in a workshop setting. The idea of these workshops is to provide participants with a tutorial of one of the methods, which the respondents have to study. Hereafter, a brief questionnaire is filled in, capturing participants’ first impressions, followed by a group discussion in which different strengths, weaknesses, ambiguities and im-provement opportunities are discussed among the participants. The workshop sessions conclude with discussing the solutions of the exercises. In addition to the three workshops, people unable to attend at one of the sessions were given the possibility to participate digitally, thereby only participating in the first two steps (the tutorial and questionnaire). See Figure 10 for an over-view of the layout of the workshops.
In each of this chapter’s following subsections, the different elements of the workshops are studied in greater detail: the tutorials (section 4.1.1), questionnaire (section 4.1.2), discussion questions (section 4.1.3), respondents (section 4.1.4), the workshop setup (section 4.1.5), and finally the approach to extract results from the discussion (section 4.1.6).
4.1.1 Tutorials
In order to provide the participants with sufficient knowledge to evaluate the different meth-ods, tutorials are created that should be clear and correct. The goal of the tutorials is not to provide a complete manual for the methods; instead it should be seen as a first introduction to the method, showing its ideas and opportunities. The tutorials are created to be self-ex-plaining; no input of the researcher during the workshops is required.
A first draft of the tutorials is created based on the existing literature. The tutorials are then revised by developers of the method, thereby ensuring that the contents of the tutorial are correct. After adjustments are made and additional information received from the devel-opers is included, two master students are asked to study the tutorials in order to identify any
Study Tutorial Fill in
Questionnaire Group Discussion
Solutions to Exercises Study theory, examples, and make exercises Questionnaire capturing demographics and first perceptions Participants discuss method Proposed solutions are presented
EMPIRICAL EVALUATION existing unclear sections or figures, which are then adapted or removed as well. The resulting tutorials are in this way approved on both content and understandability.
The tutorials are created using the following structure. First, a general description of the method is provided, defining the goal and approach used in the method. Next, the main con-cepts of the method, including all entities, models, and tables created, are described. An ex-ample is then used to illustrate the method, followed by a number of exercises to get some hands-on experience. This last part of the tutorial, that contains the exercises, is also used as information source for the empirical evaluation. The complete tutorials can be found in Ap-pendix A (DDPS), ApAp-pendix B (PBWD), and ApAp-pendix C (ACPM).
4.1.2 Questionnaire
A brief questionnaire is created that should be filled in directly after the tutorial is completed. The questionnaire consists of two parts: the first part addresses demographic traits of the participants and their experience with process modelling. These questions are based on the demographic questionnaire as used in the Cheetah Experimental Platform (Pinggera, Zugal, & Weber, 2010). Cheetah Experimental Platform is developed in order to foster experimental research on business process modelling; it enables the quick assembly of workflows, and in addition can include questionnaires, used for capturing additional data (e.g. demographic data). The questionnaire used for obtaining this demographic data, was provided by one of Cheetah’s experts. This part of the questionnaire provides insights into the composition of the group of participants, as well as into their previous experience with modelling and with differ-ent modelling methods.
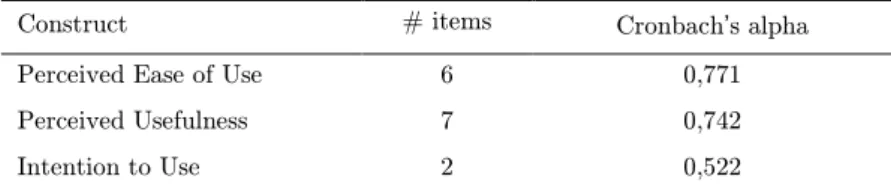
The second part of the questionnaire focuses on the first impressions regarding perceived ease of use, perceived usefulness, and intention to use, as proposed in (Moody, 2003). This section of the questionnaire thus captures the respondents’ first impressions of the method, before discussing any of the methods’ aspects with the other participants. It thereby provides a good impression of the respondents’ perceptions of the method, based on the tutorial alone. The complete questionnaire can be found in Appendix G.
4.1.3 Discussion questions
After the tutorial and questionnaire, discussion questions are proposed to share and discuss ideas among the participants. As the participants in a single workshop session all received an identical tutorial, they can discuss their own interpretation of any ambiguities present. The discussion will thereby capture the interpretations of the participants; the way they think the method is intended or should function best. In order to facilitate a structured analysis, all discussions are recorded such that they can be literally analysed in a later stadium.