School of Computing and Information Sciences
College of Engineering and Computing
9-16-2008
Gene selection algorithm by combining relief F and
mRMR
Yi Zhang
School of Computing and Information Sciences, Florida International University, [email protected]
Chris Ding
University of Texas at Arlington
Tao Li
School of Computing and Information Sciences, Florida International University, [email protected]
Follow this and additional works at:
http://digitalcommons.fiu.edu/cs_fac
Part of the
Computer Sciences Commons
This work is brought to you for free and open access by the College of Engineering and Computing at FIU Digital Commons. It has been accepted for inclusion in School of Computing and Information Sciences by an authorized administrator of FIU Digital Commons. For more information, please
Recommended Citation
Zhang, Yi; Ding, Chris; and Li, Tao, "Gene selection algorithm by combining relief F and mRMR" (2008).School of Computing and Information Sciences. 11.
BioMedCentral
BMC Genomics
Open Access
Research
Gene selection algorithm by combining reliefF and mRMR
Yi Zhang
1, Chris Ding
2and Tao Li*
1Address: 1School of Computer Science, Florida International University, 11200 SW 8th Street, Miami, FL, 33199, USA and 2Department of
Computer Science and Engineering, University of Texas at Arlington, 416 Yates Street, Arlington, TX, 76019, USA Email: Yi Zhang - [email protected]; Chris Ding - [email protected]; Tao Li* - [email protected]
* Corresponding author
Abstract
Background: Gene expression data usually contains a large number of genes, but a small number of samples. Feature selection for gene expression data aims at finding a set of genes that best discriminate biological samples of different types. In this paper, we present a two-stage selection algorithm by combining ReliefF and mRMR: In the first stage, ReliefF is applied to find a candidate gene set; In the second stage, mRMR method is applied to directly and explicitly reduce redundancy for selecting a compact yet effective gene subset from the candidate set.
Results: We perform comprehensive experiments to compare the mRMR-ReliefF selection algorithm with ReliefF, mRMR and other feature selection methods using two classifiers as SVM and Naive Bayes, on seven different datasets. And we also provide all source codes and datasets for sharing with others.
Conclusion: The experimental results show that the mRMR-ReliefF gene selection algorithm is very effective.
Background
Gene expression refers to the level of production of pro-tein molecules defined by a gene. Monitoring of gene expression is one of the most fundamental approach in genetics and molecular biology. The standard technique for measuring gene expression is to measure the mRNA instead of proteins, because mRNA sequences hybridize with their complementary RNA or DNA sequences while this property lacks in proteins. The DNA arrays, pioneered in [1,2], are novel technologies that are designed to meas-ure gene expression of tens of thousands of genes in a sin-gle experiment. The ability of measuring gene expression
for a very large number of genes, covering the entire genome for some small organisms, raises the issue of char-acterizing cells in terms of gene expression, that is, using gene expression to determine the fate and functions of the cells. The most fundamental of the characterization prob-lem is that of identifying a set of genes and its expression patterns that either characterize a certain cell state or pre-dict a certain cell state in the future [3].
When the expression dataset contains multiple classes, the problem of classifying samples according to their gene expression becomes much more challenging, especially
from IEEE 7th International Conference on Bioinformatics and Bioengineering at Harvard Medical School Boston, MA, USA. 14–17 October 2007
Published: 16 September 2008
BMC Genomics 2008, 9(Suppl 2):S27 doi:10.1186/1471-2164-9-S2-S27
<supplement> <title> <p>IEEE 7<sup>th </sup>International COnference on Bioinformatics and Bioengineering at Harvard Medical School</p> </title> <editor>Mary Qu Yang, Jack Y Yang, Hamid R Arabnia and Youping Deng</editor> <note>Research</note> <url>http://www.biomedcentral.com/content/pdf/1471-2164-9-S2-info.pdf</url> </supplement> This article is available from: http://www.biomedcentral.com/1471-2164/9/S2/S27 © 2008 Zhang et al; licensee BioMed Central Ltd.
This is an open access article distributed under the terms of the Creative Commons Attribution License (http://creativecommons.org/licenses/by/2.0), which permits unrestricted use, distribution, and reproduction in any medium, provided the original work is properly cited.
when the number of classes exceeds five [4]. Moreover, the special characteristics of expression data adds more challenge to the classification problem. Expression data usually contains a large number of genes (in thousands) and a small number of experiments (in dozens). In machine learning terminology, these datasets are usually of very high dimensions with undersized samples. In microarray data analysis, many gene selection methods have been proposed to reduce the data dimensionality [5].
Gene selection aims to find a set of genes that best dis-criminate biological samples of different types. The selected genes are "biomarkers", and they form "marker panel" for analysis. In general, two types of gene selection methods have been studied in the literature: filter meth-ods [6] and wrapper methmeth-ods [7]. As pointed out in [8], the essential differences between the two methods are: (1) that a wrapper method makes use of the algorithm that will be used to build the final classifier while a filter method does not, and
(2) that a wrapper method uses cross validation to com-pare the performance of the final classifier and searches for an optimal subset while a filter method uses simple statistics computed from the empirical distribution to select attribute subset.
Wrapper methods could perform better but would require much more computational costs than filter methods. Most gene selection schemes are based on binary discrim-ination using rank-based schemes [9], such as informa-tion gain, which reduces the entropy of the class variables given the selected attributes. In expression data, many gene groups interact closely and gene interactions are important biologically and may contribute to class dis-tinctions. However, the majority of the rank-based schemes assume the conditional independence of the attributes given the target variable and are thus not effec-tive for problems involving much feature interaction [10]. In this paper, we present a two-stage selection algorithm by combining ReliefF [10] and mRMR [11]. ReliefF, a gen-eral and successful attribute estimator, is able to effec-tively provide quality estimates of attributes in problems with dependencies between attributes. mRMR (minimal-redundancy-maximal-relevance) method selects genes that have the highest relevance with the target class and are also maximally dissimilar to each other. mRMR is computationally expensive. The integration of ReliefF and mRMR thus leads to an effective gene selection scheme. In the first stage, ReliefF is applied to find a candidate gene set. This filters out many unimportant genes and reduces the computational load for mRMR. In the second stage,
mRMR method is applied to directly and explicitly reduce redundancy and select a compact yet effective gene subset from the candidate set. We perform comprehensive exper-iments to compare the mRMR-ReliefF selection algorithm with ReliefF, mRMR and other feature selection methods using two classifiers on seven different datasets. The exper-imental results show that the mRMR-ReliefF gene selec-tion is very effective.
Result and discussion
In this section, we perform comprehensive experiments to compare the mRMR-ReliefF selection algorithm with Reli-efF, mRMR and other feature selection methods using two classifiers (Support Vector Machine (SVM) and Naive Bayes (NB)) on seven different datasets.
Datasets description
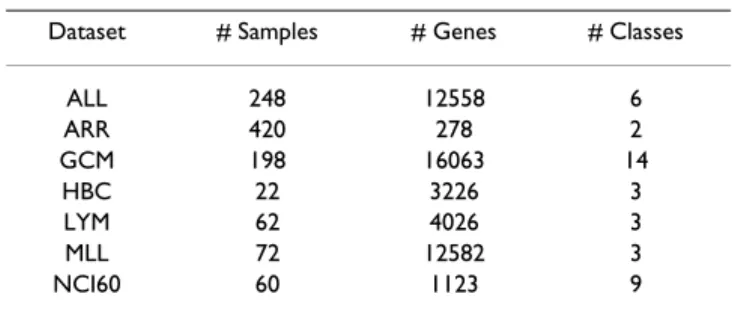
The datasets and their characteristics are summarized in Table 1.
• ALL: The ALL dataset [12] is a dataset that covers six sub-types of acute lymphoblastic leukemia: BCR (15), E2A (27), Hyperdip (64), MLL (20), T (43), and TEL (79). Here the numbers in the parentheses are the numbers of samples. The dataset is available at [13].
• ARR: The Arrhythmia (ARR) dataset contains 420
sam-ples and 278 features with two classes [14].
• GCM: The GCM dataset [15] consists of 198 human
tumor samples of fifteen types. breast (12), prostate (14), lung (12), colorectal (12), lymphoma (22), bladder (11), melanoma (10), uterus (10), leukemia (10), renal (11), pancreas (11), ovary (120), mesothelioma (11), CNS (20), and MET (9). The prediction accuracy of 78% is reported in [15] using one-versus-the rest SVM with all the genes.
• HBC: The HBC dataset consists of 22 hereditary breast
cancer samples and was first studied in [16]. The dataset has three classes and can be downloaded at [17].
Table 1: The dataset description.
Dataset # Samples # Genes # Classes
ALL 248 12558 6 ARR 420 278 2 GCM 198 16063 14 HBC 22 3226 3 LYM 62 4026 3 MLL 72 12582 3 NCI60 60 1123 9
BMC Genomics 2008, 9(Suppl 2):S27 http://www.biomedcentral.com/1471-2164/9/S2/S27
• LYM: The Lymphoma dataset is a dataset of the three
most prevalent adult lymphoid malignancies and availa-ble at [18] and it was first studied in [19].
• MLL: The MLL-leukemia dataset consists of three classes and can be downloaded at [20].
• NCI60: The NCI60 dataset was first studied in [21]. cDNA microarrays were used to examine the variation in gene expression among the 60 cell lines from the National Center Institute's anticancer drug screen. The dataset spans nine classes and can be downloaded at [17,22]. Note that in these datasets, the samples in each class is generally small, and unevenly distributed. This, together with the large number of classes, especially for NCI60, GCM, makes the classification task more complex.
Compare ReliefF, mRMR and mRMR-ReliefF algorithm
First we compare the mRMR-ReliefF algorithm with Reli-efF and mRMR. We perform our comparisons using SVM and NB classifiers on the seven datasets. Both SVM and NB have been widely used in previous studies. Figure 1 and Figure 2 show the classification accuracy results as a func-tion of the number of selected genes on the seven datasets respectively. In addition, because of mRMR is computa-tionally expensive, using the program provided in [11], we could not obtain results for several datasets with a large number of genes, e.g., ALL and GCM. Thus in the fig-ures, we only include the accuracy values for ReliefF and the mRMR-ReliefF algorithm and these values are all obtained via 10-fold cross validation.
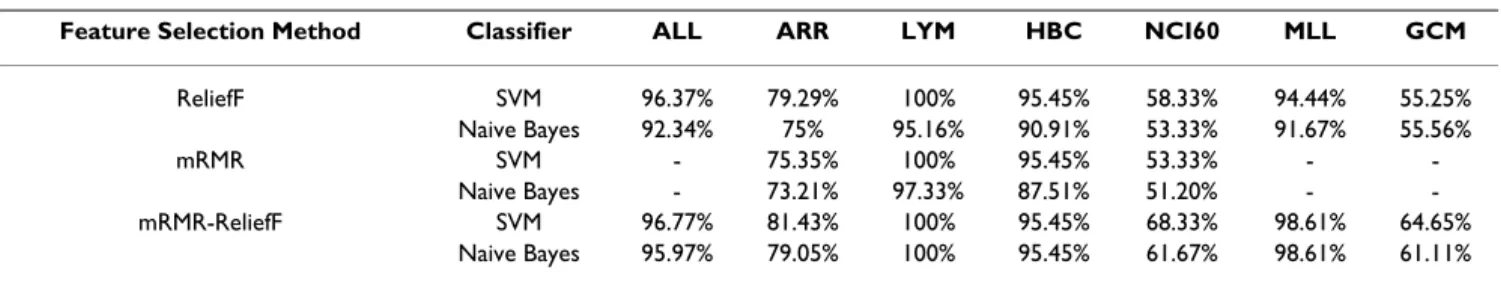
Table 2 presents the detail of the accuracy values of apply-ing SVM and NB classification on the top 30 selected genes, for some unavailable results which can not be com-puted by mRMR, we note them as "-". From the above comparative study, we observe that:
• The performance of mRMR algorithm is pulled down by its expensive computational cost, and it can not fulfill gene selection on the database with large features using the limited memory.
• Relief algorithm is not stable enough when only a small number of genes are selected. And when the number of selected genes is greater than 30, the variations of classifi-cation performance of both ReliefF and mRMR-ReliefF algorithms are generally small.
• The mRMR-ReliefF selection algorithm leads to signifi-cantly improved class predictions. With the same number of selected genes, the gene set obtained by the mRMR-ReliefF selection is more representative of the target class,
therefore leading to better class prediction or generaliza-tion property.
Comparison with other methods
We also compare our mRMR-ReliefF selection algorithm with other gene selection algorithms, including Max-Rele-vance, Information Gain, Sum Minority, Twoing Rule, F-statistic [23], and GSNR [24]. Table 3 presents the classifi-cation accuracy comparison using SVM and NB classifier based on the selected genes using these six feature selec-tion methods, when the number of selected gene is 30. From Table 3, we observe that:
• Gene selection improves class prediction. Note that the accuracy of SVM using feature selection generally outper-forms that without feature selection. This implies that fea-ture selection can effectively reduce the insignificant dimensions and noise to improve classification accuracy. • The mRMR-ReliefF algorithm is shown to achieve better performance comparing with other gene selection algo-rithms on almost all datasets. The experimental compari-sons demonstrate the effectiveness of the integration of ReliefF and mRMR.
• ReliefF achieves good performance on most of the data sets. Although its performance is not always as good as that of the mRMR-ReliefF algorithm. It outperforms mRMR, Maxrel, Sum Minority and partially wins informa-tion gain, twoing rule.
• Only a small number of genes are needed for classifica-tion purpose. In our experiments, the variaclassifica-tions of the classification accuracy are small when the number of selected genes is greater than 30.
Software package
We have developed a software package for the above experiments, which includes: 1) The source codes for four feature selection algorithms including ReliefF, F-statistic, GNSR, and Relief-mRMR; 2) A MATLAB interface for Rankgene1.1 [5] which contains another eight feature selection measures; 3) A MATLAB interface for two well-known classification tools (e.g., LIBSVM and WEKA); 4) Programs for converting data formats; 5) The collection of all datasets used in the experiments. We hope it is a useful tool in gene expression analysis and feature selection. This package and all datasets can be downloaded from http://www.cis.fiu.edu/~yzhan004/genesel.html. All codes are implemented and tested in Matlab 7.0 and can be integrated into the Toolbox by adding its path to MAT-LAB search path.
Comparison of ReliefF and mRMR-ReliefF algorithms I
Figure 1
Comparison of ReliefF and mRMR-ReliefF algorithms I. This figure describes the two classifications (SVM and NB) results using 3 to 60 selected genes, for HBC, Lymphoma, MLL, and NCI60 datasets. From this figure, it is easy to know that in the same number of selected genes, the performance of mRMR-ReliefF algorithm is obviously better than ReliefF algorithm.
BMC Genomics 2008, 9(Suppl 2):S27 http://www.biomedcentral.com/1471-2164/9/S2/S27
Data structure and translation
This package supports consistent data formats. Each gene dataset is formatted as a MATLAB data structure file(.mat), in which a class label vector corresponds to a gene array. For any algorithm, the input is a .mat file, and the output
is an index vector for the selected genes. Furthermore, a utility is provided for converting the data from .csv file to .mat file. The command line is as follows.
csvtomat(Filename)
Comparison of ReliefF and mRMR-ReliefF algorithms II
Figure 2
Comparison of ReliefF and mRMR-ReliefF algorithms II. This figure describes the two classifications (SVM and NB) results using 3 to 60 selected genes, for GCM, ALL, and ARR datasets. From this figure, it is easy to know that in the same number of selected genes, the performance of mRMR-ReliefF algorithm is obviously better than ReliefF algorithm.
where Filename is the name of .csv file. In the .csv file, the first column is the class label, the rest are gene variables. For .mat file, its structure can be shown as Figure 3: We also provide the function to convert .mat file to .csv file as:
mattocsv(X, y, Filename)
where X, y are the matrix defined in .mat file and Filename is the .csv file as output file.
Implementation of gene selection algorithms
The command list to perform different gene selection algorithms is shown in Table 4, where X is a gene array, y is a class label vector, and Topn is the number of selected genes in current algorithm. For ReliefF function, n is the number of iterations, K is the number of neighbors to be selected, and typed is the data type; for the Rankgene
func-tion, and T is the method index which can be referenced
in rankgene1.1.
Assistant tools for classification
To compare the performance of the gene selection algo-rithms, we also include two popular classification tools in this software package, which are the existing MATLAB ver-sion for LIBSVM [25] and a MATLAB Interface for WEKA [26]. For LIBSVM, there is already a ready-to-run plug-in for MATLAB. And we implement the function for calling WEKA. The command line for calling WEKA is shown as follows.
where Filename is the name of the output .csv file, X is a gene array, y is a label vector, and Classifier is the parame-ter for classification method, such as Naive Bayes and J4.5 tree.
Conclusion
In this paper, we present an mRMR-ReliefF selection algo-rithm by combining ReliefF and mRMR. ReliefF is able to effectively provide quality estimates of attributes in prob-lems with dependencies between attributes and mRMR
mattocsv wekaclassifier
( , , )
( ,
X y Filename
Accuracy= Filename Classsifier)
Table 2: The comparisons in ReliefF, mRMR and mRMR-ReliefF algorithms (gene number = 30)
Feature Selection Method Classifier ALL ARR LYM HBC NCI60 MLL GCM
ReliefF SVM 96.37% 79.29% 100% 95.45% 58.33% 94.44% 55.25% Naive Bayes 92.34% 75% 95.16% 90.91% 53.33% 91.67% 55.56% mRMR SVM - 75.35% 100% 95.45% 53.33% - -Naive Bayes - 73.21% 97.33% 87.51% 51.20% - -mRMR-ReliefF SVM 96.77% 81.43% 100% 95.45% 68.33% 98.61% 64.65% Naive Bayes 95.97% 79.05% 100% 95.45% 61.67% 98.61% 61.11%
Table 3: The comparisons in seven gene selection methods (gene number = 30).
Feature Selection Method Classifier ALL ARR LYM HBC NCI60 MLL GCM
No feature sel SVM 91.94% 51.04% 95.16% 77.27% 63.33% 97.22% 51.52% Naive Bayes 85.23% 49.57% 95.04% 70.11% 45.22% 93.13% 40.33% mRMR-ReliefF SVM 96.77% 81.43% 100% 95.45% 68.33% 98.61% 64.65% Naive Bayes 95.97% 79.05% 100% 95.45% 61.67% 98.61% 61.11% Maxrel SVM 89.11% 74.53% 100% 72.73% 51.67% 77.78% 60.61% Naive Bayes 88.71% 73.49% 100% 63.64% 48.33% 80.56% 46.97% Information Gain SVM 97.58% 80.13% 98.39% 100% 61.67% 98.67% 46.67% Naive Bayes 92.74% 77.21% 93.55% 86.38% 60% 97.22% 47.47% Sum Minority SVM 93.95% 76.42% 98.39% 95.45% 55% 90.28% 55.05% Naive Bayes 91.13% 74.32% 95.16% 81.82% 46.67% 91.67% 49.49% Twoing Rule SVM 96.77% 79.37% 98.39% 90.91% 61.67% 97.22% 45.96% Naive Bayes 90.32% 72.19% 93.55% 86.36% 45% 95.83% 46.46% F-statistic SVM 97.17% 67.12% 96.77% 90.91% 63.33% 77.22% 39.10% Naive Bayes 80.27% 71.55% 98.52% 85.41% 60.15% 80.13% 39.81% GSNR SVM 93.18% 77.24% 100% 95.45% 63.37% 90.25% 40.74% Naive Bayes 90.11% 70.43% 100% 85.65% 58.25% 87.22% 39.81%
This table shows the classification results based on the 30 genes, which are selected from 7 different datasets using seven feature selection methods, named mRMR-ReliefF, Maxrel, information gain, sum minority, twoing rule, F-statistic, GSNR.
BMC Genomics 2008, 9(Suppl 2):S27 http://www.biomedcentral.com/1471-2164/9/S2/S27
method selects genes that have the highest relevance with the target class and are also maximally dissimilar to each other. The integration of ReliefF and mRMR thus leads to an effective gene selection scheme: In the first stage, Reli-efF is applied to find a candidate gene set; In the second stage, mRMR is applied to select a compact yet effective gene subset from the candidate set.
Comprehensive experiments are conducted to compare the mRMR-ReliefF selection algorithm with ReliefF, mRMR and other feature selection methods using two classifiers on seven different datasets. The experimental results show that the mRMR-ReliefF gene selection is very effective. In addition, we also developed a software pack-age to help other researches explore gene expression.
Methods
In this part, firstly, ReliefF and mRMR algorithms are dis-cussed, then mRMR-ReliefF selection algorithm is pre-sented, and finally, other six gene selection algorithms used to compare with our mRMR-ReliefF algorithm are introduced.
ReliefF
ReliefF is a simple yet efficient procedure to estimate the quality of attributes in problems with strong dependen-cies between attributes [10]. In practice, ReliefF is usually applied in data pre-processing as a feature subset selection method.
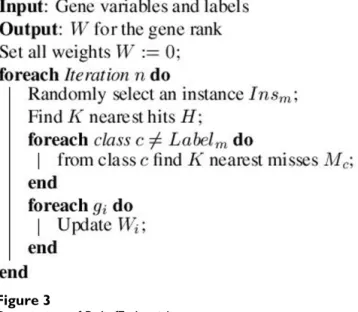
The key idea of the ReliefF is to estimate the quality of genes according to how well their values distinguish between instances that are near to each other. Given a ran-domly selected instance Insm from class L, ReliefF searches for K of its nearest neighbors from the same class called nearest hits H, and also K nearest neighbors from each of
the different classes, called nearest misses M. It then
updates the quality estimation Wi for gene i based on their
values for Insm, H, M. If instance Insm and those in H have different values on gene i, then the quality estimation Wi is decreased. On the other hand, if instance Insm and those in M have different values on the the gene i, then Wi is increased. The whole process is repeated n times which is set by users. The algorithm is shown in Figure 4 and updating Wi can use Equation 1:
where nc is the number of instances in class c, DH (or ) is
the sum of distance between the selected instance and each H (or Mc), Pc is the prior probability of class c. Detailed discussions on ReliefF can be found in [10] and recently, it was shown that ReliefF is an on-line solution to a convex optimization problem, maximizing a margin-based algorithm [27]. W W DH k K n K P DMc k K n K i i c c C = − = ∑ ⋅ + ⋅ = ∑ ⋅ = −
∑
1 1 1 1 (1) DMcThe data structure description for software package
Figure 4
The data structure description for software package.
X is the gene array with 62 genes and 4026 expression varia-bles. y is the label for each gene.
Table 4: MATLAB Command List For Gene Selection.
Algorithm Description Command Line
ReliefF W = reliefF(X, y, n, K, typed, Topn) F-statistic W = Ftest(X, y, Topn)
GNSR W = Gsnr(X, y, Topn)
ReliefF-mRMR W = rm(X, y, n, K, Topn) Rankgene W = rankgene(X, y, T, Topn) This table shows MATLAB commands for the feature selection algorithms, which are ReliefF, F-statistic, GNSR, ReliefF-mRMR, and all algorithms included in Rankgene.
Description of ReliefF algorithm
Figure 3
mRMR
The mRMR (minimum redundancy maximum relevance) method [11] selects genes that have the highest relevance with the target class and are also minimally redundant, i.e., selects genes that are maximally dissimilar to each other. Given gi which represents the gene i, and the class label c, their mutual information is defined in terms of their frequencies of appearances p(gi), p(c), and p(gi, c) as follows.
The Maximum-Relevance method selects the top m genes
in the descent order of I(gi, c), i.e. the best m individual
features correlated to the class labels.
Although we can choose the top individual genes using Maximum-Relevance algorithm, it has been recognized that "the m best features are not the best m features" since the correlations among those top features may also be high [28]. In order to remove the redundancy among fea-tures, a Minimum-Redundancy criteria is introduced
where mutual information between each pair of genes is taken into consideration. The minimum-redundancy maximum-relevance (mRMR) feature selection frame-work combines both optimization criteria of Eqs.(3, 4). A sequential incremental algorithm to solve the simulta-neous optimizations of optimization criteria of Eqs.(3, 4) is given as the following. Suppose set G represents the set of genes and we already have Sm-1, the feature set with m -1 genes. Then the task is to select the m-th feature from the set {G - Sm-1}. This feature is selected by maximizing the single-variable relevance minus redundancy function
The m-th feature can also be selected by maximizing the
single-variable relevance divided-by redundancy function
mRMR-ReliefF algorithm
As we mentioned before, ReliefF is a general and success-ful attribute estimator and is able to effectively provide
quality estimates of attributes in problems with depend-encies between attributes. However, ReliefF does not explicitly reduce the redundancy in selected genes. mRMR selects genes that have the highest relevance with the tar-get class and are also maximally dissimilar to each other. However, mRMR is computationally expensive. For exam-ple, using the mRMR program provided in [11], we could not obtain results for several datasets with a large number of genes, e.g., ALL and GCM. The integration of ReliefF and mRMR thus leads to an effective gene selection scheme.
We can view the quality estimation Wi in ReliefF as maxi-mizing the relevance score. Thus we can view the standard ReliefF algorithm as maximizing the relevance score:
Thus our mRMR-ReliefF algorithm selection criteria becomes
or
where C(gj, gi) is the Pearson correlation coefficient. Our mRMR-ReliefF algorithm works as follows: In the first stage, ReliefF is applied to find a candidate gene set. This filters out many unimportant genes and reduces the com-putational load for mRMR. In the second stage, mRMR method is applied to directly and explicitly reduce redun-dancy and select a compact yet effective gene subset from the candidate set.
In our experiments, ReliefF is first used to choose 150 genes as the candidate set. from the all gene data. mRMR algorithm is then applied to select the final subset.
Other gene selection algorithms
In this part, we introduce six other gene selection algo-rithms which are mentioned in the chapter of "Result and discussion", which are named Max-Relevance, Informa-tion Gain, Sum Minority, Twoing Rule, F-statistic [23], and GSNR [24]. These methods have been reported in pre-vious work. The first four methods have been used either in machine learning (information gain) or in statistical learning theory (twoing rule and sum minority), and all of them measure the effectiveness of a feature by evaluating the strength of class prediction when the prediction is I g c p g c p gi c p gi p c dg dc i i i ( , ) ( , ) ln ( , ) ( ) ( ) =
∫
(2) max ( ; ) S i g S S I g c i 1 ∈∑
(3) min ( , ) , S i j g g S S I g g i j 1 2 ∈∑
(4) max [ ( ; ) ( ; )] g G S i j i g S j m i m I g c m I g g ∈ − ∈ − − − −∑
1 1 1 1 (5) max [ ( ; ) / ( ; )] g G S i j i g S j m i m I g c m I g g ∈ − ∈ − − −∑
1 1 1 1 (6) max S i g S S W i 1 ∈∑
(7) max | ( , ) | g G S i j i g S j m i m W m C g g ∈ − ∈ − − − −∑
1 1 1 1 (8) max / | ( , ) | g G S i j i g S j m i m W m C g g ∈ − ∈ − − −∑
1 1 1 1 (9)BMC Genomics 2008, 9(Suppl 2):S27 http://www.biomedcentral.com/1471-2164/9/S2/S27
made by splitting it into two regions, the high region and the low region, by considering all possible split points [5]. More detailed descriptions on these methods can be found in [5].
F-statistic is chosen to score the relevance between the genes and the classification variable. The F-statistic of gene i in C classes has the following form [23]:
where C is the number of classes, is the mean of gene i variables, nc is the number of samples in class c, is the
mean of gene i in class c, and gjic is sample j in gene i value in class c.
As to GSNR, it has been proposed and used in [24]. GSNR is a measure of the ratio between inter-group and intra-group variations. Higher GSNR values indicate higher dis-crimination power for the gene. The GSNR value for gene i is given by:
Both F-statistic and GSNR select m genes in the descent
order of Wi, and the best subset of genes is satisfied the following description:
Competing interests
T. Li is partially supported by NSF CAREER Award IIS-0546280 and NIH/NIGMS S06 GM008205. C. Ding is partially supported by a University of Texas STAR Award.
Authors' contributions
T. Li and C. Ding initialized the idea and supervised the project. Y. Zhang implemented the algorithms, developed the software, performed experimental comparisons, and built the website. All authors have read and approved the manuscript.
Acknowledgements
We would like to thank Ms D. Wang for assisting with the experiments on several gene selection algorithms. We are also grateful to the anonymous reviewers for their helpful comments.
This article has been published as part of BMC Genomics Volume 9 Supple-ment 2, 2008: IEEE 7th International Conference on Bioinformatics and Bio-engineering at Harvard Medical School. The full contents of the supplement are available online at http://www.biomedcentral.com/1471-2164/ 9?issue=S2
References
1. Chee M, Yang R, Hubbell E, Berno A, Huang X, Stern D, Winkler J, Lockhart D, Morris M, Fodor S: Accessing genetic information with high density DNA arrays. Science 1996, 274:610-614. 2. Fodor S, Read J, Pirrung M, Stryer L, Lu A, Solas D: Light-directed,
spatially addressable parallel chemical synthesis. Science 1991, 251:767-783.
3. Li T, Zhang C, Ogihara M: A comparative study of feature selec-tion and multiclass classificaselec-tion methods for tissue classifi-cation based on gene expression. Bioinformatics 2004, 20:2429-2437.
4. Ooi C, Tan P: Genetic algorithms applied to multi-class pre-diction for the analysis of gene expression data. Bioinformatics 2003, 19:37-44.
5. Su Y, Muralin TM, Pavlovic V, Kasif S: Rankgene: Identification of diagnostic genes based on expression data. Bioinformatics 2003, 19:1578-1579.
6. Langley P: Selection of relevant features in machine learning.
AAAI Fall Symposium on Relevance 1994:140-144.
7. Kohavi P, John GH: Wrappers for feature subset selection. Arti-ficial Intelligence 1997, 97:273-324.
8. Xing EP, Jordan MI, Karp RM: Feature selection for high-dimen-sional genomic microarray data. Proc 18th International Conf on Machine Learning 2001:601-608.
9. Dudoit S, Fridlyand J, Speed TP: Comparison of discrimination methods for the classification of tumors using gene expres-sion data. Journal of the American Statistical Association 2002, 97:77-87.
10. Marko RS, Igor K: Theoretical and empirical analysis of relief and rreliefF. Machine Learning Journal 2003, 53:23-69.
11. Peng H, Long F, Ding C: Feature selection based on mutual information: Criteria of max-dependency, max-relevance, and min-redundancy. IEEE Trans Pattern Anal and Mach Intell. 2005, 27:1226-1238.
12. Yeoh EJ, Ross ME, Shurtleff SA, Williams WK, Patel D, Mahrouz R, Behm FG, Raimondi SC, Relling MV, Patel A, Cheng C, Campana D, Wilkins D, Zhou X, Li J, Liu H, Pui CH, Evans WE, Naeve C, Wong L, Downing JR: Classification, subtype discovery, and prediction of outcome in pediatric lymphoblastic leukemia by gene expression profiling. Cancer Cell 2002, 1:133-143.
13. ALL Gene Expression Profiles [http://www.stjuderesearch.org/ data/ALL1/]
14. Arr Gene Expression Profiles [http://www.ics.uci.edu/mlearn/ MLSummary.html]
15. Ramaswamy S, Tamayo P, Rifkin R, Mukherjee S, Yeang CH, Angelo M, Ladd C, Reich M, Latulippe E, Mesirov JP, Poggio T, Gerald W, Loda M, Lander ES, Golub TR: Multiclass cancer diagnosis using tumor gene expression signatures. Proceeding of the National Academy of Sciences 2001, 98:15149-15154.
16. Hedenfalk I, Duggan D, Yidong C, Radmacher M, Bittner M, Simon R, Meltzer P, Gusterson B, Esteller M, Kallioniemi OP, B BW, Borg A, Trent J: Gene-expression profiles in hereditary breast cancer.
The New England Journal of Medcine 2001, 344:539-548.
17. HBC Gene Expression Profiles [http://www.columbia.edu/ ~xy56/project.htm]
18. LYM Gene Expression Profiles [http://genome-www.stan ford.edu/lymphoma]
19. Alizadeh AA, Eisen MBRE, Ma C, Lossos IS, Osenwald AR, Boldrick HC, Sabet H, Tran T, Yu X, Powell JI, Yang L, Martu GE, Moore T, Hudson J, Lu L, Lewis DB, Tibshirani R, Sherlock G, Chan WC, Greiner TC, Weisenburger DD, Armitage GP, Warnke R, Levy R, Wilson W, Grever MR, Byrd JC, Botsten D, Brown PO, Staudt LM:
W nc gic gi C c C nc c C g jic gic nc n C i= ⋅
(
−)
(
−)
= ∑ − = ∑ − − / {( )[ ( ) / ] /( 1 1 1 1 2 ))} i nc = ∑ 1 ( ) gi gic W g jc g jc C C c C c C g jic gic nc i nc i C i = − = ∑ = ∑ − = ∑ = ∑ | / |/ | |/ 1 1 1 1 (11) max S i g S S W i 1 ∈∑
(12)Publish with BioMed Central and every scientist can read your work free of charge "BioMed Central will be the most significant development for disseminating the results of biomedical researc h in our lifetime."
Sir Paul Nurse, Cancer Research UK
Your research papers will be:
available free of charge to the entire biomedical community peer reviewed and published immediately upon acceptance cited in PubMed and archived on PubMed Central yours — you keep the copyright
Submit your manuscript here:
http://www.biomedcentral.com/info/publishing_adv.asp
BioMedcentral Distinct types of diffuse large B-cell lymphoma identified by
gene expression profiling. Nature 2000, 403:503-511.
20. MLL Gene Expression Profiles [http://research.dfci.harvard.edu/ korsmeyer/MLL.htm]
21. Ross DT, Scherf U, Eisen MB, Perou CM, Rees C, Spellmand P, Iyer V, Jeffrey SS, Van M, Waltham M, Pergamenschikov M, Lee JC, Lashkari D, Shalon D, Myers TG, Weinstein JN, Botstein D, Brown MPO: Sys-tematic variation in gene expression patterns in human can-cer cell lines. Nature Genetics 2000, 24:227-235.
22. NCI60 Cancer Microaray Project [http://genome-www.stan ford.edu/nci60/]
23. Ding C, Peng H: Minimum redundancy feature selection from microarray gene expression data. International Conference on Computational Systems Bioinformatics 2003:523-528.
24. Zheng G: Statistical analysis of biomedical data with emphasis on data integration. In phD thesisFlorida International University; 2006.
25. LIBSVM Software [http://www.csie.ntu.edu.tw/~cjlin/libsvm/] 26. Weka Software [http://www.cs.waikato.ac.nz/ml/weka/] 27. Sun Y, Li J: Iterative RELIEF for feature weighting: algorithms,
theories and applications. Proceedings of the 23rd International Con-ference on Machine Learning 2006, 29:1035-1051.
28. Cover T: The best two independent measurements are not the two best. IEEE Trans Systems, and Cybernetics 1974, 4:116-117.