http://siba-ese.unisalento.it/index.php/ejasa/index
e-ISSN: 2070-5948
DOI: 10.1285/i20705948v10n1p242
An efficient gene selection method for high-dimensional microarray data based on sparse logistic regression
By Algamal
Published: 26 April 2017
This work is copyrighted by Universit`a del Salento, and is licensed
un-der aCreative Commons Attribuzione - Non commerciale - Non opere derivate
3.0 Italia License. For more information see:
DOI: 10.1285/i20705948v10n1p242
An efficient gene selection method for
high-dimensional microarray data based
on sparse logistic regression
Zakariya Yahya Algamal
∗aand Haithem Taha Mohammad Ali
baDepartment of Statistics and Informatics,University of Mosul bCollege of Computers and Information Technology, Nawroz University
Published: 26 April 2017
Gene selection in high-dimensional microarray data has become increas-ingly important in cancer classification. The high dimensionality of microar-ray data makes the application of many expert classifier systems difficult. To simultaneously perform gene selection and estimate the gene coefficients in the model, sparse logistic regression using L1-norm was successfully ap-plied in high-dimensional microarray data. However, when there are high correlation among genes, L1-norm cannot perform effectively. To address this issue, an efficient sparse logistic regression (ESLR) is proposed. Exten-sive applications using high-dimensional gene expression data show that our proposed method can successfully select the highly correlated genes. Further-more, ESLR is compared with other three methods and exhibits competitive performance in both classification accuracy and Youdens index. Thus, we can conclude that ESLR has significant impact in sparse logistic regression method and could be used in the field of high-dimensional microarray data cancer classification.
keywords: Lasso, microarray data classification, gene selection, sparse lo-gistic regression.
1 Introduction
One of the major advancement made in the field of biology and genetics research is the emergence of DNA microarray technology. In cancer research, this technology facilitates
∗
Corresponding author:[email protected]
c
Universit`a del Salento ISSN: 2070-5948
the determination of the expression values of thousands of genes simultaneously. The gene expression data is used for various analyses to understand the biological signifi-cance of the tissue from which the genes were extracted for the experiment (Apolloni et al., 2016; Algamal and Lee, 2015c). In most applications of the expert systems using microarray technology, the number of genes, p, is greater than the number of patients (tissues), n (Zheng and Liu, 2011). Dealing with the situation p > n , which is com-monly known as high-dimensional data, poses a challenging task in the application of the statistical methods (Piao et al., 2012; Algamal and Lee, 2017, 2015b,a). Overfitting and multicollinearity are the most common problems that arise in high-dimensional data when applying statistical classification methods.
In general, cancer classification analysis, based on microarray gene data, is a task of constructing a decision rule based on the dataset of genes and tissues, which is able to au-tomatically assign new tissue to one of two categories (Kalina, 2014). High-dimensional cancer classification analysis has attracted much attention in both bioinformatics and computational biology, because the classical classification methods suffer from the curse of dimensionality (Algamal and Lee, 2015e,d; Algamal, 2012). Using all genes in the high-dimensional microarray data often results in model overfitting, particularly if there are irrelevant and noisy genes (Liang et al., 2013). Consequently, removing irrelevant and noisy genes is an important target when dealing with high-dimensional cancer clas-sification. In principle, gene selection aims to select a relatively small set of genes from a high-dimensional gene dataset, and, therefore, achieves high classification accuracy. Furthermore, selecting important genes can also help in early diagnosis for and drug discovery for cancer Mao et al. (2013).
Numerous statistical methods have been successfully applied in the area of cancer classification. Among them, logistic regression (LR) is considered as a powerful dis-criminative method. LR provides predicted probabilities of class membership and easy interpretation of the gene coefficients (Algamal and Lee, 2015e,f). However, LR is nei-ther applicable nor suitable for the high-dimensional microarray data classification, be-cause the design matrix is singular. Thus, iteration methods, such as Newton-Raphsons method, cannot work (Bielza et al., 2011).
Recently, there has been growing interest in applying the sparse methods in high-dimensional cancer classification . To tackle both estimating the gene coefficients and performing gene selection simultaneously, sparse logistic regression (SLR) has been suc-cessfully applied in high-dimensional cancer classification (Cawley and Talbot, 2006; Li and Eng Chong, 2005; Shevade and Keerthi, 2003; Zhu and Hastie, 2004). A SLR with different penalties can be applied. The most widely and popular penalty is the least absolute shrinkage and selection operator (Lasso) (Tibshirani, 1996). The Lasso im-poses the L1-norm penalty to the loss function. Because of the L1-norm property, the Lasso can perform variable selection by assigning some gene coefficients to zero. For this reason, the Lasso has gained popularity in high-dimensional data.
In most applications of the bioinformatics and computational biology using microarray technology, often the genes can be grouped according to a specific structure, such as the biological pathway. Therefore, selecting a group of correlated genes is desirable than selecting individual gene because selecting individual gene may perform inefficiently
in such cases by ignoring the information in the grouping structure (Algamal and Lee, 2015f). The grouping effect suggests that the strongly correlated genes tend to be selected or not selected together. A resulting estimator encourages the grouping effect when it tends to select the highly correlated genes together. In this study, an efficient sparse logistic regression is proposed by introducing a new weight inside the L1-norm penalty. The main objective behind this new weight is to improve -norm penalty ability to select more correlated genes inside a group. To evaluate the effectiveness of the new weight, we apply four public cancer classification datasets. Moreover, a comparison is done with other penalties.
2 Sparse Logistic Regression
Logistic regression is a statistical method, which it can be used to model a binary classification problem. The regression function has a nonlinear relation with the linear combination of the genes. In cancer classification, the response variable of the logistic regression has two values either 1 for the tumor class or 0 for the normal class. Let
yi ∈ {0,1}, then the logistic regression model is defined as ln[ pi
1−pi
] =xTi β, i= 1,2, ..., n, (1) where xTi is a 1×p vector of genes and β = (β1, ..., βk)T ∈ Rk is a vector of unknown gene coefficients, and
E(yi= 1|xi) =
Exp(xTi β) 1 +Exp(xT
i β)
. (2)
The log-likelihood function can be written as:
`(β) = n X
i=1
{yiln (pi) + (1−yi) ln(1−pi)}. (3)
Logistic regression offers the advantage of simultaneously estimating the probabilities
pi and 1−pi for each class and classifying subjects. The predicted class is then obtained by I{pˆi>0.5}, where I is an indicator function. SLR adds a nonnegative penalty term to Eq. (3), such that the size of gene coefficients in high-dimension can be controlled. Without loss of generality, it is assumed that the genes are standardized, then the estimation of the vectorβ is obtained by maximizing the sparse logistic regression as
ˆ βSLR= arg max β " n X i=1 {yiln (pi) + (1−yi) ln(1−pi)} −λg(β) # (4)
where λ g(β) is the penalty term that sparse the estimates. The penalty term depends on the positive tuning parameter,λ, which controls the tradeoff between fitting the data to the model and the effect of the penalty. In other words, it controls the amount of
shrinkage. For the λ= 0, we obtain the maximum likelihood method (MLE) solution. Conversely, for large values of λ the influence of the penalty term on the coefficient estimates increases. Several penalty terms have been discussed in the literature. Among them, L2-norm (Ridge) (Hoerl and Kennard, 1970), L1-norm (Lasso) (Tibshirani, 1996), L1-norm + L2-norm (Elastic) (Zou and Hastie, 2005), weighted L1-norm (Adaptive Lasso) (Zou, 2006). The sparse logistic regression model using Lasso, elastic net (Elastic), and adaptive lasso (ALasso) is defined as
ˆ
βLasso= arg max β n X i=1 {yiln (pi) + (1−yi) ln(1−pi)} −λ p X j=1 |βj| , (5) ˆ
βElastic = arg max β n X i=1 {yiln (pi) + (1−yi) ln(1−pi)} −(λ1 p X j=1 |βj|+λ2 p X j=1 βj2) , (6) ˆ
βALasso= arg max β n X i=1 {yiln (pi) + (1−yi) ln(1−pi)} −λ p X j=1 |βj| ( βˆ initial j ) γ , (7)
whereλ, λ1, λ2, γ≥0 and ˆβjinitial is an initial estimate for eachβj. Eqs. (5)-(7) can be efficiently solved by the coordinate descent algorithm (Friedman et al., 2010).
Despite the advantage of the Lasso, it has three shortcomings (Wang et al., 2011; Al-Fakih et al., 2015; Algamal et al., 2017). First, it cannot select more genes than the number of samples. Second, in microarray gene data, there is grouping among genes, where genes that share a common biological pathway have a high pairwise correlation with each other. The Lasso tries to select only one gene or a few of them among a group of correlated genes. To overcome the first two limitations, Zou and Hastie (2005) proposed the elastic net penalty, for which the penalty is a linear combination of L1-norm and L2-norm. Last, the Lasso has a bias gene selection, because it penalizes all gene coefficients equally. In other words, the Lasso does not have the oracle properties, which refer to the probability of selecting the right set of genes (with nonzero coefficients) converged to one, and that the estimators of the nonzero coefficients are asymptotically normal with the same means and covariances as if the zero coefficients are known in advance (Fan and Li, 2001). In relation to the last limitation of the Lasso, oracle properties, Zou (2006) proposed the adaptive Lasso in which adaptive weights are used for penalizing different coefficients in the L1-norm penalty.
3 An Efficient Sparse Logistic Regression
In high-dimensional classification data, however, the Lasso faces practical problems. First, Lasso applies the same amount of the penalization to all gene coefficients, resulting biased estimation of the large gene coefficients. As a result, its model selection results are inconsistent. Second, for highly correlated genes, Lasso tends to arbitrary pick only one gene from the whole group (Kamkar et al., 2015; Zou and Hastie, 2005). In addition,
the adaptive Lasso (Zou, 2006) still has poor performance when there is grouping among genes, although it applies the different amount of the penalization to gene coefficients. Furthermore, using ˆβM LE as an initial weight is not available and hence the adaptive Lasso is no longer applicable in the high-dimensional data.Moreover, although, the elastic net performs well when the pairwise correlations between genes are very high, El Anbari and Mkhadri (2013) stated that if the absolute correlation between genes is less than 0.95, the elastic net may be slightly less reliable. Moreover, the elastic net does not take into account the correlation structure among genes. Besides, elastic net computationally suffers from the burden of having two tuning parameters.
To alleviate these limitations, a new initial weight inside the L1-norm penalty has been proposed. The main objective behind this new weight is to improve the ability of L1-norm penalty to select more correlated genes inside a group. This new weight is defined as ˆ βjinitial= sj,βˆ Ridge ˆ βj,Ridge , (8) wheresβˆ
Ridge is the standard error of the ridge estimator and ˆβRidgeis the ridge estimator.
Although the ˆβRidgecan be used as an initial weight in the high-dimensional data, but, because of the nature of the L2-norm, the ridge penalty tries to force the estimated gene coefficients of highly correlated genes to be close to each other. However, this property loses the capability of estimating the coefficients of highly correlated genes with different magnitude, especially with different signs (Wang et al., 2011).
The main objective behind this new weight is to improve the ability of L1-norm penalty to select more correlated genes inside a group by using the ˆβRidge and adjusted its capa-bility of estimating the coefficients of highly correlated genes by using thesβˆ
Ridge. Using
sβˆRidge will adjust the penalized amount for each gene coefficient by assigning small
weight in Eq. (8) to the large gene coefficient and large weight to the small gene coeffi-cient. In addition, it can enhance the capability of ˆβRidgein estimating the coefficients of highly correlated genes with different magnitude. Consequently, the benefit of using the
sβˆ
Ridge is to efficiently improve the sparse logistic regression using the weighted L1-norm
penalty in selecting more correlated genes inside a group. Depending on the principal component analysis, Cule and De Iorio (2013) proposed a procedure to calculate the
sβˆ
Ridge. This procedure was used in calculation, where the R package ridge was used for
implementation. The efficient sparse logistic regression (ESLR) is defined as ˆ
βESLR= arg max β n X i=1 {yiln (pi) + (1−yi) ln(1−pi)} −λ p X j=1 (abs( sj,βˆRidge ˆ βj,Ridge )) γ |βj| . (9)
4 Tuning Parameter Selection
For practical applications, one has to decide the values ofλ. Classically, cross-validation (CV) has been widely used. However, it is computationally intensive for ESLR, simply
because there are two tuning parameters: λ and γ. For simplicity, γ = 1 was used for the real data application. Then, the ESLR tuning parameters were reduced to only λ.
5 Datasets
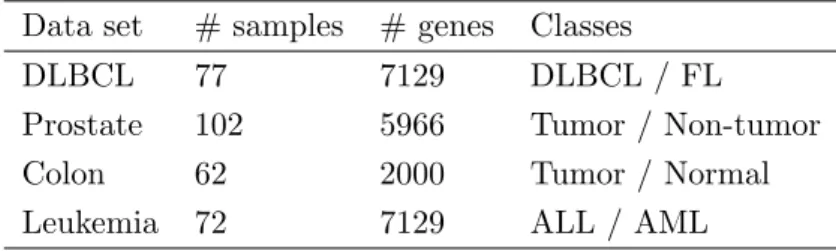
To evaluate our proposed method ESLR in the field of cancer classification, four pub-licly well-known binary cancer classification datasets were used: diffuse large B-cell lymphoma (DLBCL) (Shipp et al., 2002), prostate cancer (Singh et al., 2002), leukemia cancer (Golub et al., 1999), and colon cancer (Alon et al., 1999). The detailed informa-tion of these datasets is summarized in Table 1. The DLBCL dataset consisted of the gene expression values of 77 samples that were measured by high-density oligonucleotide microarrays of the two most prevalent adult lymphoid malignancies, which comprised 58 samples of diffuse large B-cell lymphomas (DLBCL) and 19 samples of follicular lym-phoma (FL). Each sample contained 7,129 gene expression values. The original prostate dataset contained 12600 genes for 52 prostate tumor samples and 50 non-tumor tissues. A subset of 5966 genes was adapted in the classification. In the leukemia dataset, there were two types of patients: 47 patients of acute lymphoblastic leukemia (ALL) and 25 patients of acute myeloid leukemia (AML). The total expression profiles were 7129 genes. The colon cancer dataset, contained gene expression levels of 40 tumor and 22 normal colon tissues for 6500 human genes obtained with an Affymetrix oligonucleotide array. A subset of 2000 genes with the highest minimal intensity across the samples was used.
Table 1: The detail information for the used data sets
Data set # samples # genes Classes
DLBCL 77 7129 DLBCL / FL
Prostate 102 5966 Tumor / Non-tumor
Colon 62 2000 Tumor / Normal
Leukemia 72 7129 ALL / AML
6 Evaluation Measures
In order to evaluate the performance of our proposed ESLR method and to compare it with other sparse methods, two evaluation criteria were calculated depending on the training and testing dataset:
Classification accuracy (%) (CA)
CA= T P +T N
T P +F P +F N+T N ×100% (10)
Youdens Index (YI)
where T P is the number of true positive, F P is the number of false positive, TN is the number of true negative, and FN is the number of false negative.The sensitivity is used to ensure the test ability of the classifier. It was calculated in the same way as the classification accuracy,where it regards only positive cases. While specificity is computed in the same fashion as sensitivity. The difference is that it deals only with negative cases. Both sensitivity and specificity are defined as:
Sensitivity= T P
T P +F N ×100% (12)
Specif icity= T N
F P +T N ×100% (13)
7 Results and Discussion
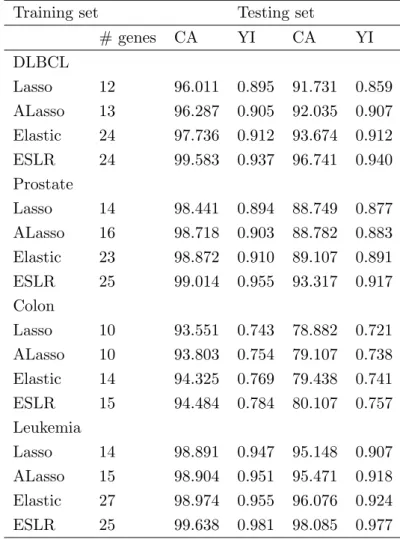
In order to enable a fair comparison, we randomly partitioned each dataset into a training dataset, which comprised 70% of the samples, and a test dataset, which consisted of 30% of the samples. In order to get the best value ofλ, the 10-fold CV was employed using the training dataset with 200 times. All the applications were conducted in R using the glmnet package. The averaged number of selected genes, the averaged classification accuracy (%) (CA), and Youdens index (YI) in both the training and testing datasets are reported in Table 2. For comparison purposes, the performance of the Lasso, ALasso, and Elastic was also evaluated.
As can be seen from Table 2, ESLR selected more genes than the Lasso and ALasso, while it slightly selected more genes than Elastic. In prostate, for instance, ESLR selected 25 genes compared to 14, 16, and 23 genes for Lasso, ALasso, and Elastic, respectively. Importantly, ESLR has the potential to select more genes than the Lasso and ALasso, indicating that most of these additionally selected genes were probably highly correlated. Furthermore, ESLR has average classification accuracy in both the training and testing sets, and is much better than Lasso, ALasso, and Elastic in the DLBCL, prostate, and leukemia datasets, respectively. For the colon dataset, ESLR has slightly better classification accuracy. For example, in the DLBCL data, the classification accuracy of ESLR in the training (testing) set was 99.583 (96.741), which was greater than 97.736 (93.674) for the Elastic, 96.287 (92.035) for ALasso, and 96.011 (91.731) for the Lasso. In terms of Youdens index, the averaged values in all the datasets were considerably higher for ESLR in both the training and testing datasets, where the maximal Youdens index is 1. On the other hand, the Lasso generally performed slightly worse than the other three methods in terms of classification accuracy and Youdens index for either the training or the testing dataset, although it did select less genes. Furthermore, in leukemia dataset, although Elastic method selected 27 genes more than 25 selected by ESLR, the classification accuracy and Youdens index were less than the ESLR.
Table 2: The averaged evaluation criteria over 200 time for the used data sets
Training set Testing set
# genes CA YI CA YI DLBCL Lasso 12 96.011 0.895 91.731 0.859 ALasso 13 96.287 0.905 92.035 0.907 Elastic 24 97.736 0.912 93.674 0.912 ESLR 24 99.583 0.937 96.741 0.940 Prostate Lasso 14 98.441 0.894 88.749 0.877 ALasso 16 98.718 0.903 88.782 0.883 Elastic 23 98.872 0.910 89.107 0.891 ESLR 25 99.014 0.955 93.317 0.917 Colon Lasso 10 93.551 0.743 78.882 0.721 ALasso 10 93.803 0.754 79.107 0.738 Elastic 14 94.325 0.769 79.438 0.741 ESLR 15 94.484 0.784 80.107 0.757 Leukemia Lasso 14 98.891 0.947 95.148 0.907 ALasso 15 98.904 0.951 95.471 0.918 Elastic 27 98.974 0.955 96.076 0.924 ESLR 25 99.638 0.981 98.085 0.977
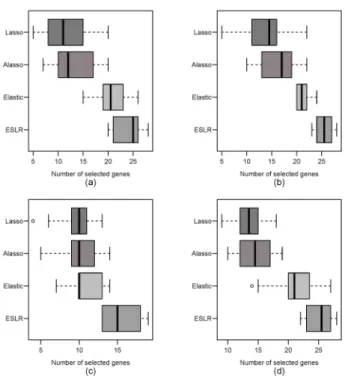
To further evaluate the ability of ESLR in consistently selecting gene, Fig. 1 depicts the boxplots of the number of selected genes of ESLR, Elastic, ALasso, and the Lasso in all the datasets over the 200 times. It is clear that ESLR gave much more consistent results than the other three methods. For instance, using the whiskers of the boxplots as a reference, the ESLR is likely to choose a subset of genes of size 23 to 28 genes, as compared to a subset of size 20 to 25, 10 to 22, and 5 to 22 genes for the Elastic, ALasso, and the Lasso in the prostate dataset, respectively. This clearly demonstrated that the size of the selected genes obtained from ESLR was consistent each time.
Figure 1: Number of selected genes over 200 times for the used methods. (a) DLBCL. (b) prostate. (c) colon. (d) leukemia
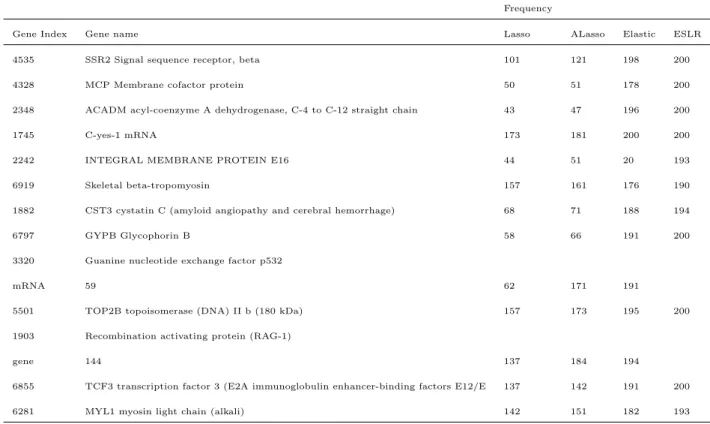
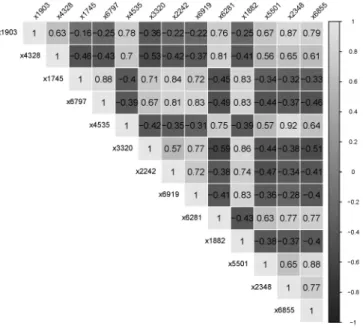
To focus on the capability of ESLR in encouraging grouping effects by selecting the correlated genes, we listed the most frequently highly correlated selected genes in the leukemia dataset in Table 3. The correlation matrix of these selected genes is given in Fig. 2. We can observe that the ESLR successfully selected the most highly correlated genes. For example, the highest correlation among the selected genes was 0.918 between gene index 2348 and 4535. These two correlated genes were selected together by ESLR with 100% compared to 94% for Elastic, 36% for ALasso, and 20% for the Lasso. Furthermore, ESLR selected the most important highly correlated genes 190 times out of 200 times, with the percentage equal to 95%. On the other hand, it can be observed that the Elastic performed well in selecting highly correlated genes, although it selected more genes compared to the Lasso and ALasso. In contrast, the Lasso and ALasso failed to select the highly correlated genes together; their percentages were 21.5% and 23.5%, respectively. The success of ESLR in selecting more correlated genes than the other methods, especially ALasso, is due to its ability to adjust the weight.
Table 3: Frequencies of the most 13 selected genes in leukemia data set over 200 times
Frequency
Gene Index Gene name Lasso ALasso Elastic ESLR
4535 SSR2 Signal sequence receptor, beta 101 121 198 200
4328 MCP Membrane cofactor protein 50 51 178 200
2348 ACADM acyl-coenzyme A dehydrogenase, C-4 to C-12 straight chain 43 47 196 200
1745 C-yes-1 mRNA 173 181 200 200
2242 INTEGRAL MEMBRANE PROTEIN E16 44 51 20 193
6919 Skeletal beta-tropomyosin 157 161 176 190
1882 CST3 cystatin C (amyloid angiopathy and cerebral hemorrhage) 68 71 188 194
6797 GYPB Glycophorin B 58 66 191 200
3320 Guanine nucleotide exchange factor p532
mRNA 59 62 171 191
5501 TOP2B topoisomerase (DNA) II b (180 kDa) 157 173 195 200
1903 Recombination activating protein (RAG-1)
gene 144 137 184 194
6855 TCF3 transcription factor 3 (E2A immunoglobulin enhancer-binding factors E12/E 137 142 191 200
Figure 2: The correlation matrix between the top 13 selected genes for leukemia dataset
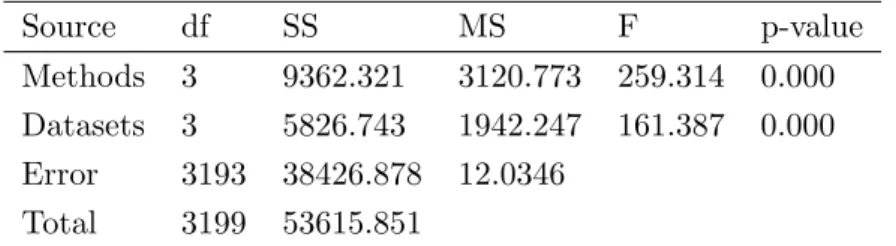
To further test the stability of the proposed method, the ESLR seeks to prove that it can classify high-dimensional cancer data with a high degree of accuracy compared to the other three used methods. Depending on the training dataset, a two-way analysis of variance (ANOVA) was used as a statistical test to check whether the ESLR, Elastic, ALasso, and the Lasso were statistically significant and if there was any significant difference between the four datasets used in terms of classification accuracy. Table 4 reports the two-way ANOVA results. From Table 4, the results showed statistically significant differences between the ESLR and the three other used methods in terms of classification accuracy. In addition, we can see that the DLBCL, prostate, colon, and leukemia datasets had different classification accuracy values.
Furthermore, Duncan’s multiple range test was used to obtain more detailed informa-tion about the differences between the ESLR and the other three used methods. Table 5 lists the p-value of each compared pair of methods. It is apparent from Table 5 that the ESLR showed statistical differences compared to the Elastic, ALasso, and Lasso in terms of classification accuracy.
Table 4: Two-way ANOVA for average classification accuracy over 200 times Source df SS MS F p-value Methods 3 9362.321 3120.773 259.314 0.000 Datasets 3 5826.743 1942.247 161.387 0.000 Error 3193 38426.878 12.0346 Total 3199 53615.851
Table 5: p-value of Duncans multiple range test for average classification accuracy
ALasso Elastic ESLR
Lasso 0.036 0.000 0.000
ALasso 0.007 0.000
Elastic 0.004
To summarize, it is obvious that the microarrays real datasets results demonstrated the use of ESLR in terms of classification accuracy, Youdens index for both the training and testing sets. In addition, it outperformed the other competitor methods in terms of consistent selection, selection of highly correlated genes, and stability test.
8 Conclusion
Cancer classification is one of the most important applications in gene expression data. In this paper, an efficient sparse logistic regression, ESLR, is proposed by introducing a new weight inside the L1-norm penalty to estimate the gene coefficients and perform gene selection simultaneously. As a result, ESLR can improve the classification accuracy of the expert classifier system using high-dimensional microarray data. The experimental results of the real datasets demonstrated that ESLR successfully selected the correlated genes. Moreover, compared with Elastic, ALasso, and Lasso, the proposed method proved that ESLR yielded positive and useful results in terms of classification accuracy and Youdens index for both the training and testing datasets. It achieved the highest classification accuracies (99.58%, 99.01%, 94.32%, and 99.63%) of training dataset and (96.74%, 93.31%, 80.10%, and 98.08%) of testing dataset for DLBCL, prostate, colon, and leukemia datasets, respectively. In addition, the Youdens index obtained by the ESLR was the highest for all of the four gene expression datasets, as compared to Elastic, ALasso, and Lasso. In conclusion, the obtained results indicate that a highly classification accuracy is possible when ESLR is employed to analyze gene expression data for cancer classification.
References
Al-Fakih, A. M., Aziz, M., Abdallah, H. H., Algamal, Z. Y., Lee, M. H., and Maarof, H. (2015). High dimensional qsar study of mild steel corrosion inhibition in acidic medium by furan derivatives. International Journal of Electrochemical Science, 10:3568–3583. Algamal, Z. and Lee, M. (2017). A new adaptive l1-norm for optimal descriptor selec-tion of high-dimensional qsar classificaselec-tion model for anti-hepatitis c virus activity of thiourea derivatives. SAR and QSAR in Environmental Research, 28(1):75–90. Algamal, Z. Y. (2012). Diagnostic in poisson regression models. Electronic Journal of
Applied Statistical Analysis, 5(2):178–186.
Algamal, Z. Y. and Lee, M. (2015a). Penalized poisson regression model using adap-tive modified elastic net penalty. Electronic Journal of Applied Statistical Analysis, 8(2):236–245.
Algamal, Z. Y. and Lee, M. H. (2015b). Adjusted adaptive lasso in high-dimensional poisson regression model. Modern Applied Science, 9(4):170–179.
Algamal, Z. Y. and Lee, M. H. (2015c). Applying penalized binary logistic regression with correlation based elastic net for variables selection. Journal of Modern Applied Statistical Methods, 14(1):168–179.
Algamal, Z. Y. and Lee, M. H. (2015d). High dimensional logistic regression model using adjusted elastic net penalty. Pakistan Journal of Statistics and Operation Research, 11(4):1–10.
Algamal, Z. Y. and Lee, M. H. (2015e). Penalized logistic regression with the adaptive lasso for gene selection in high-dimensional cancer classification. Expert Systems with Applications, 42(23):93269332.
Algamal, Z. Y. and Lee, M. H. (2015f). Regularized logistic regression with adjusted adaptive elastic net for gene selection in high dimensional cancer classification.Comput Biol Med, 67:136–45.
Algamal, Z. Y., Lee, M. H., Al-Fakih, A. M., and Aziz, M. (2017). High-dimensional qsar classification model for anti-hepatitis c virus activity of thiourea derivatives based on the sparse logistic regression model with a bridge penalty. Journal of Chemometrics. Alon, U., Barkai, N., Notterman, D. A., Gish, K., Ybarra, S., Mack, D., and Levine, A. J. (1999). Broad patterns of gene expression revealed by clustering analysis of tumor and normal colon tissues probed by oligonucleotide arrays. Proceedings of the National Academy of Sciences, 96(12):6745–6750.
Apolloni, J., Leguizamn, G., and Alba, E. (2016). Two hybrid wrapper-filter feature selection algorithms applied to high-dimensional microarray experiments. Applied Soft Computing, 38:922–932.
Bielza, C., Robles, V., and Larraaga, P. (2011). Regularized logistic regression without a penalty term: An application to cancer classification with microarray data. Expert Systems with Applications, 38(5):5110–5118.
Cawley, G. C. and Talbot, N. L. C. (2006). Gene selection in cancer classification using sparse logistic regression with bayesian regularization. Bioinformatics, 22(19):2348–
2355.
Cule, E. and De Iorio, M. (2013). Ridge regression in prediction problems: Automatic choice of the ridge parameter. Genetic Epidemiology, 37(7):704–714.
El Anbari, M. and Mkhadri, A. (2013). The adaptive gril estimator with a diverging num-ber of parameters. Communications in Statistics-Theory and Methods, 42(14):2634– 2660.
Fan, J. and Li, R. (2001). Variable selection via nonconcave penalized likelihood and its oracle properties. Journal of the American Statistical Association, 96(456):1348–1360. Friedman, J., Hastie, T., and Tibshirani, R. (2010). Regularization paths for generalized
linear models via coordinate descent. Journal of Statistical Software, 33(1):1–22. Golub, T. R., Slonim, D. K., Tamayo, P., Huard, C., Gaasenbeek, M., Mesirov, J. P.,
Coller, H., Loh, M. L., Downing, J. R., Caligiuri, M. A., Bloomfield, C. D., and Lander, E. S. (1999). Molecular classification of cancer: Class discovery and class prediction by gene expression monitoring. Science, 286(5439):531–537.
Hoerl, A. E. and Kennard, R. W. (1970). Ridge regression: Biased estimation for nonorthogonal problems. Technometrics, 12(1):55–67.
Kalina, J. (2014). Classification methods for high-dimensional genetic data. Biocyber-netics and Biomedical Engineering, 34(1):10–18.
Kamkar, I., Gupta, S. K., Phung, D., and Venkatesh, S. (2015). Stable feature selection for clinical prediction: exploiting icd tree structure using tree-lasso. J Biomed Inform, 53:277–90.
Li, S. and Eng Chong, T. (2005). Dimension reduction-based penalized logistic re-gression for cancer classification using microarray data. IEEE/ACM Transactions on Computational Biology and Bioinformatics, 2(2):166–175.
Liang, Y., Liu, C., Luan, X.-Z., Leung, K.-S., Chan, T.-M., Xu, Z.-B., and Zhang, H. (2013). Sparse logistic regression with a l1/2 penalty for gene selection in cancer classification. BMC Bioinformatics, 14(1):198–211.
Mao, Z., Cai, W., and Shao, X. (2013). Selecting significant genes by randomization test for cancer classification using gene expression data. J Biomed Inform, 46(4):594–601. Piao, Y., Piao, M., Park, K., and Ryu, K. H. (2012). An ensemble correlation-based gene selection algorithm for cancer classification with gene expression data. Bioinformatics, 28(24):3306–3315.
Shevade, S. K. and Keerthi, S. S. (2003). A simple and efficient algorithm for gene selection using sparse logistic regression. Bioinformatics, 19(17):2246–2253.
Shipp, M. A., Ross, K. N., Tamayo, P., Weng, A. P., Kutok, J. L., Aguiar, R. C. T., Gaasenbeek, M., Angelo, M., Reich, M., Pinkus, G. S., Ray, T. S., Koval, M. A., Last, K. W., Norton, A., Lister, T. A., Mesirov, J., Neuberg, D. S., Lander, E. S., Aster, J. C., and Golub, T. R. (2002). Diffuse large b-cell lymphoma outcome prediction by gene-expression profiling and supervised machine learning. Nature Medicine, 8(1):68– 74.
Renshaw, A. A., D’Amico, A. V., Richie, J. P., Lander, E. S., Loda, M., Kantoff, P. W., Golub, T. R., and Sellers, W. R. (2002). Gene expression correlates of clinical prostate cancer behavior. Cancer Cell, 1(2):203–209.
Tibshirani, R. (1996). Regression shrinkage and selection via the lasso. Journal of the Royal Statistical Society: Series B (Statistical Methodology), 58(1):267–288.
Wang, S., Nan, B., Rosset, S., and Zhu, J. (2011). Random lasso.The Annals of Applied Statistics, 5(1):468–485.
Zheng, S. and Liu, W. (2011). An experimental comparison of gene selection by lasso and dantzig selector for cancer classification. Computers in Biology and Medicine, 41(11):1033–1040.
Zhu, J. and Hastie, T. (2004). Classification of gene microarrays by penalized logistic regression. Biostatistics, 5(3):427–443.
Zou, H. (2006). The adaptive lasso and its oracle properties. Journal of the American Statistical Association, 101(476):1418–1429.
Zou, H. and Hastie, T. (2005). Regularization and variable selection via the elastic net.
Journal of the Royal Statistical Society: Series B (Statistical Methodology), 67(2):301– 320.