Association for Information Systems Association for Information Systems
AIS Electronic Library (AISeL)
AIS Electronic Library (AISeL)
ICEB 2016 Proceedings International Conference on Electronic Business (ICEB)
Winter 12-4-2016
Point-of-Interest Recommendation Algorithm Based on User
Point-of-Interest Recommendation Algorithm Based on User
Similarity in Location-Based Social Networks
Similarity in Location-Based Social Networks
Ning TangXi'an Jiaotong University, Xiamen City University, China, [email protected]
Jiangyi Lin
Xiamen University of Technology, China, [email protected]
Wei Weng
Xiamen University of Technology, China, [email protected]
Shunzhi Zhu
Xiamen University of Technology, China, [email protected]
Follow this and additional works at: https://aisel.aisnet.org/iceb2016 Recommended Citation
Recommended Citation
Tang, Ning; Lin, Jiangyi; Weng, Wei; and Zhu, Shunzhi, "Point-of-Interest Recommendation Algorithm Based on User Similarity in Location-Based Social Networks" (2016). ICEB 2016 Proceedings. 24.
https://aisel.aisnet.org/iceb2016/24
This material is brought to you by the International Conference on Electronic Business (ICEB) at AIS Electronic Library (AISeL). It has been accepted for inclusion in ICEB 2016 Proceedings by an authorized administrator of AIS Electronic Library (AISeL). For more information, please contact [email protected].
Point-of-Interest Recommendation Algorithm Based on User
Similarity in Location-Based Social Networks
Ning Tang
1, Xi'an Jiaotong University, Xiamen City University, China, [email protected]
Jiangyi Lin
2, Xiamen University of Technology, China, [email protected]
Wei Weng
2, Xiamen University of Technology, China,[email protected]
Shunzhi Zhu
2, Xiamen University of Technology, China, [email protected]
ABSTRACT
Location-based social network is rising recent years with the development of mobile internet, and point-of-interest (POI) recommendation is a hot topic of this field. Because the factors that affect the behavior of users are very complex, most of the research focuses on the context of the recommendation. But overall context data acquisition in practice is often difficult to obtain. In this paper, we have considered the most common collaborative recommendation algorithm based on user similarity, and discussed several methods of user similarity definition. Comparing the effect of different methods in the actual dataset, experimental results show among the factors including that social relation, check-in and geographical location the check-in is extremely important, so this work is of certain guiding significance to the actual applications.
Keywords: Collaborative Recommendation, Location-Based Social Networks, Geographical Point-of-Interest.
PREFACE
The rapid development of internet and e-commerce makes information and knowledge unprecedented spread, causes profound The location-based services and the mobile networks are two kinds of technologies that supplement each other. And with the development of mobile networks, the content of location-based services has been enriched. In recent years, location-aware technology has become more and more closely related to the traditional social networks, which has formed the concept of Location-Based Social Networks, putting forward a new task for scientific research. Personalized location recommendation is a key component of location based services (LBS) [1], which is commonly found in the footprint-sharing of such social networks. When users log into footprint-sharing websites through the mobile devices, GPS and other location technologies (one piece of check-in data typically includes user ID, location ID, time of arrival and the latitude and longitude of the location) make it possible for users to do check-in at the current position, make comments and even share experiences, leaving their own "footprints" on the map [2]. These data enable us to understand users’ daily behaviors and hobbies. For example, those who often go to the same type of restaurants may be fond of delicious food and share similar tastes; those who regularly go to the gym probably often do physical exercise and like sports. The check-ins on the same system done by a host of users can form a lot of “points of interest”. The location recommendation based on these historical data is commonly used in commercial location recommendation of some scenic spots, shops and even the commodities, which is of extensive commercial value. Location recommendation is also known as the "point of interest"(POI) recommendation. The dataset of this kind of algorithm includes the check-in data, content sharing, users’ characteristics, social relations and location features, among which check-in data are essential.
According to Max Schmachtenberg et al. [5], in term of "point of interest" recommendation, the "POI information itself and its nearby geographical information" should be fully made use of to launch a location recommendation system based on map information and weather information. Literature [6] points out that the locate function of mobile devices is used to determine the users' location, combined with users' preferences, to recommend points of interest for users by using hybrid recommendation strategy. Literature [7] proposes a method that the location recommendation can be achieved when the topics of mobile networks have been modeled at a semantic level so as to establish the interaction of three major entities: user, post and location. Jie Bao et al. [8] propose that the data of venues should be divided into longitude and latitude values and category description, and the latter one is category hierarchy (for example, "food" category includes Chinese restaurant and Italian restaurant and etc). The check-in data are categorized by city as well as WCH (Weighted Category Hierarchy) sub-tree is established to calculate a user’s personal preferences for different layer of a WCH. During the process of recommendation, it provides a user with a list of venues after the calculation based on user similarity, considering the user’s preferences, current location, and social opinions from the selected local experts who are nearby.
The literature above has one thing in common that the environmental data are made fully use of. However, it's not an easy job to obtain comprehensive environmental data, considering some users will not share all the information due to the factor of their own privacy. Our work focuses on the data containing some simple user information (records of the friendships between users or not) and check-in data (including user, time and venue such basic information), to do the point of interest recommendation based on these data. There are two factors that have explained why the relationship between friends has been taken into consideration in this paper. Firstly, this kind of data is essential in social networks and easy to get as well. Secondly, as friends in real life or networks tend to share common hobbies, such as drinking coffee, shopping and so on in pairs and groups, this related information can improve the recommendation effect [9]. The check-in data implies users’ preferences on location. And moreover,
The Sixteenth International Conference on Electronic Business, Xiamen, December 4-8, 2016
users usually do check-in at nearby points of interest, which will also help us to study users’ location preferences. Nevertheless, we note that the venues a single user visits are limited and the user - location matrix is often sparse [10], so the collaborative filtering technology is often applied in such kind of studies [11]. This paper is no exception.
The existing collaborative filtering technology has made an effective use of user preference information [12], social networks information [13] and the influence of geographical location between points of interest [14]. These methods have been inherited in this paper, where we discuss several calculation methods of user similarity in accordance with the features of data and analyze the recommended effects of these different methods, combined with the impact of geographical location. The specific contributions of this paper can be found from the following aspects.
(1)As far as we know, most POI recommendation algorithms and their application make full use of contextual information but it is hard to obtain, which limits the practical application of these algorithms. On the basis of the limited basic data, we fully mine the data that imply user relationship, and analyze the effect of recommendation.
(2) We have summed up six methods of user similarity in this paper after conducting a linear fusion combined with social networks analysis and algorithms of user similarity in the field of information recommendation. To our knowledge, this is the first study on such problems in similar literature.
(3)Particular literature has attached great importance to the positive effect of geographical location factors on the recommendation but it has not taken into account the geographical location between the users. Therefore, we have put forward a method to speculate a user’s address and found that most addresses of a user’s friends’ are close to the user’s address in terms of the relationship between friends. But does this mean that the use of some friends’ information is more effective to recommendation? The correlative analysis is also carried out in this paper.
BASIC DEFINITIONS
The user set is represented withU
u1,u2, ,um
while POI set is represented withL
l
1,
l
2,
,
l
n
. The socialrelationship matrix is denoted as
S
, whereS
ij
1
represents the friendship between usersu
i andu
j. Otherwise,S
ij
0
.The check-in frequency matrix is denoted as
C
, whereC
ij
0
represents the check-ins that a user does at the point of interest.Then check-in matrix is notated as
C
', if and only ifC
ij
0
, then1
'
ijC
; otherwise0
'
ijC
.The collaborative filtering technology can be categorized into the methods respectively based on users and projects. The feature of the former method lies in the recommendation based on user similarity while the latter one lies in the project similarity. In the light of the features of data studied in this paper, we have adopted the technology based on users.
The key of collaborative filtering technology based on users is to calculate the similarity of users. If we want to do the calculation, we have to describe the characteristics of the users at first as different description methods may lead to different results of user similarity. To calculate the similarity of users
u
i andu
k, we make use of the data from social relationship matrixS
andcheck-in frequency matrix
C
as well as the following six elementary technical methods, respectively denoted as1 ik
w
[15]、 2 ikw
、w
ik3 [14]、 4 ikw
、w
ik5 和w
ik6 [15]。
n p kp n p ip n p kp ip ik C C C C w 1 ' 1 ' 1 ' ' 1 (1)
n p kp n p ip n p kp ip C C C C w 1 1 1 2 ik (2)
k n i m k i l u St u n u St u m u St St u l iku
K
u
K
u
K
w
1
1
1
u 3 (3)
3 1 4 ik1
w
w
ik
w
ik (4)
3 2 51
ik ik ikw
w
w
(5)
i k i k i k i k ikL
L
L
L
F
F
F
F
w
1
6 (6)We use
F
kandL
k to represent useru
k’s set of friends and set of check-in POIs. The neighbor ofu
i is denoted asN
u
i ,namely
N
u
i
u
j|
S
ij
0
.St
u
i
u
i
N
u
i , and
n j ij iS
u
K
1 is used to represent the number of user
u
i’sfriends. Equation 1-2 are used to calculate the cosine of vector to show the similarity between two users by using the vector of users’ check-in venues as the data describing users’ features. Literature [14] makes a propose that Equation(3)is a good method to measure user similarity that can be used for finding social community, only taking the advantage of a user’s social relations to describe its features and work out the user similarity; Two factors of user’s social networks and check-ins are combined to do the calculation in Equation 4-6.
Moreover, we can predict the check-in times of user
u
i at the POIl
j by calculating the check-in times of the user who issimilar to user
u
i at the placep
j, which is shown in Equation(7).
m k ik m k kj ik ijw
C
w
CheckIn
1 1 u (7)The
w
ik in Equation(7)is used to represent the similarity between usersu
i andu
k, and the algorithms are shown inEquation(1)~(6).
EXPERIMENT ANALYSIS Data Collection
The higher vocational course e-commerce is still in the primary stage, just stays in the mechanical network and digital level, not We collected the data from the frequently-used dataset of Gowalla which contains check-in data from September 2009 to October 2010, including 196591 users, 1279228 POIs, 950327 friendships and 6442890 check-ins. After taking the maximum inscribed rectangle among Paris、Chicago and San Francisco, we can obtain the center coordinate of venues on the basis of the coordinates of venues each user has visited. Then according to the distance, we choose 80% of the venues that are closest to the center coordinate, and then work out the new center coordinate on the basis of these venues. Finally, we set this coordinate as user's location by which we make a judgment whether the user is located in city's largest inscribed rectangle. The data of the three cities obtained in this way is shown in Table1.
Table 1 Test Data
City Total number of users Total number of friends Total number of check-ins
Paris 313 1384 1409
Chicago 1116 7902 6147
San Francisco 3007 48822 7970
Evaluation Metrics
Students are in a passive position under the traditional higher vocational education, there is no chance for them to choose teacher.
We use three metrics: precision
P
, recallR
and F-score(F
) to make evaluation, which are also commonly used as metrics inthe relevant literature. For certain user, we define its standard check-in list as
L
Ture and its experiment check-in list asL
test, soture test ture
L
L
L
P
(8) test test tureL
L
L
R
(9)R
P
R
P
F
2
(10)The Sixteenth International Conference on Electronic Business, Xiamen, December 4-8, 2016
The precision (
P
) reflects the proportion of the number of the correct node pairs in the partition results while the recall (R
) reflects the proportion of the node pairs that are correctly classified in the real community. The precision (P
) and recall (R
) both reflect one aspect of the algorithms but there is no proportional relationship between the two. In other words, a high precision (P
) does not necessarily indicate a high recall (R
). F-score (F
) is more reasonable in comparison. The metric of F-score (F
) will be high only if the precision (P
) and recall (R
) are both high. Obviously, the three metrics are the bigger, the better. The results are counted on the basis of city, each user of the same city. According to the Equation(7), we make the recommendation and calculate these three metrics, taking the average value of the whole city users.As our algorithms predict the number of check-ins, the POIs in
L
test are ranged from large to small according to the predictednumber of check-ins. Similarly, we can arrange the POIs in
L
Ture in descending order according to the check-in frequency sothat we can explore the problems of the venues recommended by
N
in terms of the precisionP
_
N
, the recallR
_
N
and thecomprehensive evaluation
F
_
N
. In the experiment, we take the values of 2, 4, 6. In order to investigate the effect of different factors on the recommendation, the values in the Equation (4) ~ (6) are from 0 to 1, and the step length is 0.1. Because there are six algorithms ofw
ik in Equation (7), we denote them respectively asA
1、A
2、A
3、A
4、A
5 andA
6 in order to make iteasy to expound the upcoming content. The summary is as shown in Table 2. Table 2 Six Specific Recommendations
Algorithm A1 A2 A3 A4 A5 A6 Description Calculate the user similarity according to Equation (1) Calculate the user similarity according to Equation (2) Calculate the user similarity according to Equation (3) Calculate the user similarity according to Equation (4), the values of
are from 0 to 1,the step length is 0.1; Calculate the user similarity according to Equation (5),the values of
are from 0 to 1,the step length is 0.1; Calculate the user similarity according to Equation (6), the values of
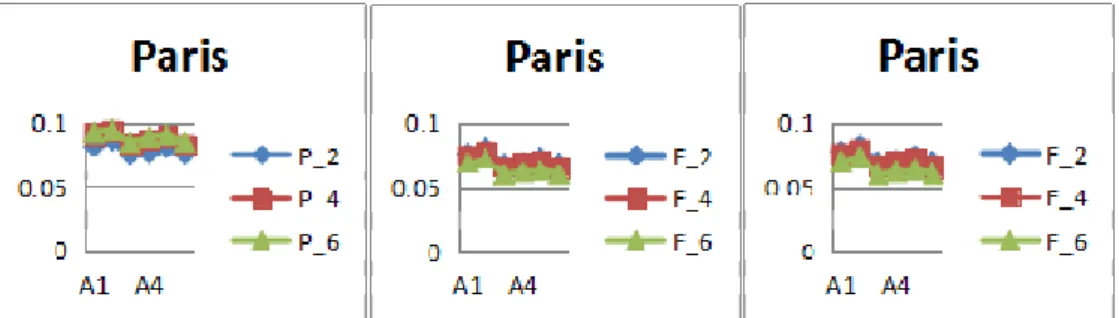
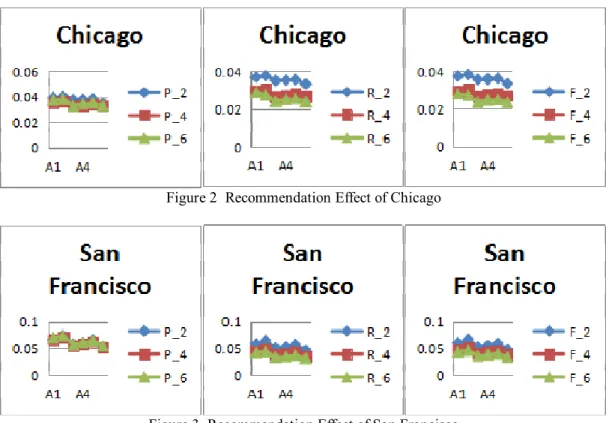
are from 0 to 1,the step length is 0.1; Results AnalysisFirst of all, we will compare these algorithms of user similarity. From Figure 1, we find A1 and A2 are better algorithms of user similarity for precision (
P
), recall (R
) and F-score (F
) no matter how the referrals have changed. Compared with other algorithms, the evaluation metrics derived from these two algorithms are better than others. The same conclusion also comes from Figure 3. Although the evaluation metrics derived from algorithm A1 in Figure 2 are relatively inferior, algorithm A2 is still a good method. Both algorithms A1 and A2 make the calculation of similarity on the basis of visited venues but algorithm A2 contains the data of check-in frequency while algorithm A1 not. From this point of view, algorithm A2 is more comprehensive. Different form algorithms A1 and A2, other algorithms all include social factors. The experiment shows that the calculation of user similarity which is applied in the POI recommendation based on user similarity generally does not have to take the social factors into consideration. Perhaps the reason is that people's interest in geographical location is more likely to be influenced by their own interests, habits, living conditions and other factors. The impact of social relations is not so important in comparison. For example, people who don't like to go to the gym may have a lot of friends who love sports, so their friends’ behavior of often going to the gym can’t change their habit of seldom going to the gym. If it’s applied in the field of geographical location recommendation, it will be influenced by a host of factors, such as relationship between friends, check-ins, distances and so on.Figure 2 Recommendation Effect of Chicago
Figure 3 Recommendation Effect of San Francisco
Furthermore, the number of recommendations has an impact on the metrics. With regard to the precision (
P
), it is presentedas
P
_
2
P
_
4
P
_
6
in Figure 2~ Figure 4. From the data of Paris in Figure 1, we have found that the effect of recommendation for four venues is better than that of two or six. With regard to the recall (R
), the effect ofP
_
4
is the best, taken together. As shown in Figure 2 and Figure 3, however, the more venues are recommended, the worse effect it has. There are a number of reasons why this may be the case. First, the problem becomes complex with the increase of users, friendships and check-in venues. Second, there is a limit to A1~A6, the six algorithms of user similarity. Finally, the data itself cannot contain the information on POIs effectively.Figure 4 Distance Distribution of Friend Relations in San Francisco Area
According to the study of the large-scale datasets of LBSN (www.foursquare.com and www.whrrl.com ), Ye Me et al [15] have observed that users tend to visit POIs that are close to each other and the geographical similarity (geographical proximities) has significant influence on a user's check-in activities, which leads to the conclusion that the check-in probability of nearby POI pairs visited by the same person follows the power-law distribution. Literature [16] also has made the conclusion that taking the geographical similarity in to comprehensive consideration will improve the effect of recommendation when comparing the influence of collaborative recommendations based on check-in frequency, social relationship, location similarity and the fusion of the three above. In view of the phenomenon analyzed by relevant literature that users often visit nearby POIS, we have made a further analysis of the interaction between user-user distance and check-in activity. In real life, friends influence each other by behaviors which will be strengthened then. Many documents have also confirmed that the friendship has a positive impact on check-in activity. Therefore, the social relationship should not be ignored in the check-in recommendations. From Equation (6-8), we have observed that the distance between users is ignored when considering the measure of user similarity. Since a user
Friend Relations
The Sixteenth International Conference on Electronic Business, Xiamen, December 4-8, 2016
often visits the POIs which are close to each other, we can assume that the user’s address is in the middle of these POIs as well. We have made an analysis on the check-in data of San Francisco from the datasets of Gowalla and chosen some relevant users. Then we work out the arithmetic means of the latitudes and longitudes of the 80% of the check-in venues in short distance and take the mean values as the users’ addresses. Afterwards, we find out the distances between friends’ addresses in this area which are divided into 0-1,1-2,2-3…, 8-9km of the 9 intervals denoted as the horizontal coordinate while the corresponding number of user relations as a vertical coordinate. The results are as shown in Figure 4 below. It is worth noting that the friend relations within 9km account for 99.68% of all in this area.
From Figure 4, we can see that the distance distribution of friend relations accords with the typical power-law distribution (long-tailed distributions). In other words, friends are geographically close to each other in the location-based social networks. In Figure 4, 71.66% of the distances between friends are limited to the range of 2kms. The same conclusion comes from our study of Paris and Chicago. Due to the relatively small data in these two areas, the results are not presented in Figure 4. However, there is still a problem for us to think about: the effect of friends’ recommendation according to the recommendation algorithm based on user similarity. Thus, we modify the Equation (7) as shown in the Equation (11).
i k k partF u ik u kj ik unew ijw
C
w
CheckIn
partFi (11)As shown above,
partF
i
F
i represents some friends of the useru
i’s and the subsets ofF
i are taken randomly to formi
partF
. If
partF
i
F
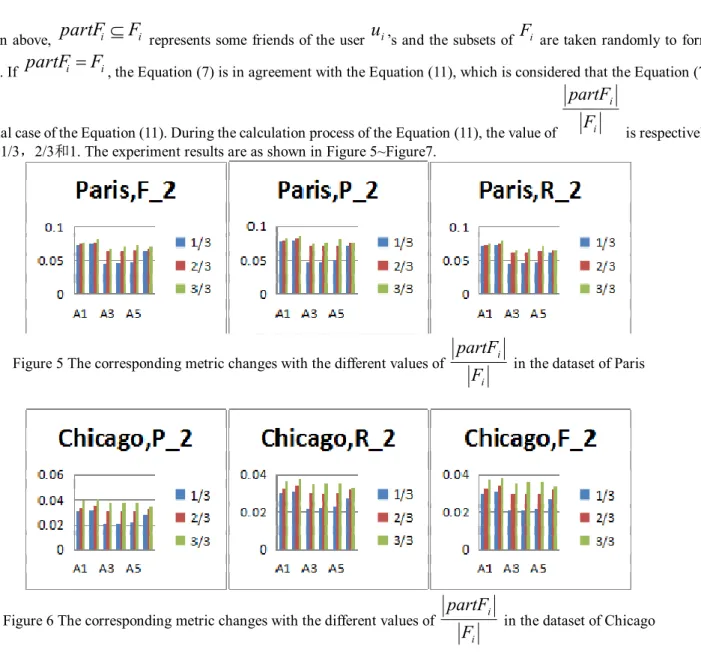
i, the Equation (7) is in agreement with the Equation (11), which is considered that the Equation (7)is a special case of the Equation (11). During the calculation process of the Equation (11), the value of i i
F
partF
is respectively
taken as 1/3,2/3和1. The experiment results are as shown in Figure 5~Figure7.
Figure 5 The corresponding metric changes with the different values of
i i
F
partF
in the dataset of Paris
Figure 6 The corresponding metric changes with the different values of
i i
F
partF
Figure 7 The corresponding metric changes with the different values of
i i
F
partF
in the dataset of San Francisco
As shown in Figure 5~Figure 7, the three datasets are not in strict ascending order but generally speaking, the larger the number of friends is, the better the three metrics become. It reflects from the side that the nearby friends cannot guarantee a better recommendation effect although the user often visits nearby places. In social networks, we are often able to detect the community structure, such as so-called “A good neighbor is better than a brother far off”. The people who are geographically close to each other tend to form a community. However, this social relationship has limited effect on venue recommendation, which also explains why the Equation (3) as the algorithm based on community searching is very effective while it becomes less effective when being used for venue recommendation in Figure 1~ Figure 3.
CONCLUSION
It is a key step to define the similarity between users for collaborative recommendation technology. The experimental results of this paper has proved that the act of mining the information contained in the check-in data is essential to the effect of recommendation in the location-based social networks. However, the effect of recommendation is related to the quantity and quality of the specific data. Therefore, the direction for future study is to do the work of data statistic and analysis and then study its influence on the commonly used algorithms of user similarity to deduce a theory law that has certain guiding function to the practical application. This paper is focusing on the algorithms of user similarity from different perspectives in location-based networks and the application of venue recommendation based on user similarity. Thus, we can study the problems of recommendation based on user similarity from other perspectives of application, such as the commodity recommendation of e-commerce, the course recommendation of online education and so on.
ACKNOWLEDGMENT
This paper was supported by the National Natural Science Foundation of China (Grant No. 61373147), by the Science and Technology Project of Educational Commission of Fujian Province, China (Grant No. JA14243), by the Project of International Cooperation and Exchanges on Science and Technology of Xiamen University of Technology (Grant No. E201301300).
REFERENCES
[1] Savage, N.S., Baranski, M., Chavez, N.E., &Höllerer, T.(2011) I’m feeling Loco: A Location Based Context Aware Recommendation System, In 8th Int. Symposium on LBS, Vienna.
[2] Noulas, A., Scellato, S., Lathia, N., &Mascolo, C.(2012) A Random Walk Around the City: New Venue Recommendation
in Location-Based Social Networks, In SocialCom’12.
[3] Damianos G., Charalamos K., Konstantinos M., &Grammati P.(2014) Mobile recommender systems in tourism, Journal
of Network and Computer Applications, No.39, pp. 319-333.
[4] Xiao Xia, Xiaodong Wang, & Xingming Zhou.(2013) Evolving recommender system for mobile apps:a diversity
measurement approach, Smart Computing Review, Vol. 3, No. 3, pp. 139-154.
[5] Max S., Thorsten S., &Heiko P.(2014) Enhancing a Location-based Recommendation System by Enrichment with
Structured Data from the Web. WIMS, pp.17.
[6] José M., Noguera N., Manuel J., Barranco M., Rafael J. Segura, Luis M.(2012) A mobile 3D-GIS hybrid recommender
system for tourism, Information Sciences, No.215, pp.37-52.
[7] Bo H., Martin E.(2013) Spatial topic Modeling in Online Social Media for Location Recommendation, RecSys’13.
[8] Jie Bao, Yu Zheng, Mohamed F., &Mokbel. Location-based and Preference-Aware Recommendation Using Sparse
Geo-Social Networking Data.
[9] Konstas I., Stathopoulous V., &Jose, J.M.(2009) On social networks and collaborative recommendation, In
SIGIR’09:Proceedings of the 32nd international ACM SIGIR conference on Research and development in information retrieval, New York, USA.
[10] Levandoski J., Mohamed S., Ahmed E., &Mohamed M.(2012) Lars:A location-aware recommender system, In ICDE.
The Sixteenth International Conference on Electronic Business, Xiamen, December 4-8, 2016
filtering, In SIGIR, ACM, pp. 230–237.
[12] Ma H., Lyu M.R., &King I.(2009) Learning to recommend with trust and distrust relationships, In RecSys, pp.189-196. [13] Konstas I., Stathopoulos V., &Jose, J. M.(2009) On social networks and collaborative recommendation, In SIGIR,
pp.195-202.
[14] Xu Liu, Dongyun Yi.(2011) Complex network community detection by local similarity, Acta Automatic Sinica, Vol.37,
No.12, pp.1520-1529.
[15] Ye M., Yin P., Lee W.C., et al.(2011) Exploiting geographical influence for collaborative point-of-interest
recommendation, Proceedings of the 34th international ACM SIGIR conference on Research and development in
Information Retrieval, ACM, pp.325-334.