Tjalling C. Koopmans Research Institute
Discussion Paper Series nr: 10-09
Why do women still earn less than
men?
Decomposing the Dutch gender pay gap, 1996-2006
Eva Fransen
Janneke Plantenga
Jan Dirk Vlasblom
Tjalling C. Koopmans Research Institute Utrecht School of Economics
Utrecht University Janskerkhof 12 3512 BL Utrecht The Netherlands telephone +31 30 253 9800 fax +31 30 253 7373 website www.koopmansinstitute.uu.nl
The Tjalling C. Koopmans Institute is the research institute and research school of Utrecht School of Economics.
It was founded in 2003, and named after Professor Tjalling C. Koopmans, Dutch-born Nobel Prize laureate in economics of 1975.
In the discussion papers series the Koopmans Institute publishes results of ongoing research for early dissemination of research results, and to enhance discussion with colleagues.
Please send any comments and suggestions on the Koopmans institute, or this series to [email protected]
çåíïÉêé=îççêÄä~ÇW=tofh=ríêÉÅÜí
How to reach the authors
Please direct all correspondence to the last author. Eva Fransen
Janneke Plantenga Jan Dirk Vlasblom Utrecht University
Utrecht School of Economics Janskerkhof 12
3512 BL Utrecht The Netherlands.
E-mail: [email protected]
This paper can be downloaded at: http:// www.uu.nl/rebo/economie/discussionpapers
Utrecht School of Economics
Tjalling C. Koopmans Research Institute Discussion Paper Series 10-09
Why do women still earn less than men?
Decomposing the Dutch gender pay gap,
1996-2006
Eva Fransen Janneke Plantenga
Jan Dirk Vlasblom
Utrecht School of Economics Utrecht University
April 2010
Abstract
Despite major improvements in women’s labour market attachment, women still earn considerably less than men. International research shows that the persistence of the gender pay gap may be due to the fact that although the gap in
characteristics between men and women is diminishing, changes in the wage structure counteract this change. This article will study whether this ‘swimming upstream’ phenomenon is also playing a role in the rather slow convergence
between male and female wages in The Netherlands. Our results indicate that this is not the case; most of the changes in the Dutch wage structure have been rather favourable to women. The lacking convergence in wages has to be explained from the fact that despite the favourable changes, the Dutch wage structure still contains a considerable implicit gender bias.
Keywords: gender pay gap –wage structure - human capital – discrimination
I.
Introduction
Despite major improvements in women’s labour market attachment, the Dutch gender pay is still substantial. According to various sources, women earn approximately 20% less then men and this difference seems to decrease only slowly. The average gender pay gap in Europe is 17% and the Netherlands are outperformed by countries as Belgium, Italy, Denmark, France and Finland (See e.g. Mandel and Semyonov, 2005; Plantenga and Remery, 2006).
The causes of the gender pay gap have been investigated rather thoroughly during the 1970’s and 80’s. During that period, the pay differential was often explained within the context of human capital theory and discrimination. According to human capital theory, women are less successful on the labour market than men because of differences in individual characteristics like education and experience. In order to reduce gender earnings inequality, government policy at that time was strongly targeted towards increasing women’s educational levels and labour force participation rates. At the same time, discrimination was tackled by “equal pay for equal work”-legislation that was implemented in the Netherlands in 1975. The strategy has been rather successful in the sense that women have realized great improvements in their levels of educational attainment. In addition, women’s employment rates have increase with each younger cohort for every age category (OECD, 2002). As this implies that women have been increasingly well-positioned for successful labour market participation, the persistent of the gender pay gap seems rather puzzling. Why hasn’t the gap been closed?
Recent international research on the gender pay gap suggests that pay differences may not only be the result of differences in human capital variables, but are also influenced by a country’s wage structure. That is “the array of prices set for various labour market skills (measured and unmeasured) and rents received for employment in particular sectors of the economy” (Blau and Kahn, 1996b). As men and women differ with respect to experience or work in different sectors, any changes in returns to experience or any difference in the sectoral pay level will have an impact on the gender pay gap (Blau and Kahn, 2003). These changes in the wage structure (‘prices’) could offset the progress that women have made in terms of human capital equalization (‘characteristics’).
Given this outcome from international research, the question can be raised whether this ‘swimming upstream’ (Blau and Kahn, 1997) also plays a role in the persistence of the Dutch gender pay gap. By making use of micro data, covering 1996 and 2006, the change in the gender pay gap is decomposed in several factors, like changes in the human capital and changes in the wage structure. The next section first provides a short overview of the theoretical considerations and previous literature, Section 3 describes the decomposition approach and Section 4 presents the data and the estimation results. Section 5 shows the decomposition results and Section 6 concludes.
II.
Theoretical Considerations and Previous Research
Why do women earn less than men? Within a human capital framework, differences in pay are often explained by individual differences in human capital. Human capital consists of skills and qualifications that are relevant to the employer and human capital differentials are therefore usually seen as a fair source of earnings differentials. The lower skill level of women is interpreted as the result of the traditional division of labour: women spend less time in formal employment than men and are more likely to experience discontinuous work lives. Besides fewer years of experience, they have also less incentive to invest in education and in on-the-job training than men. This results in lower human capital levels and thereby lower productivity levels and wages.
Another factor that is often put forward as a source of earnings differentials is discrimination. Discrimination can take the form of unequal pay for equal work or the form of women having less access to better paid sectors and occupations, all else equal. The Dutch committee on equal treatment still identifies several cases of discrimination each year and the numbers of complaints have not been decreasing over the past couple of years (CGB, 2008) However, it is difficult to obtain an accurate estimate of the impact of discrimination on the gender pay gap. Traditionally it was interpreted as the difference between the observed gender pay gap and the gap adjusted for differences in human capital characteristics. This method has become controversial, however, because gender differences in control variables could as well reflect discrimination. Another bias occurs when not all the
relevant control variables are included in the model (Oaxaca, 1973; Rubery et al., 2002).
A related discussion refers to whether or not separate labour markets exist for men and women. Oaxaca (1973) and Blinder (1973) and all authors following their approach argue that part of the gender pay difference is attributable to the fact that there are two separate markets, each rewarding human capital to their own demand and supply levels. In recent years, however, there are more and more authors that argue that there is in fact only one labour market in which prices are determined to total demand and supply (Blau and Kahn, 1996a; 1996b; 2003; Olsen and Walby, 2004; Datta Gupta et al., 2006; Heinze, 2009). In the view of these authors men and women earn the same in comparable jobs. The fact that they do not earn the same indicates that in general they do not have comparable jobs. Therefore, in their arguing, not only human capital factors are relevant, but also more institutional factors such as the level of occupational segregation and the prices set for certain labour market skills and/or rents received for working in particular sectors, in short the wage structure (Blau and Kahn, 1996b).
The wage structure is affected by the structure of labour supply and demand, technological change and the country’s wage-setting institutions. Strongly innovative firms, for example, may pay higher wages for skilled workers. If a higher incidence of workers in those innovative firms or sector(s) is male, this is likely to increase the gender pay gap, all else equal. Institutional factors also play a role in the sense that centralized wage-setting institutions are likely to reduce inter-firm and inter-industry wage variation and may thereby lower the gender pay gap. Minimum wage floors determine the wages of those at the bottom of the wage distribution. As in practically all countries the female wage distribution lies below the male wage distribution, raising minimum pay levels will benefit women more than men (See e.g. Plantenga and Remery, 2006). In contrast, decentralization and individualization of the pay system could result in an increase of the gender pay gap and could thus offset the progress that women have made in terms of human capital equalization. Blau and Kahn (1997) for example find that rising overall wage inequality in the United States slowed women’s progress during the 1980’s, reclaiming about one-third to two-fifths of women’s potential wage gains. Datta Gupta et al. (2006) also attributed the stagnation of the wage gap in the Nordic countries to unfavourable wage structure effects, which in Denmark more than wiped out any gains that Danish women had
made in their human capital over the period. This raises the question whether also in the Netherlands the trends in the gender wage differential can be explained by women ‘swimming upstream’.
Dutch research
So far, the Dutch research in the area of gender pay differentials has been rather limited. Schippers (1987) performed an extensive study on gender pay differentials in the 1980’s and found that the gender pay gap in the Netherlands was mainly the result of men and women being spread unequally over occupation-levels as opposed to being paid unequally within occupations. He also concluded that human capital differentials were insufficient to explain the total gender pay gap and stated that a large part of the differential that was still unexplained could be attributed to discrimination of some sort. Tijdens et al. (2002) also decomposed the gender pay gap into differences in characteristics and discrimination, but in addition to Schippers also included a few work-related characteristics, such as job tenure, firm size and collectively agreed wages. Using data from the Wage Indicator Survey, they found that 71.5% of the pay gap was explained by differences in characteristics, leaving an unexplained part of 28.5% (Tijdens et al., 2002).
Other quantitative studies that have been performed in the past ten years focused on a single cause or specific gap rather than decomposing the gender pay gap as a whole. For example, De Ruijter et al. (2003) looked at the relation between gender-specific occupations and pay and found that there is a wage penalty associated with working in a female-dominated occupation and that this wage penalty is rather large for both men and women. Compared to the United Kingdom or the United States, however, the wage penalty appears rather small due to the more compressed wage structure in the Netherlands. In addition, the availability of relative well paid part-time jobs in the Netherlands translates into a relatively small occupational gender pay gap. De Ruijter et al. (2003) did not find proof for the crowding hypothesis that states that wages in female-dominated occupations are lower because of an artificially high labour supply. In fact there appear to be large labour supply shortages in many female-dominated occupations. This could be an indication that female-dominated occupations are undervalued relative to their actual production contribution.
Albrecht et al. (2004) studied the gender pay gap for fulltime workers using data from the 1992 wave of the OSA-panel. They concluded that most of the gender pay gap across the distribution is explained by differences in returns to characteristics, as opposed to differences in characteristics themselves. They do not go into details as to what lies behind these different returns. Also Van der Meer (2008), using OSA data covering the period 1986-1998 shows that wage gap is mainly due to price differences, and not to differences in characteristics or gender related productivity differences. Although Van der Meer compares decompositions for various years, he does not give a formal decomposition of the change in the gender wage gap over time. Russo and Hassink (2008) take a career based perspective on the wage gap. They conclude that the wage gap between men and women is an (indirect) effect of working part-time. The larger part of wage increases is due to promotion. However, part-time workers have a smaller probability of promotion than full-time workers. Therefore, over their career, part-time workers will experience less wage increases. As women tend to be more on part-time jobs than men, this will cause a gender wage gap amongst (especially) more mature workers.
Summarizing the results from the previous Dutch literature, there seems to be a certain consensus over the fact that there is more to the gender pay gap than just a difference in human capital. However, most studies focus on a single feature of the gender pay gap and therefore do not provide a complete picture as to why women still earn less than men.
III.
Research Design and Data
In order to analyse the Dutch gender pay gap and whether also in the Netherlands women have been swimming upstream we follow the research design of Blau and Kahn (1997; 2004; 2006). Their design is based on the so-called Juhn-Murphy-Pierce (JMP) decomposition (Juhn et al., 1991; 1993). Using this framework, a male wage equation is estimated:1
1 Datta Gupta et al. (2006) argue that a wage equation of the whole sample is a better reference, as it better reflects the one non-discriminatory wage equation.
β σ θ
= +
ln Yit Xit t t it (1)
where Y is the hourly wage rate, β the vector of coefficients, X a vector of individual- and work-related characteristics. In this equation σ is the standard deviation of the unexplained part (i.e. the dispersion of the residual wage distribution) and θ gives the standardized residual, and as such, is an indication for the position of an individual in the residual wage distribution. The subscript trefers to the year, while the subscript irefers to the male and female values. Based on this single wage regression, the wage gap in year t can be written as:
β σ θ β σ θ β θ σ
=ln Y −ln Y = X + − X + = ∆X + ∆
t mt ft mt t t mt ft t t ft t t t t
Gap (2)
where ∆signifies the average male-female differential in a given year. In Equation 2 the last part is referred to as the ‘quantity effect’, and the last part the ‘residual gap’. The change in the gender wage gap now becomes:
β β σ θ σ θ
= ∆[ X1 1− ∆X0 0]+[ 1∆ 1− 0∆ 0]
Gapchange (3)
which is essentially the sum of the change in the quantity effect and the change in the residual gap. Taking year 1 as the reference year, the above equation can be slightly rewritten in to four parts:
β β β θ θ σ θ σ σ
= ∆( X1− ∆X )0 1+ ∆X (0 1− 0) (+ ∆ 1− ∆ 0) 1+ ∆ 0( 1− 0)
Gapchange (4)
These four parts all show a different effect that contributes to the change in the gender wage gap
observed X’s effect: ( X∆ 1− ∆X )0 β1 (5)
observed prices effect: ∆X (0 β1−β0) (6)
gap effect: (∆θ1− ∆θ σ0) 1 (7)
unobserved prices effect: ∆θ σ0( 1−σ0) (8)
Equation 5 reflects the changes in the gender differences in pay that can be related to different characteristics of men and women: i.e. given the prices, a change in a difference in characteristics has an effect on the wage differential. The observed prices effect in Equation 6 is the impact of a change in prices over time: given differences in characteristics, a change in prices has an effect on the wage differential. The gap effect in Equation 7 reflects the impact of a change in the relative position that women have in the male residual wage distribution, i.e. the part of the change in the wage differential that can be attributed to the fact that women’s positions within the residual distribution change. Finally, the unobserved prices
effects in Equation 8 is the part of the change in the wage differential that can be attributed to the fact that the residual inequality (the dispersion) of the wage distribution changes. As an example: given the fact that women are on average in the lower percentiles of the wage distribution, a widening of the distribution results in an increase in the nominal wage difference. The gender related differences are thus given by Equations 5 and 7 above, as these are directly related to gender differences in observed and unobserved characteristics. The (changes in the) wage structure are reflected in Equations 6 and 8 above. In case characteristics of men and women are not equal, a change in the wage structure may or may not lead to a decrease in the gender pay gap. Only if the price of ‘typical female’ characteristics decreases relative to the price of ‘typical male’ characteristics the change in the wage structure will lead to an increase in the gender pay gap.
In contrast to the more familiar Oaxaca–Blinder decomposition types, in this decomposition there is only a price difference between years, and not between groups within a given year. Aspects of discrimination are therefore not reflected in the observed characteristics effect or the observed prices effect. Rather direct discrimination is reflected by the position in the residual distribution (the gap effect as reflected in Equation 7 above). Discrimination will thus lead to a position in the lower tail of the residual distribution. Given the price of deviating from the ‘average male’, this position in the lower tail of the residual distribution will lead to a lower wage. As stated above, the actual impact depends on nature of the wage distribution: in case of a compressed residual distribution the impact will be limited.
Notice that the JMP-decomposition is not without its problems. There is the usual discussion with respect to the choice of the reference group (male/female/total population). Taking another reference group will lead to a different outcome of the decomposition, as the outcome depends heavily on the estimated prices. Also, the decomposition of the residual can only be interpreted on the basis of some fairly strong assumptions (See e.g. Yun, 2009). However, the JMP-decomposition does make it possible to relate the wage gap to both institutional factors (as influencing the dispersion of the residual) and aspects of discrimination (as reflected by the relative position of women in the distribution).
Data for the decomposition analysis are obtained from the labour supply panel of the Organization of Strategic Labour Market Research (OSA) of 1996 and 2006. This is a labour market survey held among approximately 5000 individuals
that are currently in the potential labour force. The survey provides much personal- and work-related information. With respect to education, it has detailed data on a person’s educational attainment. Regarding lifetime working patterns, OSA provides information on age, years of experience and job tenure. As wages are usually related to the type of job and the sector of economy, a range of variables on the type of work are included, like firm size, sector, supervision and level of the occupation.2 The OSA survey provides net monthly income as well as on working hours. This allows for the computation of hourly wages. For this study, using net income might be a problem, as the Dutch progressive tax system causes net wages to be more equalized than gross wages.3 It is possible however, to estimate a gross income based on reported net income, and using a couple of job and household characteristics. This type of net-gross transformations has been used in previous research using the OSA-data (See e.g. Grift, 1998; Vlasblom, 1998).4 Only observations of those who are currently employed with an employer are used; those attending daytime education have been excluded. We also excluded cases with missing or incorrect information. This leaves us with 2546 observations in 1996 and 2762 in 2006. The logarithm of the derived gross hourly wage rate is used as the dependent variable.
In models of wages, there may be the problem of so-called sample-selection: unobservable characteristics that may influence both the probability of participation as well as the level of the wages. This problem may be particularly relevant for women, as for women there is still a considerable fraction of non-participation. The usual solution for this is to use a procedure by Heckman to correct for the resulting estimation bias (Heckman, 1974; 1979). As the JMP-decomposition method takes the male wage regression as the reference (and does therefore not estimate a model for the female wage regression), there is no need to use a Heckman approach. This in turn allows us to incorporate a number of explanatory factors that are only available
2
Notice that the interpretation of Equation (7) as reflecting ‘discrimination’ might underestimate discrimination if this takes the form of segregation into low paying occupations. Part of the discrimination will end up in the ‘explained part’ of the gender wage difference.
3 See also Van der Meer (2008) who reports a 5 percentage points difference in the before and after tax gender wage gap. 4 For both years, the transformation was done, using the basic tax-tariffs, the general deductions, and the payments to pensions and social security. Not taken into account were housing related costs and deductions, the tax-effects of employer provided cars and other non-monetary forms of payment. This, in general, implies that our estimates of the gross income will be a slight overestimation of the real gross income.
for the working subsample, such as job and sector characteristics into our wage regression.
IV.
Data and Estimation Results
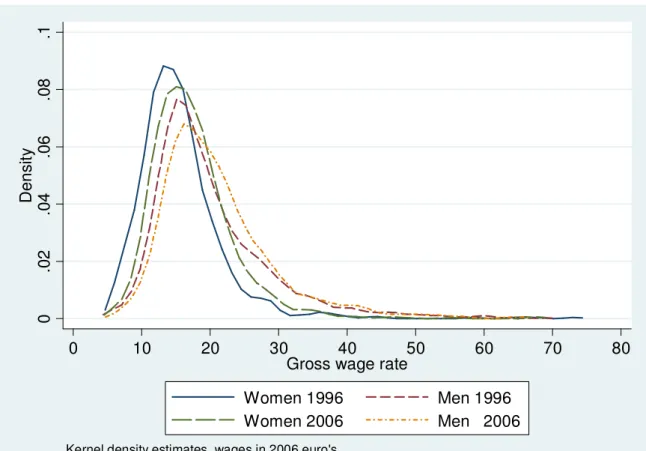
On the basis of the OSA data, Figure 1 presents the wage distributions in 1996 and 2006.5 The first to notice is that in both years the male distribution is more dispersed and shifted to the right compared to the female wage distribution. This is consistent with all studies that show that women are overrepresented in the lower tails of the wage distribution. Comparing the 1996 and 2006 distributions, we can see that both for men and for women, the distribution has shifted upward (even after correcting for the inflation, using the CPI). This suggests that although women started to earn more, their relative position compared to men did only change slightly and slowly. Our data show that the uncorrected gender wage gap declined by 6.7 percentage points to a gap of around 18% in 2006.
5 For this graph we used the CPI as published by the CBS to make the number comparable. Wages are computed at the 2006-price level
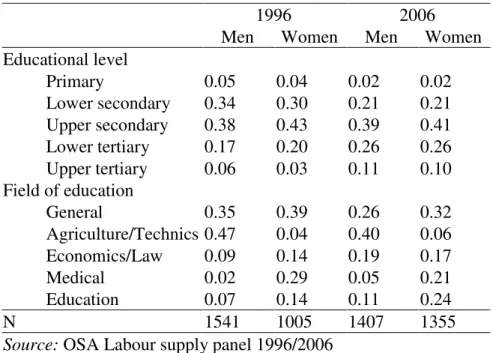
With regard to major characteristics of male and female employees, Table 1 illustrates the changes that took place with respect to male and female educational levels. In many studies it is stressed that women increased their participation rates due to their increase in educational level. However, the effect of this development in terms of relative wages may be rather limited, as from Table 1 it can be seen that both men and women have increased their educational level. The relative position of women compared to men in terms of educational level did therefore hardly change. In 1996, men were slightly overrepresented in both the lower and the upper part of the distribution. By 2006 these small differences have disappeared. So, contrary to common beliefs, the difference between men and women in the labour market with respect to education hardly changed over the last decade.
0 .0 2 .0 4 .0 6 .0 8 .1 D e n s it y 0 10 20 30 40 50 60 70 80
Gross wage rate
Women 1996 Men 1996
Women 2006 Men 2006
Kernel density estimates, wages in 2006 euro's
Figure 1. Gross wage distribution of men and women, 1996 and 2006
Table 1. Educational related variables, working population
1996 2006
Men Women Men Women Educational level Primary 0.05 0.04 0.02 0.02 Lower secondary 0.34 0.30 0.21 0.21 Upper secondary 0.38 0.43 0.39 0.41 Lower tertiary 0.17 0.20 0.26 0.26 Upper tertiary 0.06 0.03 0.11 0.10 Field of education General 0.35 0.39 0.26 0.32 Agriculture/Technics 0.47 0.04 0.40 0.06 Economics/Law 0.09 0.14 0.19 0.17 Medical 0.02 0.29 0.05 0.21 Education 0.07 0.14 0.11 0.24 N 1541 1005 1407 1355
Source: OSA Labour supply panel 1996/2006
Table 1 also shows that there has been a small shift in the choice of educational field of the workforce. These changes are relatively small and seem to be driven mainly by the overall changes in the economy. General education became less popular over the last decade. However, there are gender differences in the changes. The technical educations, for example, became less popular for men, while the number of women in this field increases. At the same time, education in the field of economics, administrative work and law became more popular, mainly for men. As with the level of education, various effects seem to play a role: on the one hand there is the initial choice of individuals for a level and field of education. On the other hand, there is –for women– again the participation effect: in case exit-rates changed for the various types of education, this also changes the composition of the labour force. We have no clear a-priori expectation on the size of the effect on the wage gap of these composition effects: for some fields the difference between men and women became smaller, for others it became larger. Overall, however, the distribution seems to have become more equal, which could have contributed to a more equal pay between men and women.
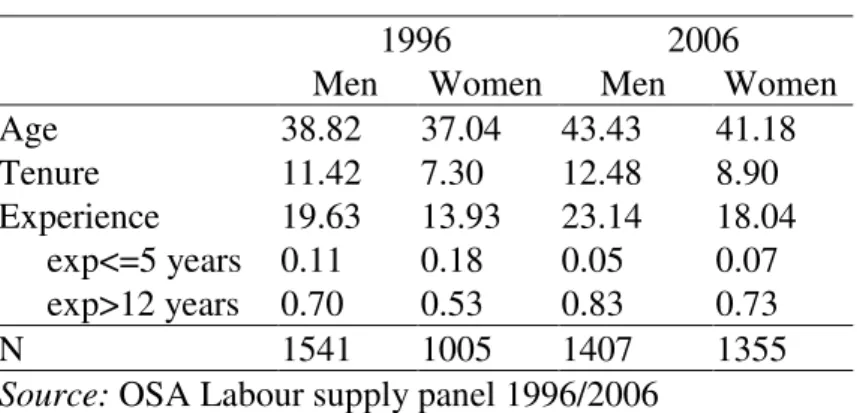
Table 2 shows the life-course related factors in both years: age and experience. It can be seen that over this decade there has been a greying of the Dutch labour force: the average age of the working individuals increased. Directly connected to these trend, there is a strong increase in the work experience of
workers. The increase for women has been larger, as for this group two trends were present: the first was the general greying of the population, and the second one the diminishing exit-rates at marriage and child-birth.
Table 2. Life course related variables
1996 2006
Men Women Men Women
Age 38.82 37.04 43.43 41.18 Tenure 11.42 7.30 12.48 8.90 Experience 19.63 13.93 23.14 18.04 exp<=5 years 0.11 0.18 0.05 0.07 exp>12 years 0.70 0.53 0.83 0.73 N 1541 1005 1407 1355
Source: OSA Labour supply panel 1996/2006
Finally, in Table 3 we present some information with respect to the job-characteristics for men and women in both years. This refers to both the job-level and the sector of industry. Despite the large changes over the last decade with respect to education, participation and experience, not much has changed with respect to the type of job women are in. It became more and more common practice to receive some variable pay (but as the question also includes a non performance related 13th -month, this change is not too informative). With respect to firm size, it can be seen that for both men and women it became slightly more common to work in larger firms. Nevertheless, women more often work in a small firm and this difference hasn’t changed much. With respect to the job level, we have two indications: the first one is relates to the skill level needed for the job and is directly related to the so-called SBC (Standaard Beroepen Classificatie, Standard Classification of Occupations). It appears that in 1996 women were, on average, on lower levels than men. By 2006, women have reached the levels of men in 1996. However, over the last decade, also the number of men in higher occupations increased. As a result, the gender gap in job level increased as the difference between the percentage of men and women working in higher job levels was around 7 percentage points in 1996, compared to 10 points in 2006. The other measure is whether or not any managerial or supervising tasks are involved in the job, as reflected by the number of employees that are supervised. Jobs without supervisory tasks are by far the most common. However, this percentage is declining, in favour of jobs in which a small number of
employees is supervised. The relative difference of men and women seems to have remained rather stable: less than two-third of the men had no supervisory tasks, while for women this percentage is over three-quarter of the female workforce. Finally it appears that the distribution over the sectors changed for both men and women. This mainly reflects the changes in the economy towards a more service-oriented economy over the last decade. The overall difference between men and women hardly changed.
Table 3. Job-related factors, working population
1996 2006
Men Women Men Women Elements of variable pay 0.39 0.21 0.63 0.64 Firm size
1-25 employees 0.24 0.33 0.23 0.30
25-50 employees 0.14 0.11 0.13 0.12
50-500 employees 0.41 0.35 0.40 0.34
more than 500 employees 0.21 0.20 0.24 0.25 Supervising responsibilities in job
no supervisory job 0.63 0.84 0.58 0.78 supervising 1-4 persons 0.16 0.09 0.19 0.13 supervising 5-9 persons 0.08 0.03 0.10 0.04 supervising 10-19 persons 0.06 0.02 0.06 0.02 supervising 20-49 persons 0.04 0.02 0.04 0.02 supervising more than 50 persons 0.02 0.00 0.03 0.01 Job level elementary 0.05 0.10 0.03 0.05 lower 0.29 0.32 0.20 0.30 intermediate 0.38 0.36 0.37 0.35 higher 0.21 0.18 0.32 0.25 scientific 0.08 0.04 0.08 0.05 Sector of industry agriculture 0.02 0.00 0.01 0.01 industry 0.21 0.08 0.16 0.05 construction 0.10 0.01 0.06 0.01 catering 0.16 0.16 0.15 0.12
transport and communication 0.09 0.04 0.09 0.04 commercial services 0.13 0.14 0.21 0.16 other services 0.04 0.05 0.04 0.05 government 0.13 0.08 0.12 0.08 education 0.07 0.11 0.08 0.12 healthcare 0.05 0.33 0.08 0.37 N 1541 1005 1407 1355
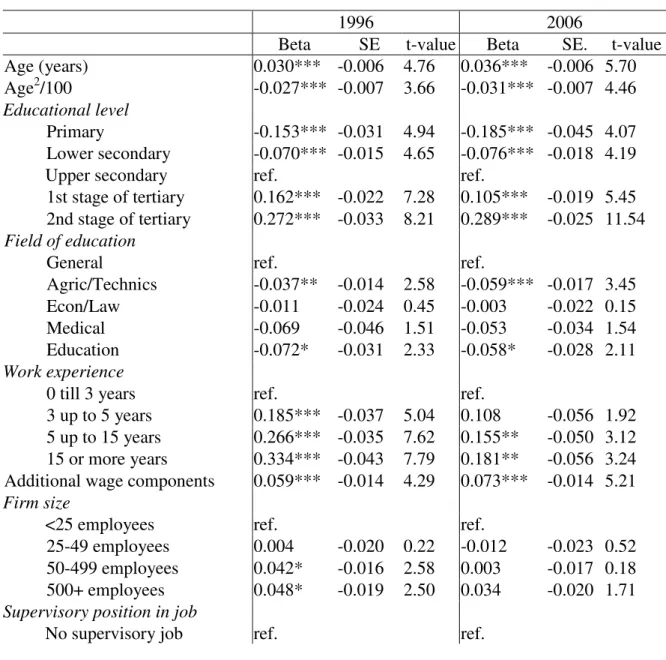
The tables above showed the changes in the characteristics of the workforce, and the changes in the gender gap with respect to these characteristics. The wage gap between men and women, however, also depends on the prices for the various characteristics. In the JMP-decomposition, these prices are estimated by using a male wage regression. Following Juhn et al. we assume that the male wage regression reflects the non-discriminatory prices (Juhn et al., 1991). Table 4 shows the results of the two regressions, including the standard errors and t-values. The parameters of most included explanatory factors are consistent with what could be expected from the theory: the human capital-variables (education, age and experience) are very important in determining a person’s wage.
Table 4. Regression results or the wage equation, 1996 and 2006
1996 2006
Beta SE t-value Beta SE. t-value
Age (years) 0.030*** -0.006 4.76 0.036*** -0.006 5.70 Age2/100 -0.027*** -0.007 3.66 -0.031*** -0.007 4.46
Educational level
Primary -0.153*** -0.031 4.94 -0.185*** -0.045 4.07 Lower secondary -0.070*** -0.015 4.65 -0.076*** -0.018 4.19
Upper secondary ref. ref.
1st stage of tertiary 0.162*** -0.022 7.28 0.105*** -0.019 5.45 2nd stage of tertiary 0.272*** -0.033 8.21 0.289*** -0.025 11.54
Field of education
General ref. ref.
Agric/Technics -0.037** -0.014 2.58 -0.059*** -0.017 3.45 Econ/Law -0.011 -0.024 0.45 -0.003 -0.022 0.15 Medical -0.069 -0.046 1.51 -0.053 -0.034 1.54 Education -0.072* -0.031 2.33 -0.058* -0.028 2.11
Work experience
0 till 3 years ref. ref.
3 up to 5 years 0.185*** -0.037 5.04 0.108 -0.056 1.92 5 up to 15 years 0.266*** -0.035 7.62 0.155** -0.050 3.12 15 or more years 0.334*** -0.043 7.79 0.181** -0.056 3.24 Additional wage components 0.059*** -0.014 4.29 0.073*** -0.014 5.21
Firm size
<25 employees ref. ref.
25-49 employees 0.004 -0.020 0.22 -0.012 -0.023 0.52 50-499 employees 0.042* -0.016 2.58 0.003 -0.017 0.18 500+ employees 0.048* -0.019 2.50 0.034 -0.020 1.71
Supervisory position in job
Supervising 1-4 persons 0.038* -0.017 2.27 0.036* -0.017 2.07 Supervising 5-9 persons 0.096*** -0.023 4.19 0.084*** -0.022 3.85 Supervising 10-19 persons 0.144*** -0.027 5.38 0.071* -0.028 2.56 Supervising 20-49 persons 0.131*** -0.031 4.18 0.138*** -0.033 4.13 Supervising 50+ persons 0.274*** -0.040 6.84 0.168*** -0.039 4.36 Job level
Elementary ref. ref.
Lower 0.019 -0.028 0.67 0.066 -0.037 1.79
Intermediate 0.091** -0.028 3.22 0.158*** -0.036 4.38 Higher 0.214*** -0.033 6.54 0.296*** -0.038 7.81 Scientific 0.285*** -0.039 7.26 0.324*** -0.045 7.28
Sector of industry
Agriculture ref. ref.
Industry -0.038 -0.047 0.82 0.148** -0.057 2.59 Construction -0.054 -0.048 1.13 0.102 -0.061 1.68 Catering -0.062 -0.047 1.31 0.098 -0.057 1.71 Transport/ Communication -0.033 -0.049 0.68 0.137* -0.059 2.33 Commercial services 0.013 -0.049 0.28 0.164** -0.057 2.88 Other services -0.090 -0.054 1.66 0.065 -0.064 1.02 Government 0.010 -0.049 0.2 0.086 -0.059 1.46 Education 0.007 -0.053 0.14 0.039 -0.062 0.63 Healthcare -0.097 -0.053 1.83 0.036 -0.060 0.59 Constant 1.518*** -0.119 12.80 1.479*** -0.128 11.53 Number of observations 1541 1407 SE of the regression 0.232 0.235 R-squared 0.615 0.549 Adjusted R-squared 0.606 0.538 F 68.63*** (35, 1505) 47.70*** (34, 1371)
Source: OSA Labour supply panel 1996/2006, own computations
Notes: *** significant at the 1%-level; ** significant at the 5%-level; * significant at the 10%-level. The regressions are based on the male sample in both years.
Wages for 1996 are measured in Euro’s, and not corrected for price changes.
The effect of age is curved, indicating that the increase in wage tails off; there is a larger increase during younger years and a smaller increase in later years. The wage profile reaches its maximum around the age of 55 in 1996 and shifted upwards to 58 in 2006.
Over the last decade, the pay-differences related to differences in educational level increased. In 2006, all else equal, having completed higher scientific education increases a person’s wage with 28.9 percent in comparison to someone who has finished upper secondary education; this is an increase compared to 1996. In 2006 there is a wage-disadvantage of 18.5% of not having finished any secondary
education. This disadvantage also increased compared to 1996. Also, the wage difference between the 1st level of tertiary education and the upper secondary level has become smaller. In other words, the total of the distribution widened, and the difference between the first and second stage of tertiary education increased. As women tend to be on average in the slightly lower levels, these changes in the prices might have a negative effect on the gender wage gap. A second aspect of education is the field of study. We divided the whole range of educational fields into five groups. Our results show that there is a difference in payment according to these fields (even while we correct for level of education and sector of economy). It turns out that workers who took their education in the technical or agricultural types of education, or in the field of education, earn a lower wage that the workers that completed an education in any of the other fields. Over the last decade the wage disadvantage for the technical types increased, while the disadvantage for those who completed an education in the field of education diminished (both compared to those workers having only general training). As men are overrepresented in the first group, while women are overrepresented in the second, we expect that this price change has lowered the gender wage gap.
As predicted by human capital theory, experience adds to wages. However, the value of experience diminished over the last decade. In 1996, those with three or more years earned a wage almost 18% higher than the inexperienced, while having an experience of more than 15 years yielded a 33% advantage. In 2006, experience still adds to the wage, but at a far lower rate. It now takes at least five years of experience to gain a significant wage advantage, while having more than 15 years only implies an 18% wage advantage.
Characteristics of the job are important as well, stressing the statement by Rubery et al. (2002) that wages are determined by more than just human capital. Having additional wage components, like a share of the profits or performance-based pay, for example, results in higher wages, all else constant. Our results also show that there used to be a structural pay difference between firms of different sizes, the larger firms paying slightly higher wages. However, this difference has become non-significant in 2006. Having supervisory tasks is rewarded by a higher wage, the reward being higher the larger the group that has to be supervised. This is the case for both 1996 as 2006, yet the value of having such tasks did decline over the last decade, perhaps related to the fact that having such tasks has become more and more
common and no longer needs additional rewards. Next to this job-characteristic, we included a general indicator of the job level. Again, it shows that having a high-level job does result in a higher wage rate. The differences are quite considerable, and apply to all job levels above the basic levels. The changes seem to resemble the changes in the reward of educational level: the wage distribution widened. As women are less likely to work in high level jobs, this development may have contributed to the slow decline in the gender wage gap. Sectoral differences in pay seem to matter only since recently. In 1996, there were no differences in pay levels between sectors.
All these developments in returns and premiums are proof of a changing wage structure. The question remains to what extent these changes are responsible for the persistence of the gender pay gap. In order to answer this question, the next section provides a decomposition of the gender gap for the period 1996-2006.
V.
Decomposition of the Change in the Gender Wage Gap
The results of Section 4 can be used to decompose the change in the observed raw wage gap into the four components discussed in the previous section: the observed characteristics part, the observed prices part, the gap effect and the unobserved prices part. In the observed characteristics and observed prices part, we can show the gap for the various (groups of) explanatory variables. We break these down in three groups: education, life time patterns (age and experience) and finally job and sector-characteristics. Table 5 shows the role of these various components in the gender pay gap.
Table 5. Decomposition of the change in the gender wage gap between 1996 and 2006
Decomposition of the gender wage gaps: raw
differential quantity effect residual gap
1996 0.245 0.116 0.129
2006 0.178 0.095 0.083
Changes in the components of the gender gaps
total change quantity effect residual gap
-0.067 -0.020 -0.046
Decomposition of the change in the quantity effect: total predicted gap observed X’s effect observed prices effect Total -0.020 -0.008 -0.012 Education -0.010 0.003 -0.013
Life time patterns -0.014 -0.008 -0.006 Job characteristics 0.004 -0.004 0.007 Decomposition of the change in the residual gap
total gap effect
unobserved price effect
Total -0.046 -0.046 0.000
Note: Computations based on regression results from Table 4, and the mean values of the samples as presented in Tables 1, 2 and 3 above.
The numbers in Table 5 are computed using the equations in Section IV. From the first panel in the table we can see the raw gender wage gap in both 1996 and 2006. It appears that the quantity effect (i.e. the effect of the difference in observed characteristics between men and women) is around half of the total gender difference in pay, slightly less in 1996, slightly more in 2006, implying that over time the explained part of the gender pay difference became slightly more important compared to the residual gap (the unexplained wage difference between men and women). The different impact of the quantity effect and the residual gap can also be seen from the second panel in the table: the total change in the gender wage gap was minus 6.7%. One third of this decline (2%) was due to a decline in the quantity effect, two thirds of the decline (4.6%) can be attributed to the decrease in the residual gap.
When further breaking down the change in the explained part (the quantity effect) into a change in the difference in observed characteristics and observed prices, using Equations 5 and 6, we get the results in the third panel of Table 5. From
these results it can be seen that the changes in the education of male and female workers increased the wage difference, while the change in prices decreased the difference over time. The observed prices effect is the largest, though. Taken together, half of the total explained change (1%) can be attributed to education. Changes in age and experience decreased the wage difference: both the fact that women in the workforce became on average older and more experienced, as well as the fact that long experience is relatively less rewarded in 2006 made that the male-female wage gap declined. The effect of the job-characteristics is mixed: as was noted above, male and female characteristics did slightly converge, leading to a decrease in the gender pay gap. However, the wage structure did also change, more than counteracting this convergence. On this dimension, therefore, the data seem to indicate some ‘swimming upstream’.
Finally in panel four the residual gap is broken down into the gap effect as given in Equation 7 and the unobserved price effect as given in Equation 8. The gap effect shows how women changed their position in the residual distribution of the men; the unobserved price effect shows the reward of being in the tails of this residual distribution. Our results show that the unobserved price-effect is completely absent. This is not totally unexpected given the results in our wage regressions: the standard error of the regression remained almost equal, as can be seen from Table 4. In other words, the price of deviating from the mean did not change over time. Therefore, it has to be concluded that two-thirds of the total decline in the wage gap between men and women can be attributed to the fact that women have become more equal to men with respect to unobserved characteristics and/or are treated more similar.
Following Blau and Kahn in adding the gender specific components and the wage structure (i.e. the prices) to each other, the gender specific components (observed X’s and the gap effect) add up to -0.054 while the price effects (i.e. the wage structure) adds up to -0.013. Both changes contribute to a decline in the gender wage gap over the last decade, but the effects of changes in the wage structure explain only 20% of the total change, while changes in the gender specific characteristics explain the other 80% of the total decline in the wage gap. On the whole, our findings are in contrast with earlier research that showed that women are swimming upstream (Blau and Kahn, 1997; Datta Gupta et al., 2006). The typical pattern of women closing the gap in characteristics, but facing a changing
price-structure that favours ‘typical male’ characteristics has not occurred in the Netherlands. Rather women seem to be floating downstream as both the characteristics and the prices have contributed in lowering the gender wage gap.
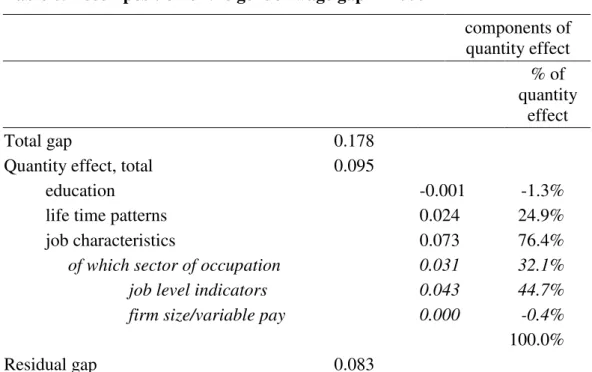
Nevertheless, despite this floating downstream, still a considerable gender wage gap remains. Table 5 indicates that this wage gap is 17.8%, of which over half (9.5 percentage points) can be explained by the quantity effect, i.e. a difference in characteristics between men and women. As a next step, Table 6 provides a decomposition of this quantity effect, indicating that this relates mainly to the job characteristics. More specifically, within the relevant job characteristics the unequal distribution of men and women over the different sectors causes one third of the explained part of the gender pay gap: Male dominated sectors are paid at a higher level than female dominated sectors. This suggests that there is still considerable implicit gender discrimination in the wage structure. In addition, women are still underrepresented in higher level jobs with supervising tasks. This underrepresentation does count for almost 45% of the explained wage gap.
Table 6. Decomposition of the gender wage gap in 2006
components of quantity effect % of quantity effect Total gap 0.178
Quantity effect, total 0.095
education -0.001 -1.3%
life time patterns 0.024 24.9%
job characteristics 0.073 76.4%
of which sector of occupation 0.031 32.1%
job level indicators 0.043 44.7%
firm size/variable pay 0.000 -0.4%
100.0%
Residual gap 0.083
Note: Computations based on regression results from Table 4, and the mean values of the samples as presented in Tables 1, 2 and 3 above.
VI.
Concluding Remarks
Despite major improvements in women’s labour market attachments, the Dutch gender pay is still substantial. According to various sources, women earn approximately 20% less then men and this difference seems to decrease only slowly. In this article we use Dutch micro-data for 1996 and 2006 from the OSA labour supply panel to study the changes in the gender wage gap. We use the decomposition method of Juhn, Murphy and Pierce.
Our results indicate that ‘swimming upstream’ does not explain the slow convergence of the male and female wage levels. Although women increased their educational level, men did the same as a result of which the overall gender difference hardly changed. Changes in the observable prices of education did result in a widening of the wage distribution, yet these changes seem to have favoured the closing of the gender wage gap. Women also seem to have caught up in terms of age and experience. In addition, the change in prices made that very long experiences were rewarded less in 2006 compared to 1996. So, both changes in the characteristics and prices contributed to a decline in the gender wage gap. As a result, contrary to what is often found in international literature, between 1996 and 2006 in the Netherlands women did not swim upstream. They increased their labour market attachment and their skills, while at the same time, the wage structure changed in their favour by a decline in the rewards for typical male characteristics.
Still, there is a gender gap of 18% remaining. Of the gap remaining in 2006, over half of the difference is still related to differences in observed characteristics. A closer look at our estimation results show that there is still a considerable gender bias in the sectoral pay differences: roughly one third of the explained gender gap in 2006 is explained by the fact that male dominated sectors are paid at a higher level than female dominated sectors. Also, women are still underrepresented in higher level jobs with supervising tasks. With respect to the other half of the gap remaining, our results show that the change in the residual gap can be explained by changes in the unobserved characteristics of men and women, like norms and values, but also to aspects of discrimination. Closing the gender pay gap therefore, still calls for effective policies targeted at stable female labour market participation and banning direct and indirect gender wage discrimination.
References
Albrecht, J. W., Van Vuuren, A. and Vroman, S. B. (2004) Decomposing the gender wage gap in the Netherlands with sample selection adjustments, IZA Discussion Paper No. 1400, Forschungsinstitut zur Zukunft der Arbeit (IZA), Bonn.
Blau, F. D. and Kahn, L. M. (1996a) International differences in male wage
inequality: institutions versus market forces, Journal of Political Economy, 104, pp. 791-837.
Blau, F. D. and Kahn, L. M. (1996b) Wage structure and gender earnings differentials: an international comparison, Economica, 63, pp. S29-62.
Blau, F. D. and Kahn, L. M. (1997) Swimming upstream: trends in the gender wage differential in the 1980s, Journal of Labor Economics, 15, pp. 1-42.
Blau, F. D. and Kahn, L. M. (2003) Understanding international differences in the gender pay gap, Journal of Labor Economics, 21, pp. 106-44.
Blau, F. D. and Kahn, L. M. (2004) The US gender pay gap in the 1990’s: slowing convergence, NBER Working Paper Series no. 10853, National Bureau of Economic Research (NBER), Cambridge, USA.
Blau, F. D. and Kahn, L. M. (2006) The US gender pay gap in the 1990s: slowing convergence, Industrial and Labor Relations Review, 60, pp. 45-66.
Blinder, A. S. (1973) Wage discrimination: Reduced form and structural estimates,
Commissie Gelijke Behandeling. (2008) Jaarverslag 2007 [annual report 2007],
Commissie Gelijke Behandeling [Dutch Equal Treatment Commission], Utrecht.
Datta Gupta, N., Oaxaca, R. L. and Smith, N. (2006) Swimming upstream, floating downstream: comparing women's relative wage progress in the united states and denmark, Industrial and Labor Relations Review, 59, pp. 243-66.
De Ruijter, J. M. P., van Doorne-Huiskes, A. and Schippers, J. J. (2003) Size and causes of the occupational gender wage-gap in the Netherlands, European Sociological Review, 19, pp. 345-60.
Grift, Y. K. (1998) Female labour supply, the influence of taxes and social premiums, Thesis Utrecht University, Utrecht.
Heckman, J. J. (1974) Shadow prices, market wages, and labor supply,
Econometrica, 42, pp. 679-94.
Heckman, J. J. (1979) Sample selection bias as a specification error, Econometrica, 47, pp. 153-61.
Heinze, A. (2009) Earnings of men and women in firms with a female dominated workforce - what drives the impact of sex segregation on wages? ZEW Discussion Paper No. 09-012, Zentrum für Europäische Wirtschaftsforschung (ZEW), Mannheim.
Juhn, C., Murphy, K. M. and Pierce, B. (1991) Accounting for the slowdown in black-white wage convergence, in Workers and their wages, (Ed) M. H. Kosters, American Enterprise Institute Press, Washington DC, pp. 107-43.
Juhn, C., Murphy, K. M. and Pierce, B. (1993) Wage inequality and the rise in returns to skill, Journal of Political Economy, 101, pp. 410-42.
Mandel, H. and Semyonov, M. (2005) Family policies, wage structures, and gender gaps: sources of earnings inequality in 20 countries, American Sociological Review, 70, pp. 949–67.
Oaxaca, R. (1973) Male-female wage differentials in urban labor markets,
International Economic Review, 14, pp. 693-709.
OECD. (2002) Employment outlook 2002, Organisation for Economic Cooperation and Development, Paris.
Olsen, W. and Walby, S. (2004) Modelling gender pay gaps, EOC Working papers series No. 17, Equal Opportunities Commission, Manchester.
Plantenga, J. and Remery, C. (2006) The gender pay gap. Origins and policy responses. A comparative review of thirty European countries, European Commission, Luxembourg.
Rubery, J., Grimshaw, D. and Figuereido, H. (2002) The gender pay gap and gender mainstreaming pay policy in EU member states, European Work and
Employment Research Centre (EWERC), Manchester School of Management, University of Manchester Institute of Science and Technology, Manchester, UK.
Russo, G. and Hassink, W. (2008) The part-time wage gap: a career perspective, De Economist, 156, pp. 145-74.
Schippers, J. J. (1987) Beloningsverschillen tussen mannen en vrouwen - een economische analyse, Thesis Utrecht University, Wolters-Noordhoff, Groningen.
Tijdens, K., Dragstra, A., Dragstra, D., van Klaveren, M., Osse, P., Wetzels, C. and Zorlu, A. (2002) Loonwijzers 2001/2002, werk, lonen en beroepen van mannen
en vrouwen in Nederland, AIAS Research Report RR02/10, Amsterdam
Institute for Advanced Labour Studies (AIAS), University of Amsterdam, Amsterdam.
Van der Meer, P. H. (2008) Is the gender wage gap declining in the Netherlands?
Applied Economics, 40, pp. 149.
Vlasblom, J. D. (1998) Differences in labour supply and income of women in the Netherlands and the Federal Republic of Germany, a comparative analysis of the effect of taxes and social premiums, Thesis Utrecht University, Utrecht.
Yun, M. S. (2009) Wage differentials, discrimination and inequality: A cautionary note on the Juhn, Murphy and Pierce decomposition method, Scottish Journal of Political Economy, 56, pp. 114-22.