Using metrics to evaluate and improve text-based
information visualization in 3D urban environment
Fan Zhang Ecole Centrale de Nantes
CERMA UMR 1563 44300, Nantes, France [email protected]
Vincent Tourre Ecole Centrale de Nantes
CERMA UMR 1563 44300, Nantes, France [email protected]
Guillaume Moreau Ecole Centrale de Nantes
CERMA UMR 1563 44300, Nantes, France [email protected]
ABSTRACT
Information visualization is widely involved in our daily life. It develops rapidly in both 2D and 3D environments. In the 3D case, evaluation is a critical problem. Existent evaluation metrics are firstly introduced in this paper. We chose to focus onmathematical metricsonly and several metrics referring existent ones are designed to evaluate a text-based information visualization in 3D urban environment. Afterwards, some modifications of the visualization are gained by constructing processing functions which take into account the object space distance and the screen space distance. A re-evaluation process for the new results is conducted to see if the visualization result is improved or not. Results show that screen space functions have better performance in improving visualization performance, which can provide references for visualization designers to diversify and characterize their visualizations.
Keywords
3D information visualization, mathematical visualization metrics, text visualization, perception.
1
INTRODUCTION
Visualization has penetrated in our life for a long time since its debut. As the development of science and tech-nology, enormous datasets are generated everyday, such as social network posts, outer space exploration, buying goods on-line as well as the governance of the coun-try. Datasets are recorded at any time and at any place. But with a direct view to these raw datasets, few hu-man beings can really understand the inside meanings of what they represent. Hence these datasets have to be processed in a way that human beings can easily under-stand and find new knowledge to there interests to aid them make decisions and choices. Thisprocessis de-fined and described as two forms of visualization by the nature of the raw datasets used [Rhy03] [Nag06]:
• Scientific visualization: means to use interactive visual representations of scientific data, typically physically based, to promote human cognition. It focuses on the visual display of spatial data con-cerning scientific processes such as the bonding of molecules in computational chemistry.
Permission to make digital or hard copies of all or part of this work for personal or classroom use is granted without fee provided that copies are not made or distributed for profit or commercial advantage and that copies bear this notice and the full citation on the first page. To copy otherwise, or re-publish, to post on servers or to redistribute to lists, requires prior specific permission and/or a fee.
• Information visualization: means to use in-teractive visual representations of abstract, non-physically based data to promote human cognition. It focuses on visual metaphors for non-inherently spatial data such as the exploration of text-based documents.
The aim of visualization is to convey information to human beings in a more effective way than analysing raw datasets. The more effective the visualization is, the better it can aid users. Lots of work has been done in both 2D and 3D environment concerning visualiza-tion. For 2D examples, many on-line tools are avail-able, which deal with datasets from various sources such as economy, education, environment and trans-portation. These visualization results are normally rep-resented through graphs with lines, curves, points, bars, surfaces, maps, tables, trees or networks.12
For 3D cases, it is still a young field compared with 2D ones. For scientific visualization, winds, water fluid, smokes, pollutants, industry designs and medical pur-pose based visualizations are the main concerns in 3D environment [Fed01], [Jos12]. One example for 3D information visualization in urban environment is that [Cha07] proposed a highly interactive way to provide intuitive understandings of population census informa-tion to users. The visualized informainforma-tion is projected onto the surface of a 3D city model with different col-ors representing different population density.
1datavisualization.ch
This paper mainly discusses about the evaluation of in-formation visualization in 3D urban environment. Even with much effort paid in 3D information visualization, its evaluation is a critical problem. Visualization met-rics are necessary for this process, which allow us to evaluate visualizations in ways that enable better un-derstanding of data and concepts. It can also help push visualization research to go further by setting follow-able rules for visualization designers to meet [Mil97]. We firstly introduce many widely-accepted visualiza-tion metrics in previous works secvisualiza-tion. In correspon-dence with a text-based 3D information visualization, we chose to focus onmathematicalmetrics and design several metrics that match this visualization so as to evaluate its performance. Afterwards, modifications of the visualization result are conducted taking into ac-count the screen space distance and the object space distance. New results are later evaluated with the same metrics set. Comparisons and analysis are made among these new results to see if the visualization result is im-proved or not. Finally discussions are given in last sec-tion, along with perspectives for the future work.
2
PREVIOUS WORKS ON
VISUAL-IZATION METRICS
Metrics are used to measure and evaluate the quality of an object. Likewise visualization metrics aim to evaluate the quality and performance of the visualiza-tion result. When searching for visualization metrics references, there are lots of records on visualization quality metrics from the field of visualization analytics. These are more for picture based visualizations, kind of image-processing evaluation. The focus might be how correctly an image is representing the typical feature data or the number of feature points visualized. Typical metrics of this type aredata density, occlusion percent-age or screen occupation percentpercent-age[Bra97]. In this case, ascatter plotis always used to help analyse and evaluate the visualization performance [Pen04]. Another type of metrics aims at evaluating human inter-action visualizations. Works as [Oco08] derive metrics from human-computer interaction heuristics, and spec-ify the metrics to emphasize the characteristics of in-teractive visualizations. Proposed metrics are: empow-ering analysis, improving analytic products, collabora-tion, ease of use, immediate feedback, errors and criti-cal incidentsandminimal actions.
Visualization results are supposed to help users make choices or discover new knowledge, hence human per-ception plays an important role in evaluating visualiza-tion performance. [Alb11] proposed a perceptual em-bedding method to select information that bears projec-tions of the data from a psychophysics study and multi-dimensional scaling. Then [Lin11] reviewed perceptual
visual quality metrics to predict picture quality accord-ing to human perception. Metrics of this type could be important information highlighted or not. [Ler12] proposed a method for reducing eye-strain induced by stereoscopic vision. They focused on images with high-frequency contents associated with large disparities so as to remove irritating high frequencies in high disparity zones. Although this work is not dedicated to visualiza-tion evaluavisualiza-tion, but the effort to keep visual quality on the focus point to defocus the blur can be referred for designing human perception related visualizations. Then for the evaluation of high-dimensional data vi-sualization, [Ber11] presented systematized techniques which use metrics to help the visual exploration of meaningful patterns for high-dimensional data. They chose a set of factors to distinguish metrics, visualiza-tion techniques and the visualizavisualiza-tion process itself con-cerning high-dimensional data. Factors are: cluster-ing, correlation, outlier, complex patterns, image qual-ityandfeature preservation.
Above are works dealing with visualization metrics de-scribed with respect to different visualization purposes. Even though currently there is no complete standard description for visualization metrics world-wide, yet we can refer to the work of [Mar07] to systematically summarize metrics mentioned above. He proposed a systemic classification method for visualization metrics taking into account the visualization purpose, the struc-ture of data and the users who employ the visualization. Three types of visualization metrics were defined:
• Mathematical metrics: this kind of metric nor-mally can be computed directly or indirectly from the system, which provides many direct indicators of the visualization, such asnumber of data points and data density - " the more data items repre-sented, the more effective the visualization." Then other widely-used mathematical metrics are: num-ber of dimensions,occlusion percentageand refer-ence context and percentage of identifiable points.
• User-centric metrics: this type of metrics aims to find out how well users involve in visualization. Some task-given user tests are conducted concern-ing these metrics, to acquire the results assee some important features,the time consumed to see the important features, identify a certain object and the overall feelings for finishing tasks.
• Visualization efficiency metrics: what makes a vi-sualization effective? Time to process,ease of ex-pressing and integrating domain knowledge, deal-ing with uncertain/incorrect/dirty data, ease of classification and categorization, flexibility of vi-sualization,query and dataset functionality,high dimensionalityandsummary of results.
3
EVALUATION
One task for this paper is to use metrics to evaluate the performance of information visualization in 3D urban environment. Firstly we introduce the study object.
3.1
Study object
As a support for visualization, we have a dataset based on an annual summer music festival taking place in the city of Nantes, France [Bri13]. In this dataset, each ac-tivity during the festival is processed as anevent, which has four attributes as listed in table 1. There are in total 32 events in this dataset.
Attribute name Descriptions
Name Event name
LoI Level-of-importance
Content Detailed information of event Location Where the event takes place
Table 1: Attributes ofevent
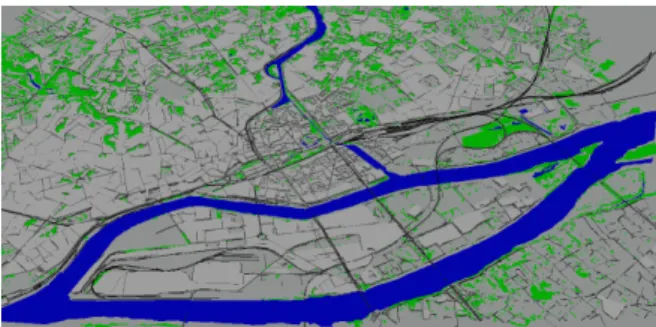
Then a 3D urban environment is needed to function as a background container to embed visualization results. We use the 3D city model of Nantes, France from the work of [He12] as illustrated in figure 1 below, exactly the same city where all the events take place:
Figure 1: The 3D city model of Nantes, France.
3.2
Metrics design
The visualization result of the study object is a 3D scene in which users can zoom in/out, pan or rotate to find in-formation to their interests. It is hard to find metrics for such visualization scenes but we can choose to evaluate the visualization result from a given camera position. Then for visualizations from other camera positions, the evaluation process is exactly the same. When the camera position is decided, the 3D visualization scene turns into 2D visualization result on screen, hence we can refer to the metrics in section 2 to design metrics that match this visualization.
Visualized information can be represented in a variety of forms such as lines, point clouds, figures, symbols or texts. According to the attributes of theevent,textis chosen as the representation form for visualized infor-mation. Soapplicable to textsis the first rule to follow for designing metrics. Then, we have not yet conducted
any user test and the dataset is not large, so we ignore theuser-centric metricand thevisualization efficiency metric, just choose to focus on themathematical metric. Below are the final metrics we use:
• Number of texts on screen: as camera position changes, some texts will be culled out, so the num-ber of texts on screen changes accordingly. We keep a record of this number to work as a refer-ence for information density, written asNT.
• Number of occluded text: if there are two texts with screen size S1, S2, and S1 is the smaller one. When the overlapping part of these two texts is bigger thanS1*0.1, they are considered as oc-cluded, marked asOT. We can further get the oc-clusion percentage from this metric.
• Ratio of all texts surfaces to screen surface: each text has its own screen surface size (2D bounding box on screen), which is firmly related with text lengths. Hence comparisons between the single text surface is of little significance. However we can get the total surfaces of all texts, which leads to an occupation percentage metric: the ratio of all text surfaces to the screen surface, written asRTS.
• Average text font height: after the projection from 3D scene to 2D display on screen, each visualized text has its own font height on screen, so the aver-age text font height from a given camera position can be acquired, which is marked asAFH. Then, the standard deviation ofAFHcan also be com-puted to see if text fonts have big variations and dispersions fromAFH, written asSD_AFH.
• It is meaningless to merely compare SD_AFH without taking into accountAFH, so the ratio of SD_AFHtoAFHis used to study the dispersion degree of text fonts, written asRSDA.
3.3
Primary evaluation
After the evaluation metrics are designed, conducting the evaluation process is scheduled. The visualization is implemented on a 15-inch Apple MacBook Pro with a screen resolution of 1440*900. The open source 3D graphics toolkit, OpenSceneGraph 3.2.1, is used to vi-sualize the 3D urban environment.
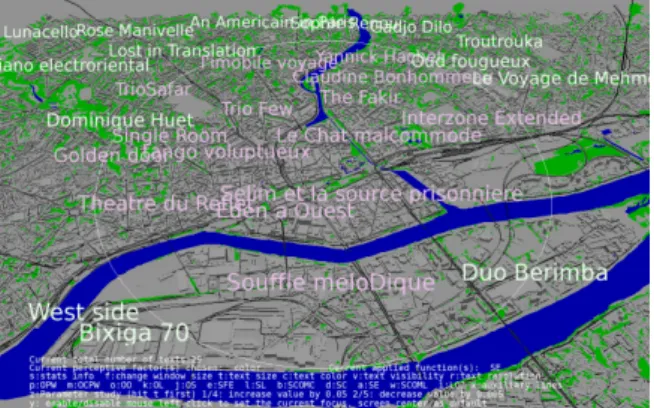
The default information to visualize for event is the name. Text is placed according to thelocationattribute but with an offset inZ-axisso as not to overlay with 3D buildings. Text font heights are gained through the 2D bounding box of texts on screen, achieved withYmax -Ymin. All calculations are based on the pixel unit. The camera position in figure 2 is chosen and metrics values at this time are listed in table 2:
Figure 2: The camera position to conduct evaluation. On the bottom of screen are HUD (head up display) in-structions for users, such as the text number on screen.
NT OT RTS AFH SD_AFH RSDA
29 10 26.8% 40.35 3.55 8.8%
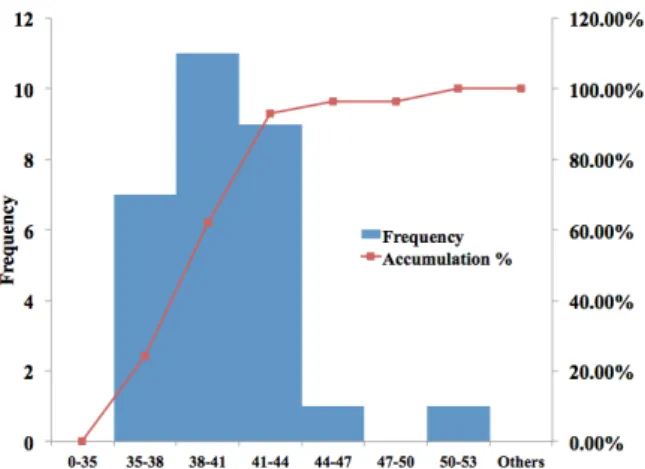
Table 2: Metrics values of the original visualization. From table 2 we can compute the occlusion percentage is more than 30%, which is not a good visualization result. TheRTSat 26.8% is acceptable with good legi-bility for texts as shown in figure 2. And the texts show good similarity with aRSDAat 8.88%. From figure 2 we can see that there is no obvious contrast and differ-ence among the texts. A histogram of the font heights from this camera position is illustrated in figure 3:
Figure 3: The histogram of font heights. 11 out of the 29 font heights belong to the value zone [38, 41] (pixels), followed by 9 texts lie between [41, 44] zone. Then 7 fall to the value zone of [35, 38]. These three parts take up 93% of the text font heights.
4
MODIFICATIONS AND
RE-EVALUATION
In figure 2, visualized texts are almost the same, which will reduce the efficiency for users to find interesting information. We propose a method to modify these texts to make some differences among them. The main idea is that firstly three text related perceptive factors
are chosen: size, colorandtransparency. Then in 3D visualizations, the camera-object distance and the dis-tance between objects on screen can be gained through computation, so we take them as two input parameters: object space distanceDoand screen space distanceDs:
• Object space distance: texts are visualized in 3D environment, the distance from the text to current camera position can be computed, mark asDo.
• Screen space distance: in most cases, visualization results are projected either on computer screens or on other display equipment, which are 2D re-sults. The distance from the text screen position to screen focus point can be gained, mark asDs. The default focus point is the screen center.
Finally many processing functions are constructed us-ing the two input parameters to apply on perceptive fac-tors to modify the visualization result. For these func-tions, their values are normalized between [0, 1] so as to easily combine the different function effects by mul-tiplying them as showed in equation (1):
Out put(s,c,t) =f unctions(Do,Ds)∗base(s,c,t) (1) Each perceptive factor has a system default base and will be multiplied with the function(s) value to get the final output. One drawback of setting the maximum function value as 1 is that it will generate adecrease effect for perceptive factors. However functions can be re-designed according to specific applications. Func-tions are divided into two types according to the param-eter they use: object space functionsandscreen space functions. The evaluation metrics will be used again on new results to verify if there are improvements or not.
4.1
Object space functions
For object space functions,xis the ratio of currentDo to maximumDothat gained at initialized camera posi-tion. The value pair [u, v] is used to change the function shape.uis the maximum value of functions, by default is 1. vis to set the point where function shape has a change. For example, when camera is too close to the text, the function value can be consistent or even is in-valid until thevpoint it begins to take effect.
• Object space linear function: aiming to change the perceptive factor with a continuous linear effect, with object closer to the camera has a bigger value.
OL(x,u,v) =
1−u
vx :x>0,x≤v u :x>v (2)
• Object space sinusoid function: a sinusoid curve which has less sharp transitions thanOLfunction. OS(x,u,v) = 1−u 2(sin( πx v − π 2)−1) :x>0,x≤v 1−u :x>v (3)
• Object space ordering function: aiming to enlarge the effects of objects that are far from the cam-era. In this function, the position of the Near-est text is used to get a tempValue of the func-tion. Currently we use theOL function to com-putetempValue. Then thetempValue is the basis for calculating values of texts at further positions:
OO(Nearest,x,u,v) =Nearest∗tempValue(x,u,v) 4000
(4)
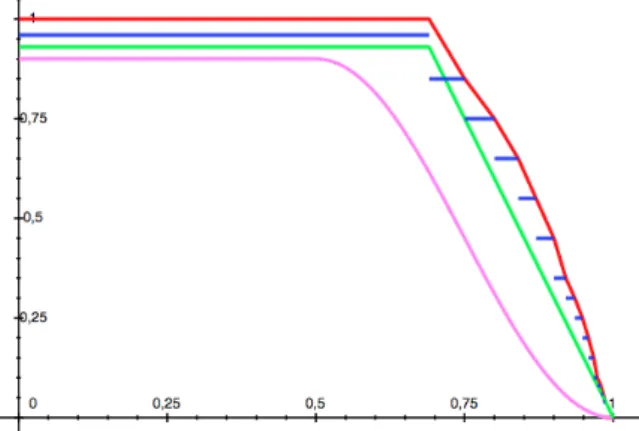
• Object space piecewise function: a continuous piecewise function with six conditions, an im-proved version ofOLfunction, written asOPW. It is hard to put all the conditions of piecewise func-tions into the paper, so it will be illustrated through its function curve in figure 4 below.
• Object space constant piecewise function: a non-continuous piecewise function with more than 10 conditions, written asOCPW.
To have a better understanding of these functions, we illustrate them in figure 4 exceptOO. HereOPW is in red,OCPW in blue ,OSin rose andOLin green. The [u,v] value for each function is set with slight differ-ences so that the curves are not occlude.
Figure 4: Shapes of object space functions exceptOO.
4.2
Screen space functions
For screen space functions, the default focus is the screen center. The parameter x is the screen distance from the text position on screen to the focus point. Users can click a point on screen to set it as the new focus. Similarly,umeans the maximum value of func-tions. vrepresents the changing point of the function curve. An additional iis used to set the point to stop function curve from changing.
• Screen space linear function: Wdis the width of the screen diagonal.
SL(x,Wd) =1− 2∗x
Wd
(5)
• Screen space complex linear function: the chang-ing speed inSLis sharp, hence a complex version is created with changeable function shape:
SCOML(x) = 1 : 0≤x≤i 1− u v−i∗(x−i) :i<x≤v 1−u :v<x≤1 (6)
• Screen space standard cosine function: function values change as a standard cosine curve.
SC(x) =cos(πx
2 ) (7)
• Screen space complex cosine function: with changeable parameters to change function shape.
SCOMC(x) = 1−u+u2(cos(πx v +1) : 0≤x≤v 1−u :v<x≤1 (8)
• Screen space fisheye function: enables the screen center part highlighted while others decreased to generate afisheyeeffect.Hsis the screen height.
SFE(x,Hs) = 1 : 0≤x≤Hs4 0.9 : Hs4 <x≤3Hs 8 0.6 :3Hs8 <x (9)
• Screen space ellipse function: the highlighted part on screen is an ellipse zone. Wsis the horizontal screen width andHsis the vertical screen height.
1= x 2 (i∗Ws)2 +SE(x,Ws,Hs) 2 (u∗Hs)2 (10)
Similarly, curves of all screen space functions are drawn in figure 5 below, with two screen space linear functions in the color of cyan, two cosine functions in purple,SFEin red andSEin green.
4.3
Re-evaluation and analysis
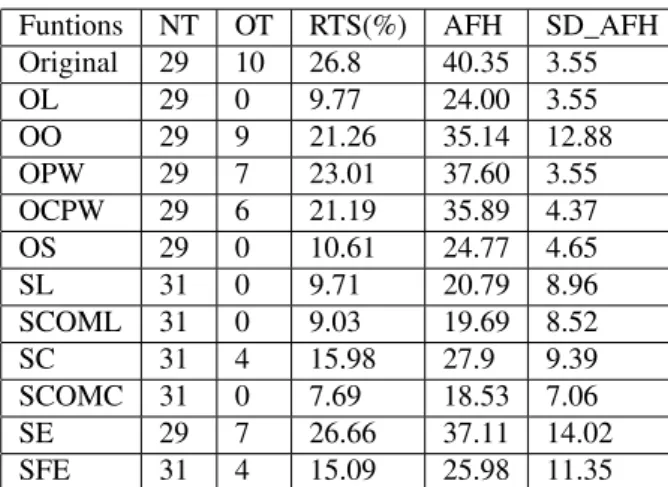
After stating all the processing functions, the next step is to apply processing functions on perceptive factors to generate new results. Three text based perceptive fac-tors proposed in section 4 are textsize, colorand trans-parency. Text size is firstly chosen to be processed. Processing functions are applied one by one from the camera position in figure 2. There are in total 11 results after applying processing functions. It is impossible to put all the results in this paper, so we firstly summarize the values of metrics proposed in section 3.2 for all the processing functions, then choose several typical results to illustrate. Metrics values are listed in table 3 and 4:
Funtions NT OT RTS(%) AFH SD_AFH
Original 29 10 26.8 40.35 3.55 OL 29 0 9.77 24.00 3.55 OO 29 9 21.26 35.14 12.88 OPW 29 7 23.01 37.60 3.55 OCPW 29 6 21.19 35.89 4.37 OS 29 0 10.61 24.77 4.65 SL 31 0 9.71 20.79 8.96 SCOML 31 0 9.03 19.69 8.52 SC 31 4 15.98 27.9 9.39 SCOMC 31 0 7.69 18.53 7.06 SE 29 7 26.66 37.11 14.02 SFE 31 4 15.09 25.98 11.35
Table 3: Metrics values after applying functions.
Ori* OL OO OPW OCPW OS
8.8 14.8 36.7 9.4 12.2 18.8
SL SCOML SC SCOMC SE SFE
43.1 43.3 33.7 38.1 37.8 43.7
Table 4: Values ofRSDA(%) after applying functions. *Ori represents the original camera position result. To better analyse the new results, contents in table 3 and 4 are illustrated in figure 6 below:
Figure 6: A visual comparison of metrics values. After applying processing functions, most of the screen space functions have an increase inNTexceptSE. Then
for all the object space functions, there is no improve-ment concerning NT. However all the results reduce theOT, among whichOL, OS, SL, SCOML, SCOMC functions even reduce theOTfrom 10 to 0.
As stated before, the decrease effect of processing func-tions is inevitable due to the normalization of funcfunc-tions. ForRTS, the maximum values is 26.66% ofSE func-tion, which is quite close to that of the original result. The minimum one is SCOMC function at 7.69%. A very lowRTSmeans that visualized texts on screen oc-cupy small part of the display equipment, which is not good for a visualization. Results of these two functions are illustrated separately in figure 7 and figure 8.
Figure 7: SEfunction result. After applyingSE func-tion, theNTis 29 and the OT is reduced to 7. It has the maximumRTSvalue, which is close to that of the original result.
Figure 8:SCOMCfunction result. At this time, theNT is increased to 31 and there is no occluded text, which is better than the original visualization result. However, the average legibility for texts decreases sharply, only those near the screen center remain legible.
The maximum value forAFHis theOPWfunction at 37.6 pixels as illustrated in figure 9, and the minimum one belongs toSCOMCfunction at 18.53 pixels. For SD_AFH, the maximum value goes toSEfunction at 14.02 pixels and the minimum is 3.55 pixels ofOPW function in figure 9 andOLfunction in figure 10. One thing to notice is that these two functions have the same SD_AFHvalue as the original result.
Figure 9: OPWfunction result. NTis 29 andOTis 7. It has the sameSD_AFHat 3.55 pixels as the original result and theAFHis 37.6 pixels, a bit smaller than that of original one at 40.35 pixels. Even though the values of metrics are quite close, still visual differences exist.
Figure 10: OLfunction result. NT is 29 andOT is 0. The SD_AFHvalue is 3.55 pixels, the same value as the original one. However itsAFHis 24 pixels, almost half the value of original one.
Finally forRSDA, the maximum value belongs toSFE function at 43.7% as illustrated in figure 11. The min-imum occurs toOPW function at 9.4%, which is quite close to the original value at 8.8%.
Figure 11: SFEfunction result. TheNT is 31 andOT is 4. The two circles represent the zone of thefisheye. With the maximumRSDAvalue, this result works well at making hight contrast among texts, which can be a reference to highlight information.
From analysis above we can conclude that object space functions are good at maintaining information density since they did not increase the number of texts visu-alized. And the similarity among visualized informa-tion is guaranteed. For screen space funcinforma-tions, they can improve the information density and they have bet-ter performance in contrasting information, more varied and dispersed. Some functions have very close metrics results, still the results look quite different from each other, such as theSFEresult and the original result. In brief, screen space functions proposed in this paper are more interesting than object space functions. When designing a 3D information visualization, methods and techniques as these screen space functions can help di-versify and characterize the visualization result.
5
DISCUSSIONS AND PERSPECTIVES
This paper mainly deals with a text-based information visualization in 3D urban environment. Several metrics are designed on the basis of existent ones to evaluate its performance. In order to modify and improve the visualization result, many processing functions taking into account the screen space distance and the object space distance are constructed to apply on selected text related perceptive factors. We mainly illustrate the text size. The re-evaluation after applying processing func-tions indicates that when dealing with such an informa-tion visualizainforma-tion, screen space based modificainforma-tions are more effective than object space ones as to improve vi-sualization performance, especially in highlighting and contrasting important or interesting information. We just illustrate the performances concerning text size. But it is possible to apply functions on other perceptive factors as illustrated in figure 12, 13 and 14:
Figure 12:SEfunction applied oncolorfactor. However when this kind of factor is involved, the met-rics no longer work, so user tests need to be conducted to complete the evaluation. Then more perceptive fac-tors are expected, such as the text font. Processing functions also need improving, such as for screen space functions, the multi-focus model should be supported and the possibility for users to interact with parameters within functions should also be considered.
Figure 13:OOfunction applied oncolor, size.
Figure 14:SCapplied oncolor, size, transparency.
6
REFERENCES
[Alb11] Albuquerque, G., Eisemann, M., and Mag-nor, M. Perception-based visual quality measures. Proceedings of IEEE Visual Analytics Science and Technology (VAST), pp. 13-20, 2011. [Ber06] Bertini, E. and Santucci, G. Visual quality
metrics. Proceedings of the AVI Workshop on BE-yond Time and Errors: Novel Evaluation Methods for Information Visualization, pp.1-5, 2006. [Ber11] Bertini, E., Tatu, A., and Keim, D. Quality
metrics in high-dimensional data visualization: an overview and systematization. IEEE Transac-tions on Visualization and Computer Graphics, Vol.17, No.12, 2203-2212, 2011.
[Bra97] Brath, R. Metrics for effective information vi-sualization. Proceedings of IEEE Symposium on Information Visualization, pp.108-111, 1997. [Bri13] Brinis, S. Création d’un corpus structuré des
données urbaines et architecturales pour une ap-plication de visualisation en 3D. Master the-sis, École nationale supérieure d’architecture de Nantes, 2013.
[Cha07] Chang, R., Wessel, G., Kosara, R., Sauda, E. and Ribarsky, W. Legible cities: focus-dependent multi-resolution visualization of urban relation-ships. IEEE Transactions on Visualization and Computer Graphics, Vol.13, No.6, pp.1169-1175, IEEE Computer Society, 2007.
[Fed01] Fedkiw, R., Stam, J. and Jensen, H.W. Visual simulation of smoke. Proceedings of 28th Annual Conference on Computer Graphics and Interac-tive Techniques, pp.15-22, 2001.
[Gri02] Grinstein, G.G., Hoffman, P., Laskowski, S.J. and Pickett, R.M. Benchmark Development for the evaluation of visualization for data min-ing. Information Visualization in Data Mining and Knowledge Discovery, pp.129-176, Morgan Kaufmann, 2002.
[He12] He, S., Moreau, G. and Martin, J.Y. Footprint-based generalization of 3D building groups at medium level of detail for multi-scale urban vi-sualization. International Journal on Advances in Software, Vol.5, No.3&4, pp.377-387, 2012. [Jos12] José, R.S., Pérez, J.L. and Conzalez, R.M.
Advances in 3D visualization of air quality data. Proceedings of Usage, Usability and Utility of 3D City Models, No.02002, 2012.
[Ler12] Leroy, L., Fuchs, P. and Moreau, G. Vi-sual fatigue reduction for immersive stereoscopic displays by disparity, content, and focus-point adapted blur. IEEE Transactions on Industrial Electronics, 59(10), pp.3998-4004, 2012. [Lin11] Lin, W. and Jay Kuo, C. C. Perceptual visual
quality metrics: a survey. Journal of Visual Com-munication and Image Representation, Vol.22, No.4, pp.297-312, 2011.
[Mar07] Marrero, N. Visualization metrics: an overview. Visualization, 2007.
[Mil97] Miller, N., Nakamura, B. and Whitney, P. The need for metrics in visual information anal-ysis. Proceedings of the 1997 Workshop on New Paradigms in Information Visualization and Ma-nipulation, pp.24-28, 1997.
[Nag06] Nagel, H.R. Scientific visualization versus information visualization. Workshop on state-of-the-art in scientific and parallel computing, Swe-den, 2006.
[Oco08] O’Connell, T. A., and Choong, Y. Y. Metrics for measuring human interaction with interactive visualizations for information analysis. Proceed-ings of the SIGCHI Conference on Human Factors in Computing Systems, pp.1493-1496, 2008. [Pen04] Peng, W., Ward, M. O., and Rundensteiner,
E. A. Clutter reduction in multi-dimensional data visualization using dimension reordering. Pro-ceedings of IEEE Symposium on Information Visualization, INFOVIS 2004, pp.89-96, 2004. [Rhy03] Rhyne, T. M., Tory, M., Munzner, T., Ward,
M. O., Johnson, C., and Laidlaw, D. H. Infor-mation and scientific visualization: separate but equal or happy together at last. In IEEE Visual-ization, Vol.3, pp.611-614, 2003.