Hester du Plessis
Thesis presented in partial fulfilment of the requirements
for the degree of Master of Education
in the Department of Curriculum Studies
Faculty of Education
at
Stellenbosch University
Supervisor: Dr Mdutshekelwa Ndlovu Co-supervisor: Prof Magda Fourie- Malherbe
ii
DECLARATION
I, the undersigned, hereby declare that the work contained in this thesis is my own original work and that I have not previously in its entirety or in part submitted it at any university for a degree.
Signature:
Date:
Copyright © 2015 Stellenbosch University All rights reserved
iii
ABSTRACT
In today’s hi-tech global economy the fields of science, technology and engineering are becoming increasingly and undeniably central to economic growth and competitiveness, and will provide many future jobs. Qualifications in Mathematics are crucial gateways to further education and will provide access to the Science, Technology, Engineering and Mathematics (STEM) industries.
This study focuses on the optional course in Mathematics, called Advanced Programme Mathematics (APM), which is offered and assessed by the Independent Examination Board in the final three years of high school in South Africa.
At present, the South African school system does not adequately prepare students for the transition from school to university Mathematics, and APM has been designed to address this gap. The research question set by this study is: To what extent does the APM course succeed in preparing learners for the rigour of first-year Mathematics in the STEM university programmes?
The sample group of 439 students was selected from the 2013 cohort of first-year Mathematics students at Stellenbosch University. First, an analysis of the relevant curricula was undertaken, and then an empirical investigation was done to determine the differences in performance between first and second semester examinations of first-year university Mathematics students who took APM, and those who did not. This was followed by an investigation by means of a questionnaire into the perceptions of students on how effective APM was in easing the transition from school to university Mathematics. The research was designed according to the Framework for an Integrated Methodology (FraIM) of Plowright (2011).
From an extensive international literature study, it appears that APM is definitely a predictor of post-secondary success. Since no formal research has been recorded to support this claim, this study aims to provide a sound answer to whether APM is advantageous. The effect size results of this study show that APM marks of students explain 68% of the achievement in first-semester university Mathematics when combined with NSC Mathematics marks in a general regression model.
iv
There is a significant difference between the marks of students who took APM and those who did not in first-semester university Mathematics, specifically across the National Senior Certificate (NSC) Mathematics mark categories of 80-100%. APM course-taking leads to confidence in Mathematics, which combined with good domain knowledge of calculus, ease the transition from school to university Mathematics.
The study recommends that not only students who intend pursuing a career in the STEM industries should take the APM course, but also those who intend to apply for admission to any other tertiary studies, as the cognitive and other skills provided by APM will give them the required edge to perform well in higher education. Schools are called upon to provide access to APM for mathematically gifted students, and teachers and guidance counsellors should encourage learners to enrol for AMP. This will enable them to share in the manifold academic and personal benefits accruing from the course, and to help alleviate the critical shortage of graduates in careers requiring a strong Mathematics background in South Africa.
v
OPSOMMING
In die hoë-tegnologie-wêreldekonomie van vandag word die gebiede van wetenskap, tegnologie en ingenieurswese toenemend en onmiskenbaar die kern van ekonomiese groei en mededingendheid wat in die toekoms baie werkgeleenthede sal bied. Kwalifikasies in Wiskunde open beslis baie deure na verdere opleiding en verleen toegang tot die Wetenskap-, Tegnologie- Ingenieurswese- en Wiskunde-industrieë.
Hierdie studie fokus op die opsionele kursus in Wiskunde, genaamd Gevorderde Program Wiskunde (GPW), wat deur die Onafhanklike Eksamenraad aangebied en geassesseer word in die laaste drie jaar van hoërskoolonderrig in Suid-Afrika. Tans berei die Suid-Afrikaanse skoolstelsel nie studente genoegsaam voor vir die oorgang van skool- na universiteitswiskunde nie en GPW is ontwerp om hierdie gaping te oorbrug. Die navorsingsvraag wat hierdie studie stel, is: In watter mate slaag die GPW-kursus daarin om leerders voor te berei vir die streng vereistes van eerstejaar-Wiskunde in die Wetenskap-, Tegnologie- Ingenieurswese- en Wiskunde-universiteitsprogramme?
Die toetsgroep van 436 studente is gekies uit die 2013-groep eerstejaar-Wiskundestudente aan Stellenbosch Universiteit. Aanvanklik is ᾽n analise van die relevante leerplanne onderneem, waarna ᾽n empiriese ondersoek gedoen is om die verskille in prestasie in die eerste en tweede semester eksamens vas te stel tussen eerstejaar-Wiskundestudente op universiteit wat wel GPW geneem het en diegene wat dit nie geneem het nie. Dit is gevolg deur ᾽n ondersoek deur middel van ᾽n vraelys na die persepsies van studente oor hoe effektief GPW was om die oorgang van skool- na universiteitswiskunde te vergemaklik. Die navorsing is ontwerp op grond van ‘n model vir ‘n geïntegreerde metodologie van Plowright (2011).
Dit blyk uit ᾽n uitgebreide studie van internasionale literatuur dat GPW definitief ᾽n voorspeller van post-sekondêre sukses is. Aangesien geen formele navorsing om hierdie aanspraak te ondersteun nog op skrif gestel is nie, poog hierdie studie om ᾽n deurdagte antwoord te verskaf op die vraag of GPW wel tot voordeel van studente is.
vi
Die effek grootte resultate van hierdie studie dui aan dat die GPW-punte van studente 68% van prestasie in Wiskunde in die eerste semester op universiteit verduidelik as dit in ᾽n algemene regressiemodel met die Nasionale Senior Sertifikaat (NSS) punte gekombineer word. Daar is ᾽n beduidende verskil tussen die Wiskundepunte van studente wat GPW geneem het en diegene wat dit nie geneem het nie in die eerste semester op universiteit, veral in die NSS-Wiskundepuntekategorieë van 80-100%.
Om die GPW-kursus te neem, lei tot selfvertroue in Wiskunde, wat saam met ᾽n goeie kennis van die Differensiaalrekening-domein, die oorgang van Wiskunde vanaf skoolvlak na universiteitsvlak vergemaklik.
Op grond van die studie beveel die navorser aan dat nie slegs studente wat ᾽n loopbaan in Wetenskap-, Tegnologie- Ingenieurswese- en Wiskunde-rigtings wil volg, die GPW-kursus behoort te volg nie, maar ook diegene wat vir toelating tot enige ander tersiêre studie wil aansoek doen, aangesien die kognitiewe en ander vaardighede wat GPW ontwikkel, hulle die nodige voorsprong sal bied om goed te vaar in verdere studie. Skole word aangemoedig om toegang tot GPW aan wiskundig begaafde leerlinge te verskaf en onderwysers en loopbaanraadgewers behoort leerlinge aan te moedig om vir GPW in te skryf. Sodoende kan hulle deel in die vele akademiese en persoonlike voordele wat die kursus bied, en help om die kritieke tekort aan gegradueerdes in die studierigtings waar ‘n sterk Wiskunde agtergrond ‘n vereiste is, te help verlig.
vii
ACKNOWLEDGEMENTS
The writing of this thesis was not only a challenge for me, but also affected the lives of a number of people around me. I would like to express my gratitude to these people:
My supervisors Dr Mdutshekelwa Ndlovu and Prof Magda Fourie-Malherbe, for the role they played as mentors in sharing their wealth of knowledge and experience in the higher education field with me, while also providing critical analysis and encouragement.
My father Martin, brother Bernard, and friend Michael for their patience and invaluable assistance from the initial structuring of my thoughts to the final product.
Annie, Marnus, and my mother, Ellen, for caring, encouraging and believing in me!
My close friends and colleagues for their interest and encouragement.
Prof Daan Nel for much appreciated help with the statistical analyses and Marinda van Rooyen for her help with the distribution of the questionnaire.
My friend Loumarie Kistner for unselfishly sharing her expertise in statistics and technical editing on numerous occasions.
The Mathematics Department of Stellenbosch University, the Independent Examination Board, as well as Jean de Villiers for their willingness to provide data and information needed.
In addition, I would like to thank Stellenbosch University for providing the institutional support within which this research could be undertaken.
viii
DEDICATION
I dedicate this thesis to all the Advanced Programme Mathematics learners whom I have taught over the past six years. Your enthusiasm and energy made teaching and life worthwhile!
ix
ACRONYMS
ANA Annual National Assessments
AP Advanced Placement
APM Advanced Programme Mathematics
CASS CDE
Continuous Assessment
Centre for Development and Enterprise
CIE Cambridge International Examinations
CHE Council on Higher Education
DBE Department of Basic Education
DHET Department of Higher Education and Training
DoE Department of Education
FET Further Education and Training
FYGPA First year grade point average
GCE General Certificate of Education
GET General Education and Training
HE Higher Education
HESA Higher Education South Africa
HG Higher grade
IBDP International Baccalaureate Diploma Programme
IEB Independent Examination Board
NCS NBT
National Curriculum Statement National Benchmark Tests NQF
NSC
National Qualifications Framework National Senior Certificate
NRC National Research Council
x
PIRLS Progress in International Reading and Literacy Studies
SACMEQ Southern and Eastern African Consortium for Monitoring Educational
Quality SAQA
SC
South African Qualifications Authority Senior Certificate
SES Socio-economic status
SET Science, Engineering and Technology
SG Standard grade
SAIRR South African Institute for Race Relationships
STEM Science, Technology, Engineering and Mathematics
SU Stellenbosch University
TIMSS Trends in International Mathematics and Science Study
UCT University of Cape Town
UNESCO United Nations Educational, Scientific, and Cultural Organisation
xi
TABLE OF CONTENTS
DECLARATION ... ii ABSTRACT ... iii ACKNOWLEDGEMENTS ... vii DEDICATION ... viii ACRONYMS ... ix TABLE OF CONTENTS ... xiLIST OF FIGURES ... xvii
LIST OF TABLES ... xix
CHAPTER 1 INTRODUCTION AND ORIENTATION TO THE STUDY ... 1
1.1 INTRODUCTION ... 1
1.2 CONTEXT IN WHICH THE RESEARCH TOOK PLACE ... 2
1.2.1 National context: Education in South Africa ... 2
1.2.2 Policy context ... 11
1.2.3 Organisational context: Stellenbosch University ... 12
1.2.4 Professional context: The researcher’s experience ... 13
1.3 PROBLEM STATEMENT ... 14
1.4 PURPOSE AND SIGNIFICANCE OF THE STUDY ... 16
1.5 RESEARCH QUESTION ... 17
1.6 OBJECTIVES ... 17
1.7 THE RESEARCH PROCESS ... 18
1.7.1 Research design and methodology ... 18
1.7.2 The participants and research data ... 19
1.7.3 Analysis of the data ... 19
xii
CHAPTER 2 LITERATURE REVIEW ... 21
2.1 INTRODUCTION ... 21
2.2 THE CONCEPT OF AN ADVANCED PLACEMENT COURSE ... 22
2.2.1 AP courses in the USA ... 23
2.2.2 Other international courses with curricula similar to those of AP courses ... 24
2.2.3 AP courses in South Africa ... 26
2.3 THE HISTORY OF AP PROGRAMMES IN THE USA ... 27
2.4 THE ADVANCED PROGRAMME MATHEMATICS COURSE IN SOUTH AFRICA ... 30
2.5 THE HISTORY OF APM IN SOUTH AFRICA ... 31
2.5.1 Curriculum development in South Africa in the post-apartheid era.. 31
2.5.2 The development of the APM course ... 32
2.6 GLOBAL CONCERNS ABOUT AP PROGRAMMES CONCEPTUALISED IN SOUTH AFRICAN CONTEXT ... 34
2.6.1 Curriculum issues ... 35
2.6.2 Issues related to increased access ... 36
2.6.3 The financial cost aspect of AP programmes ... 38
2.6.4 AP courses as an indicator of a school’s quality ... 39
2.6.5 Non-academic implications of enrolling for an AP course ... 40
2.6.6 The possible academic benefits of AP ... 41
2.7 SUMMARY ... 46
CHAPTER 3 THEORETICAL FRAMEWORK ... 47
3.1 INTRODUCTION ... 47
3.2 CHOOSING A RESEARCH FRAMEWORK ... 47
3.2.1 Phenomena in Mathematics education ... 47
3.2.2 The nature of research frameworks... 49
xiii
3.3 PERSPECTIVES ON CURRICULA ... 56
3.3.1 The curriculum and student learning ... 56
3.3.2 The South African OBE Mathematics curriculum ... 57
3.3.3 Thinking skills required in the transition from school to university Mathematics ... 61
3.4 STUDENT SUCCESS AT UNIVERSITY ... 64
3.4.1 The concept ‘student success’ ... 64
3.4.2 Prominent theories on student success ... 65
3.4.3 Variables predicting students’ academic success ... 67
3.4.4 Cognitive ability as a determinant of academic achievement ... 67
3.4.5 Non-cognitive predictors of academic achievement ... 68
3.5 THEORIES ON STUDENT SUCCESS IN MATHEMATICS ... 70
3.5.1 Bandura’s self-efficacy theory ... 71
3.5.2 The self-confidence theory ofStankov ... 77
3.5.3 The mathematical empowerment theory of Ernest ... 79
3.5.4 Ackerman, Kanfer and Beier’s findings on APM as domain knowledge ... 82
3.5.5 Synthesis ... 83
3.6. A CONCEPTUAL FRAMEWORK FOR THIS STUDY ... 84
3.7 SUMMARY ... 85
CHAPTER 4 RESEARCH METHODOLOGY ... 87
4.1 INTRODUCTION ... 87
4.2 PLANNING THE RESEARCH ... 87
4.2.1 Traditional research approaches and paradigms ... 88
4.2.2 The research design for this study ... 91
4.2.3 The research question ... 94
4.3 CURRICULAR ANALYSES ... 94
xiv
4.3.2 The sample documents ... 95
4.3.3 Evaluating the evidence ... 96
4.3.4 Ethical issues ... 97
4.4 COMPARISON OF STUDENT PERFORMANCE ... 97
4.4.1 Introduction ... 97
4.4.1 Participants and sampling ... 98
4.4.2 Research instruments ... 107
4.4.3 Instrument reliability and validity ... 107
4.4.4 Data collection procedures ... 109
4.4.5 Data analysis procedures ... 109
4.5 SURVEY QUESTIONNAIRE ... 112
4.5.1 Participants and sampling ... 112
4.5.2 Research Instruments ... 113
4.5.3 Method of data collection ... 115
4.5.4 Analysis of data ... 115
4.6 ETHICAL CONSIDERATIONS ... 117
4.6.1 Ethical issues associated with the research question ... 117
4.6.2 Ethical issues associated with the content ... 118
4.6.3 Ethical issues associated with the participants ... 118
4.6.4 Ethical issues regarding data and data analysis and reporting ... 118
4.7 LIMITATIONS ... 119
4.8 CONCLUSION ... 119
CHAPTER 5 PRESENTATION AND INTERPRETATION OF RESEARCH RESULTS ... 120
5.1 INTRODUCTION ... 120
5.2 SECONDARY RESEARCH QUESTION A ... 121
xv
5.2.2 Comparison of the nature of the curricula of NSC Mathematics
and APM ... 124
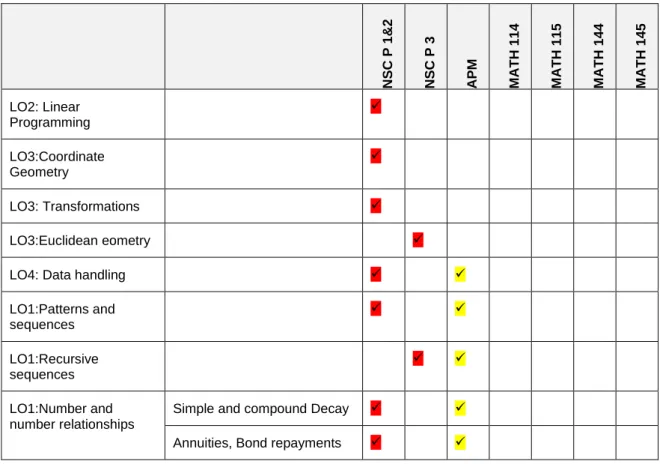
5.2.3 Comparison of content of syllabi ... 125
5.2.4 Comparison of the content weighting of Calculus in different curricula ... 130
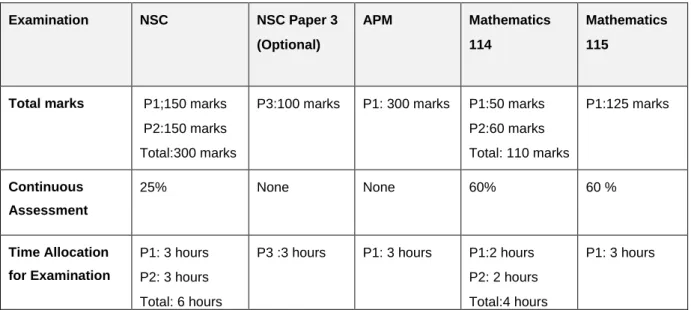
5.2.5 A comparison of examination mark totals and time allocation ... 131
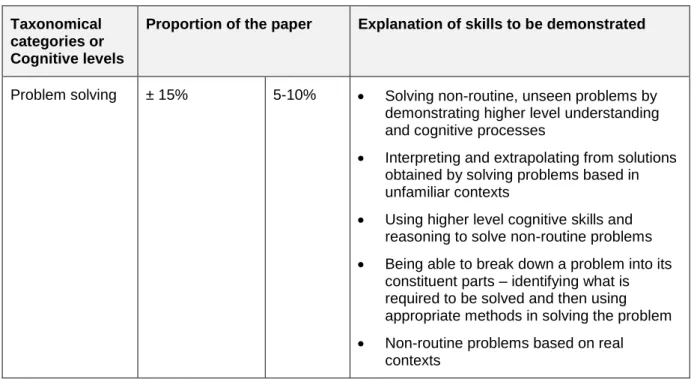
5.2.6 Cognitive demands ... 132
5.2.8 Summary of Section 5.2 ... 141
5.3 SECONDARY RESEARCH QUESTION B ... 142
5.3.1 Descriptive statistics of the two groups in Sample A when entering university ... 143
5.3.2 Descriptive statistics of APM Yes group and APM No group in Sample A during the first year of university ... 152
5.3.3 Inferential statistics of Sample A ... 162
5.3.4 Summary of Section 5.3 ... 167
5.4 SECONDARY RESEARCH QUESTION C ... 167
5.4.1 Profile of students in Sample B ... 168
5.4.2 Perception of the students in Sample B of the transition from school Mathematics to university Mathematics ... 171
5.4.3 Students’ perceptions of the effect of APM course-taking ... 171
5.4.4 Summary of Section 5.4 ... 175
5.5 VOICES OF THE STUDENTS IN THE OPEN-ENDED QUESTION ... 176
5.5.1 Comprehension ... 177 5.5.2 Enjoyment of Mathematics ... 177 5.5.3 Work tempo ... 178 5.5.4 Skills ... 178 5.5.5 Mathematics anxiety ... 179 5.5.6 Confidence ... 179 5.5.7 Summary of Section 5.5 ... 179
xvi
5.6 SUMMARY AND INTEGRATION OF RESEARCH RESULTS ... 180
CHAPTER 6 CONCLUSIONS ... 183
6.1 INTRODUCTION AND SUMMARY ... 183
6.2 FINDINGS AND CONCLUSIONS ... 183
6.3 LIMITATIONS OF THIS STUDY ... 186
6.4 RECOMMENDATIONS ... 187
6.5 A FINAL WORD ... 189
REFERENCES ... 190
APPENDIX A: LETTER OF ETHICAL CLEARANCE ... 232
APPENDIX B: INSTITUTIONAL PERMISSION ... 233
APPENDIX C: PERMISSION FROM IEB ... 234
APPENDIX D: QUESTIONNAIRE ... 235
APPENDIX E: EXAMINATION PAPERS ... 238
ADVANCED PROGRAMME MATHEMATICS (2012) ... 238
xvii
LIST OF FIGURES
Figure 3.1 Conceptual framework... 85
Figure 4.1: The FraIM ... 93
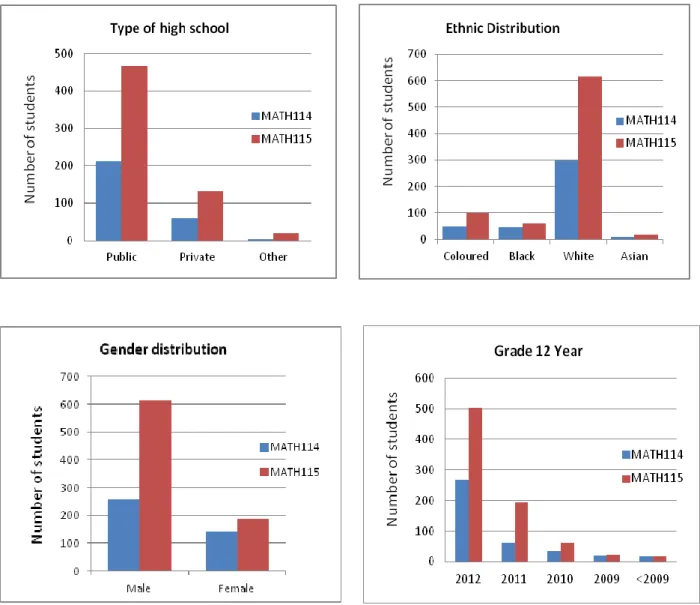
Figure 4.2: Demographic variables of the target population ... 100
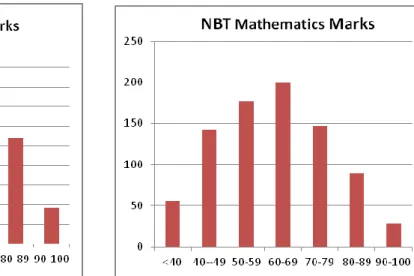
Figure 4.3: Frequency tables of data on cognitive variables of target population . ... 102
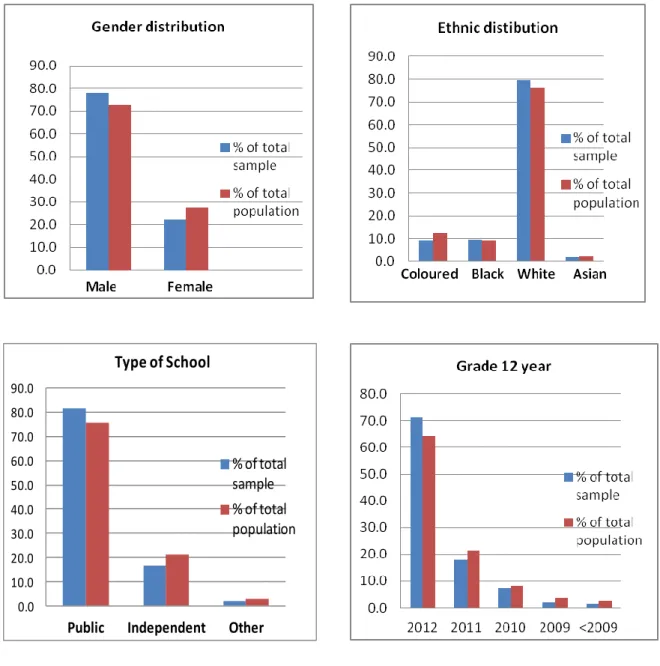
Figure 4.4: Biographical data of sample compared to that of target population .... ... 105
Figure 5.1: Gender distribution between APM Yes and APM No groups ... 145
Figure 5.2: Grade 12 year of APM Yes and APM No groups ... 145
Figure 5.3: Ethnicity of the APM Yes and APM No groups ... 146
Figure 5.4: Type of high school attended ... 147
Figure 5.5: Grade 12 average marks across different performance categories as a percentage of Sample A ... 149
Figure 5.6: NSC Mathematics marks across different performance categories as percentage of Sample A ... 150
Figure 5.7: Mathematics Paper 3 marks across different performance categories as percentage of Sample A ... 151
Figure 5.8: NBT Mathematics marks across the different performance categories as a percentage of Sample A ... 151
Figure 5.9: First-semester Mathematics marks across different performance categories as percentage of Sample A ... 154
Figure 5.10: Second-semester Mathematics marks across different performance categories as percentage of Sample A ... 154
Figure 5.11: Difference between groups in first-semester Mathematics across NSC Mathematics categories ... 156
xviii
Figure 5.12: Difference between groups in second-semester Mathematics
performance across NSC Mathematics categories ... 158 Figure 5.13: Difference between two groups in first-semester Mathematics
performance across NBT Mathematics categories ... 160
Figure 5.14: Difference between two groups in second-semester Mathematics
performance across NBT Mathematics categories ... 161 Figure 5.15: Number of students repeating a Mathematics course ... 168 Figure 5.16: Level of difficulty experienced in the transition from school to
university Mathematics ... 169 Figure 5.17: Distribution of the NSC Mathematics marks for Sample B ... 170 Figure 5.18 Type of school attended ... 170 Figure 5.19: The relationship between confidence and first-semester
Mathematics marks ... 174
Figure 5.20: The relationship between confidence and second-semester
xix
LIST OF TABLES
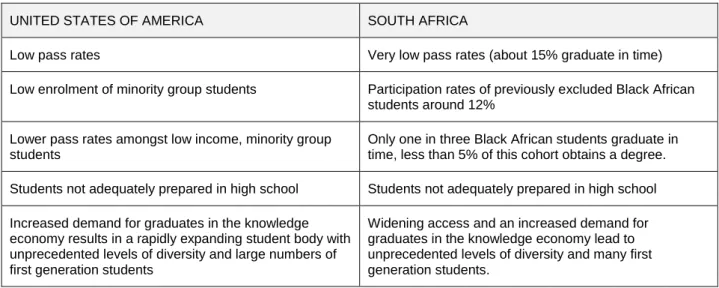
Table 2.1: Comparison of challenges facing higher education in USA and South
Africa ... 34
Table 4.1: Sample size and target population size ... 104
Table 4.2: Results of chi-square test to detemine gender representation ... 106
Table 4.3: Results of chi-square test to determine ethnic representation ... 106
Table 4.4: Results of chi-square test to determine matric year representation .... ... 106
Table 4.5: Results of chi-square test to determine school type representation ... ... 106
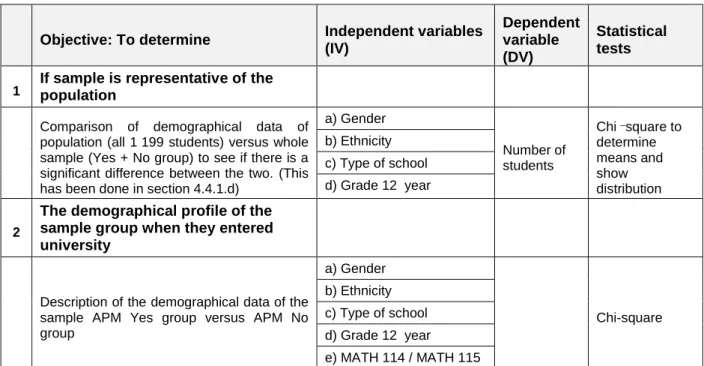
Table 4.6: Summary of the appropriate statistical test for each research objective ... 110
Table 4.7: Constructs in the questionnaire ... 114
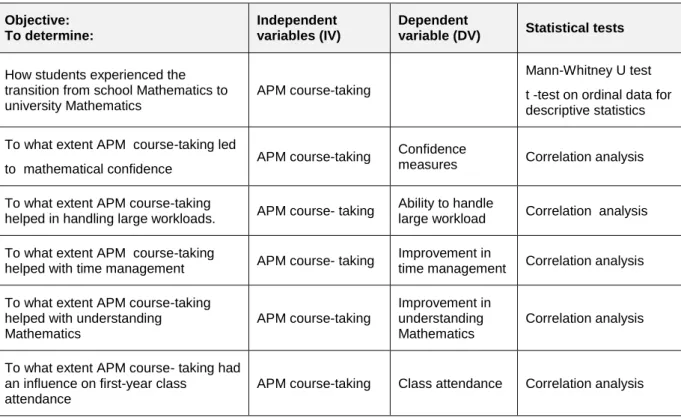
Table 4.8: Methods used to analyse the research objectives underlying the questionnaire. ... 116
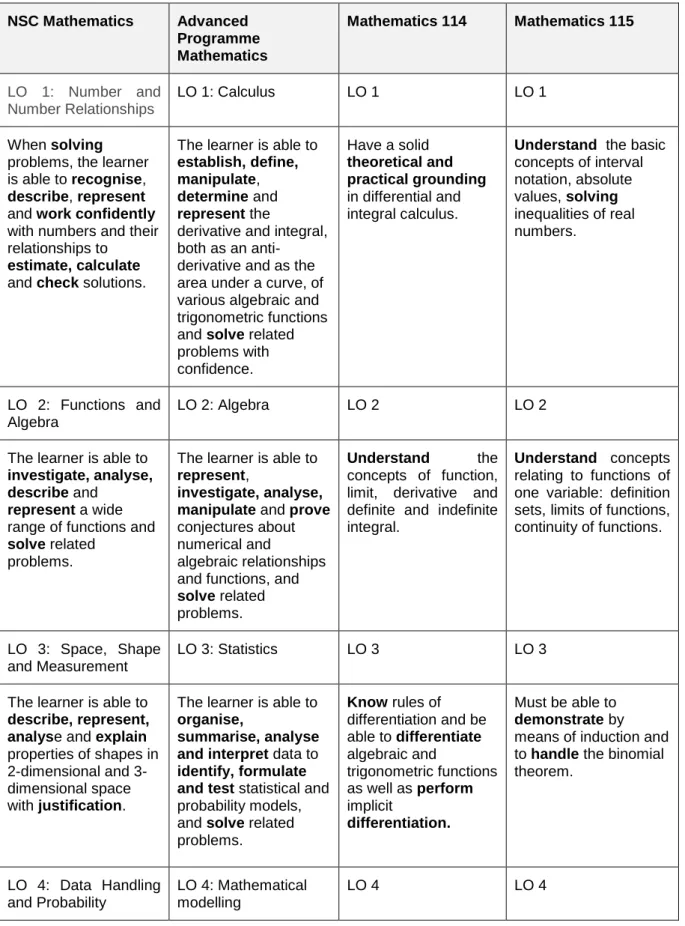
Table 5.1: Comparison of NSC Mathematics and Advanced Programme Mathematics ... 124
Table 5.2: Comparison of the content of NSC Mathematics, APM and first-year university Mathematics ... 125
Table 5.3: Examination mark totals and time allocation ... 131
Table 5.4: Learning outcomes of NSC Mathematics APM, Mathematics 114 and Mathematics 115 curricula ... 133
Table 5.5: Learning outcomes of NSC Mathematics and APM curricula according to the cognitive levels in revised Bloom’s taxonomy. ... 135
xx
Table 5.7: Summary of verbs used to describe skills in different examination
papers ... 139
Table 5.8: Demographic profile of Sample Group A ... 144
Table 5.9: The mean and confidence intervals for the previous learning variables ... 148
Table 5.10: The mean and confidence intervals for first-year Mathematics .... 153
Table 5.11: Anova and Bonferroni tests for difference in first-semester Mathematics performance across NSC Mathematics categories . 155 Table 5.12: Anova and Bonferroni tests for difference in second-semester Mathematics performance across NSC Mathematics categories . 157 Table 5.13: Anova and Bonferroni tests for difference in first-semester Mathematics across NBT Mathematics categories ... 159
Table 5.14: Anova and Bonferroni tests for difference in second-semester Mathematics across NBT Mathematics categories ... 161
Table 5.15: Results of correlation analysis ... 162
Table 5.16: General regression model on first semester performance ... 164
Table 5.17: Test of whole model on first semester performance ... 164
Table 5.18: General regression model on second-semester performance ... 166
Table 5.19: Test of whole model on second-semester performance ... 166
Table 5.20: General regression model on second-semester performance (with first-semester) ... 166
1
CHAPTER 1
INTRODUCTION AND ORIENTATION TO THE STUDY
‘”We are to prepare independent thinkers who will forge new paths with skills they can transfer into contexts we haven’t even imagined yet”
(Croucamp, 2013)
1.1 INTRODUCTION
South Africa has many young people with exceptional talents in Mathematics. These young people hold extraordinary potential for enriching our society by contributing creative products and competing in global economies. In their later life as adults, they will hold important leadership roles and be entrusted with obligations and resources for making critical decisions about individual and organisational well-being. They constitute the far edge of a population whose continued success will be globally acknowledged in the near future (Kell, Lubinski & Benbow, 2013).
In today’s hi-tech global economy, the Science, Technology, Engineering and Mathematics (STEM) industries are becoming increasingly central to economic competitiveness and growth, and will provide many of the future jobs. Knowledge of Mathematics and qualifications in Mathematics are increasingly important gateways to further and higher education (HE).
This study presents an evaluation of a programme in Mathematics, called Advanced Programme Mathematics (APM). It is offered in the final three years of high school as an option for South African mathematically gifted learners with enthusiasm for Mathematics. Advanced Programme Mathematics is aimed at increasing the number of learners who, through competence and desire, enter higher education to pursue careers in the STEM fields (DoE, 2006).
2
This chapter describes the context in which the research question was formulated, provides an overview of the designing, planning and carrying out of the research and finally positions the research questions within the scope of the research.
1.2 CONTEXT IN WHICH THE RESEARCH TOOK PLACE
There are five different contexts contingent to carrying out any research, namely the theoretical, national, policy, organisational and professional ones (Plowright, 2011). The next section will discuss the first four contexts and Chapter 3 will sketch the theoretical context.
1.2.1 National context: Education in South Africa
(a) The current situation
The participants in this study entered university in 2013. In the same year the Centre for Development and Enterprise (CDE) published a report, based on independent research by university-based experts Spaull and Simkins, which painted a dark picture of the quality of education in South Africa. The current system is failing the majority of South African youth. With the exception of a wealthy minority, most South African learners are not where they should be in terms of the curriculum and have not reached the appropriate normal milestones of numeracy and literacy. “The education system is grossly inefficient, severely underperforming and egregiously unfair” (Spaull, 2013, p. 3).
South Africa has a population of roughly 50 million, of which 80% is designated African, 9% coloured, 9% white and 3% South African Indian (Statistics South Africa, 2013). By 2013 race was no longer the only indicator of social privilege. Recently there has been a significant sector of the middle class and very rich, that is African, coloured or Indian. This is reflected in shifts in terms of behaviour and affiliation amongst students in HE, where a tendency to see oneself in terms of social class rather than only in terms of race is increasing (Leibowitz & Bozalek, 2014).
Poverty is still one of the largest socio-economic challenges facing the country (Marais, 2011). The Gini co-efficient for South Africa, measuring the distance between the
3
richest and poorest individuals in a country, is one of the highest in the world (Bhorat, Tseng, Stanwix, 2014). Not only society, but also schools, are very unequal in South Africa, with effectively two types of schools: functional schools (25%) and dysfunctional schools (75%). These schools are still mostly differentiated on the base of race (Van der Berg, 2008), but also differ in terms of accountability, competence of school management, culture of learning, teachers’ knowledge of content, teacher absenteeism, coverage of curriculum and homework, dropout rate and performance on national tests (Spaull, 2013).
From a global perspective of the situation, South Africa’s education is not very inspiring either. For some years already, South Africa has lagged behind in three of the comparative international studies. The three main international tests of educational achievement in which South Africa participates are the Trends in International Mathematics and Science Study (TIMSS), Progress in International Reading and Literacy Studies (PIRLS), and Southern and Eastern African Consortium for Monitoring Educational Quality (SACMEQ). These tests show how the performance of South African learners has changed over time relative to earlier groups of South African learners, and relative to other countries participating in these studies.
In the most recent (2007) SACMEQ (Grade 6 numeracy and literacy) tests, South African learners ranked 8th out of 14 countries on the African continent for Mathematics, and many South African Mathematics teachers had below basic levels of content knowledge (Spaull, 2013). In the 2006 PIRLS, South African learners achieved the lowest score of 45 countries that participated, including other middle-income countries such as Morocco (Spaull, 2013). In terms of the quality of Mathematics and Science
education, the World Economic Forum’s 2013-2014 Report ranks South Africa
second-last out of 144 countries, above only Yemen (Schwab, 2013).
Locally there are three sets of Annual National Assessments (ANA’s) of literacy and numeracy, externally evaluated and nationally standardised, which point to alarmingly low levels of achievement in the fundamental building blocks of learning, despite the Department of Basic Education’s (DBE) pointing to some progress, especially in the lower grades. One of the most recent dramatic results was that only 2.3% of Grade 9
4
learners in 2012 achieved more than 50% in Mathematics, with an average mark of 13% (Yeld, 2012).
Whether the results of the school-leaving (NSC) examination can be seen as an accurate indication of the quality of education in South Africa is a controversial issue. It is widely criticised on aspects such as the pass rate, which does not take into account drop-out before Grade 12, nor the fact that more learners are taking easier subjects such as Mathematical Literacy instead of the more difficult Mathematics (Spaull, 2013). The 2012 NSC results indicate an overall 73.9% pass rate, but only 26.6% of those tested qualified for bachelor degree studies (DBE, 2013). The high levels of inequality between functional and dysfunctional schools are also reflected in these results (Spaull, 2013). Morrow (2009) reflected on the social, economic and cultural influences on schooling in contemporary South Africa, and noted that race, ethnicity, language and class cohere as factors at school level to hinder students from educationally disadvantaged backgrounds from gaining epistemological access once they reach university. The notion ‘epistemological access’ will be discussed in a further section of this study.
It appears that attempts at reform and increased expenditure on schooling do not correlate with equally improved outcomes. The 2012 assessment report of the DBE reports a list of interventions already in place to address the needs of education in South Africa. Various analysts have described the problems and the reasons for them, which are complex, deep and extensive (Bray, Gooskens, Kahn, Moses & Seekings, 2010; Lam, Ardington & Leibbrandt, 2013). Two of the major underlying problems, are the teacher’s lack of knowledge about what they teach and the fact that many learners are learning through the medium of first additional language (Yeld, 2012). “Fixing education is a complex, long and challenging undertaking” (Yeld, 2012, para. 23). Thirty percent of the South Africa population is involved in one of the five major components of the educational system. These areas are early education, basic education, special education, Further Education and Training (FET) colleges and universities (Simkins, 2013). This study will focus on the transition from basic education to HE.
5
(b) Mathematics education in South Africa
It is to be expected that the problematic educational situation in South Africa reflects on the performance of learners in Mathematics. “The teaching of Mathematics in South African schools is among the worst in the world” (Bernstein, 2013, p. 3). The TIMSS (2011) report showed that South African learners have the lowest performance among all 21 middle-income countries that participated and that they perform worse than many low-income African countries. In a recent CDE report, Bernstein (2013, p. 3) summarises the urgency of the situation:
efforts fail to address the wider deficiencies in Mathematics education. Vast improvements in this area of the public schooling system are vital to South Africa’s future socio-economic prospects: for the learners as well as the development of the country as a whole.
Many indicators on school performance and teaching reveal largely unacknowledged poor teaching of Mathematics in the majority of South African schools. South African Mathematics teachers’ competencies compare poorly to those of their counterparts in other Eastern and Southern African countries – they mostly rank at the bottom end of the list. As a result, learner results will not quickly be remedied (Spaull, 2013). The CDE report claims a rapid increase in private extra Mathematics classes, partly in response to the poor teaching in public schools (Bernstein, 2013).
Two other major problems are teacher complacency and a lack of accountability in various areas. Teacher complacency is linked to the way in which many teachers are appointed – often not on merit. There is little accountability to parents in the majority of the school system, little accountability between teachers and the Department of Education, and teacher unions abuse power and act unprofessionally. Furthermore, South Africa’s extremely high unemployment is closely linked to the quality of schooling and numeracy and mathematics competency in particular (Bernstein, 2013).
The CDE warns that improving mathematics teaching and learning in public schools will not happen fast, but must be seen as a matter of urgency. The South African government has begun to accept that there is a crisis requiring immediate intervention,
6
yet its extent and depth is often underestimated in favour of reports of ‘progress’ (Bernstein, 2013).
The poor results in the final school leaving examination in Mathematics, the National Senior Certificate (NSC) Mathematics, affect learners’ ability to obtain the required grades for university admission. The number of Mathematics passes at 40% and above (many of which are inadequate for HE success) remains well below the current intake needs (Fisher & Scott, 2011). Half of the Grade 12 learners in 2012 who wrote Mathematics scored lower than 30%, and one out of three less than 20%. One fifth of students achieved more than 50%, and only 6%, mostly from former white schools, achieved more than 69%, which is the minimum requirement to enrol for any university Mathematics course (DBE, 2013). Not every student needs to obtain a university degree, but the pool of competent candidates that gain access is too small. This situation impedes successful growth in many programmes that are essential for the economic growth of the country.
The correlation between the performance in school-level Mathematics and the outcomes in introductory quantitatively oriented university courses has been widely researched internationally as well as in South Africa (Nel & Kistner, 2009; Rankin, Schöer; Sebastiao & Walbeek, 2012; Smith & Naylor, 2001). Research shows that South African universities are unsure about the usefulness of NSC Mathematics marks as predictors of academic performance at university level (Schöer, Ntuli, Rankin, Sebastiao & Hunt, 2010). Prior to 2008 the Senior Certificate (SC) had a good track record as a relatively robust predictor of ability (Scott, Yeld & Hendry, 2007). With the introduction of the National Senior Certificate (NSC), concerns were raised after the 2008 NSC Mathematics results showed that an increased number of students across the country achieved more than 80% in the final Mathematics examination – a situation repeated in 2009.
Instead of differentiating students according to their abilities, the new NSC Mathematics marks compress students with a wide range of abilities and disabilities into a very narrow range of percentage marks. This could be because there is no longer any
7
differentiation between higher, standard and lower grades in the NSC syllabus, as was the case in the SC syllabus (Schöer et al., 2010).
The 2008 NSC Mathematics results confirmed the notion of grade inflation, especially in the lower performance group (Nel & Kistner, 2009). This means that the NSC marks obtained by students do not match their actual performance. Grade inflation is normally associated with falling standards, but it can also be explained by a number of factors, such as a change in curriculum, improvements in the manner of examining, increased use of continuous assessment or the distribution of sample papers (Govender & Moodley, 2012). The consequence of grade inflation is that it leads to lack of trust in the predicting value of the NSC. Students leave school with the expectation that their school-leaving marks signal their true ability and they gain access to courses in the STEM field, but are in fact underprepared and do not have the ability to be successful in these courses.
Wolmarans, Smit, Collier-Reed and Leuther (2010) argue that the poor performance of first-year students since the introduction of the NSC is not a sudden or dramatic shift, but rather part of a gradual deterioration in the preparedness of these students for the demands of HE study. Nel, Kistner and Van der Merwe (2013), in a preliminary report on the NSC 2014 intake, raise concerns about the weak algebraic competencies of learners, the low literacy levels (learners cannot read the questions), the absence of higher-order problem-solving skills and the learners’ inability to work without a calculator.
The discussion on the NSC Mathematics marks should, however, not distract attention from the main issue of Mathematics teaching and learning at school level and the assumptions made by HE about the mathematical skills of incoming students. The universities should also not merely shift the blame, but take ownership of the issue. In mid-2004, institutional representatives in HE laid the foundation for the National Benchmark Tests Project. This project piloted in February 2009 at selected HE institutions. The National Benchmark Tests (NBT) provides meaningful information about students’ educational needs on their entry to HE. Written before or on entry to an institution, they are used in some way by the majority of South Africa’s universities (Yeld, 2009). These NBT scores can play a dominant role in ensuring that students
8
admitted to first-year programmes have at least a reasonable chance of success when channelled into their appropriate curricular routes (Du Plessis & Gerber, 2012). In October 2012 representatives of each of the country’s 23 public universities determined the new NBT tests that would take effect for the 2014 cohort of first-year students.
The NBT Mathematics test is explicitly designed to provide a snapshot of the mathematical competencies of test writers at some point in time. The knowledge and skills assessed relate to school mathematical content that is relevant to HE, and the tests attempt to determine how well relevant mathematical concepts have been understood and can be applied (Griesel, 2006).
On the one side of this gap between school and university Mathematics, the HE institutions might raise their entrance requirements dramatically and on the other side, educational authorities might set much more difficult examination papers. In the process, the school-learner is the party who is affected negatively. It is into this gap that APM fits as a better alternative to these two options, with the focus on the learner and his transition between school and HE. (In this study references to one gender are inclusive of the other gender.)
(c) Transition from basic education to higher education
Although there is a strong thrust to provide access to HE to students who were previously excluded because of apartheid, the pool of students able to gain access is still exceedingly small. Current statistics have it that out of every 100 learners who start school in grade one, only 50 will make it to grade 12, 40 will pass and only 12 will qualify for university (Spaull, 2013). Prior education is a key factor influencing how students learn and continue to learn.
Enrolments at universities are growing fast and the consequent challenges, such as student retention and maintaining high standards, are increasing. There has been a degree of movement towards transformation in terms of access to HE, but less in terms of success (Crouch & Vinjevold, 2006; Leibowitz & Bozalek, 2014; Simkins, 2013). The current state of access, success and throughput in HE is revealed in a recent report of the Council on Higher Education (CHE) on curriculum reform in South Africa. This
9
report (Scott, Ndebele, Badsha, Figaji, Gevers & Pityana, 2013) argues the need for radical changes to the undergraduate curriculum. The following observations in the report are of interest for this study:
The HE participation rate as a percentage of the group from 20–24 years old has increased from 15% to 18% in 2010 and there has been significant progress in improving African and coloured participation in HE, although it is still low. The intake of African and coloured students represents the top 10% of the African and coloured youth, which means they must have high potential to succeed. First-year attrition is very high. In 2006 nearly 42 000 students of the first-time entering total of 127 000 dropped out, which is one out of every three.
In the best performing cohort to date, the 2006 cohort, only 35% of the intake graduated in five years, and it is estimated that 55% will never graduate. Graduation rates for the qualifications BEng and BSc were both 23%, and the white graduation rate in engineering in the 5- year course was 2.4 times (139%) higher that the African one. The overall effect of the performance patterns is that only 5% of African and coloured youth are succeeding in HE. This represents an “unacceptable failure to develop talent in groups where realisation of potential is most important” (Scott et al., 2013, p. 51). South Africa is not producing sufficient graduates to meet national needs in terms of economic and social development and that the country’s intellectual talent is not being developed sufficiently (Scott et al., 2013).
The CHE report concludes that poor academic preparation at school is the main reason for poor university performance and it expresses doubt about whether the dysfunctional school system will be able to produce the numbers of adequately prepared school-leavers that HE requires in the near future. In the light of these circumstances, the report introduces a new curriculum structure. The authors propose that all current three-year degrees and diplomas, as well as current four-year professional bachelor's degrees, should be increased by one year, while allowing students who can complete a programme in less than the formal time to do so (Scott et al., 2013). Critics claim that this report’s analysis is unsound and narrow and that HE must take part of the blame for the under-preparedness of students entering universities. They name lack of adequate
10
student services, unqualified academic staff and proper academic support and mentoring as factors contributing to the high failure rates (Selamolela & Masondo, 2013).
Many South African universities have developed access programmes as alternative routes to university admission. Calls for foundation courses to bridge knowledge gaps, curriculum extension to allow some students more time to complete their studies and co-curricular and academic literacy programmes to develop competencies and skills continue to be made (Hlalele, 2010). Despite all these efforts, participation to ensure access is still inadequate (Leibowitz & Bozalek, 2014).
Yeld (2010) suggests that South Africa has to continue emphasising access as a national goal and needs to intensify its efforts in this regard. This must however always be access for success rather than access for participation.
(d) Education for the gifted in South Africa
“Educational provision for gifted learners should reflect our understanding of what it means to be gifted” (Eyre & Lowe, 2012, p. 1). ‘Giftedness’ is a questionable construct that has posed a challenge to many scholars over the years. Definitions of ‘giftedness’ are linked with synonyms such as ‘high ability’, ‘aptitude’ or ‘talent’, and they often carry a long history of cultural use, are tainted with emotionalism and even associated with elitism (Monks & Katzko, 2005).
For the sake of this study, gifted learners will be described as those learners, who in general, learn quickly, exhibit great efficiency in problem-solving, understand advanced and complex concepts in a variety of reasoning domains and are proficient and creative producers of thoughts (Renzulli, 1983). These learners need access to broad, balanced and challenging curriculum opportunities that make provision for critical thinking, creative thinking, increased independence, problem solving, ability reflection and self-knowledge (Eyre & Lowe, 2012). Therefore, the interaction between gifted students and their environment produces situations in the classroom requiring curricular and
11
instructional differentiation to enable them to fulfil their potential (Foust, Hertberg- Davis & Callahan 2009).
Gifted education has often been criticised for violating the principles of equity (Monks & Katzko, 2005). Persson (2014) asks the very relevant question, given the South African history: “Does gifted education affect societal inequality, and does societal inequality suppress and/or distort the development of high ability?”(p. 1). In the democratic South Africa it has never been an option to single out a group of learners with advanced abilities. This would just create another minority group, already privileged because of their special gifts (Taylor, Kokot & Heller, 2000). Moreover, this group of learners is often stereotyped as an elite group because of special education provision during the apartheid dispensation (Kokot, 1999).
South Africa has many mathematically gifted and talented learners – people who have
an enhanced capacity to do Mathematics. They need to be better equipped for the challenges of a post-modern society and tertiary study, since far too many of the gifted currently do not stand even the remotest chance of achieving anything near their potential (Van der Westhuizen & Maree, 2006).
1.2.2 Policy context
The Constitution of South Africa, incorporating the Bill of Rights, informed the transformation in education. It stipulates that all individuals have the right to be respected and treated with equality and that every individual has the right to both basic and further education (RSA, 1996). Two other policies guiding education in South Africa are the White Paper on Education and Training of 1995 that outlined the principles of the new curriculum and the South African Schools Act No 84 of 1996 stipulating that high-quality education should be provided to all learners (DoE, 2001). The Education White Paper 6 answers the global call for inclusive education (DoE, 2001). Inclusive education in South Africa is in line with the Salamanca statement, signed in 1994, which shifted the focus for inclusion to the mainstream school and classroom (UNESCO, 1994).
12
Although education for the gifted has not specifically been mentioned in the White Paper, it nevertheless upholds the wider interpretation of inclusive education, namely the inclusion and support of all learners, and calls for respecting differences in learners and for enabling educational structures, systems and learning methodologies to meet the needs of all learners (Oswald & De Villiers, 2013). In a more recent document, Guidelines for Inclusive Teaching and Learning (DBE, 2010), the gifted learner is mentioned as one category of exceptionality when curriculum differentiation is discussed. The new curriculum initiative, the Curriculum and Assessment Policy Statement (CAPS) (DBE, 2011), identifies inclusivity as one of the general aims of the South African curriculum.
South African Grade 12 learners wrote their NSC examination based on the outcomes-based education (OBE) system for the first time in November 2008 and for the last time in 2013. The NSC curriculum was designed to embody the values, knowledge and skills envisaged in the constitution of the new democratic South Africa. It provided learners with the opportunity to perform at the maximum level of their potential and focused on high levels of knowledge and skills, while promoting positive values and attitudes (DoE, 2003). The NSC examined the extent to which a Grade 12 student had met the National Curriculum Statements (NCS) expectations as expressed in the Subject Assessment guidelines.
A learning outcome is a statement of an intended result of learning and teaching. It describes knowledge, skills and values that learners should acquire by the end of the FET band (Grades 10 to 12). Assessment standards are criteria that collectively describe what a learner should know and be able to demonstrate at the end of a specific grade. Such standards embody the knowledge, skills and values required to achieve the learning outcomes. Assessment standards within each learning outcome collectively show how conceptual progression occurs from grade to grade (DoE, 2003).
1.2.3 Organisational context: Stellenbosch University
The majority of the undergraduate students at SU are described as white and Afrikaans-speaking, with reasonably good schooling and from middle- to upper- class families, unlike most of their black counterparts. This is in a sense an “extreme case” in the
post-13
1994 era in the South African HE landscape, “a last bastion of white dominance” (Gibbon, 2010, p. 1). SU has a high level of success in terms of retention, throughput and graduation compared to most other African universities. This could be because most students enter the university with good secondary schooling, high family levels of education and good parental incomes. These are all factors that establish a good platform, from which students can benefit from the high-quality teaching and learning offered at the SU, and all the other systems and strategies in place to support them through their studies (Gibbon, 2010).
Notwithstanding all of this, the transition from school to university is still a period of new challenges and anxieties for many year students. Nel (2007) did a study on first-year students at SU and found that these challenges and anxieties occur not only on academic level, but also on personal and social levels. Students feel deprived of personal attention and they experience that nothing is compulsory any more, class sizes are very large and the workload higher and they must study for much longer hours. This is overwhelming for many students (Frick, 2008).
Factors contributing to students leaving SU without completing their studies were mostly academic failure (52%), financial grounds (17%) and combinations of the two (31%). Coloured students ranked financial difficulties highest, while language was a significant problem for African students. White students identified an active social life as the reason for failure. Most students (44%) who left SU did so after their first year of study. Staff and language diversity were also two factors seen as important for the improvement of retention (Nel, Kistner & Van der Merwe, 2013).
1.2.4 Professional context: The researcher’s experience
The researcher has been teaching Mathematics for more than 20 years and started teaching the subject APM six years ago. She is currently teaching at a public school for boys. This school is privileged in terms of parental support, financial means and school resources. Mathematics is a popular subject and more than 92% of the boys take the subject. Many of these boys enrol at university after school.
14
University lecturers have taught the subject Additional Mathematics at this school since 2005 as an extramural activity. Since 2009 it has been the researcher’s privilege to teach both Mathematics and Advanced Programme Mathematics. APM started with a small group of eight students, but it has become very popular, with a class of 32 in 2013. Many of these students give positive feedback about APM once at university, and claim that having taken APM made first-year Mathematics ‘easy’.
As more and more learners are enrolling for APM, many parents, teachers and principals are enquiring about the merits of this subject. Parents, even if they cannot afford it, are prepared to go to any length to provide extra opportunities to prepare their children for success in their first year at university. As a Mathematics teacher, the researcher has often been involved in debates about university access tests and Mathematics marks as predictors of success in HE, but she noted that after the latest curriculum changes, parents and co-educators have become much more anxious about their children’s transition from school to university. They want to know if their children should enrol in APM. This research wants to answer some of these questions.
1.3 PROBLEM STATEMENT
It has been observed that many intellectually talented learners following the NSC curriculum in South Africa are underprepared for university studies in Mathematics. Although these learners do obtain the required marks needed to gain access to university, they often lack the problem-solving, logical thinking, analysing and critical thinking skills necessary for the rigour of first-year Mathematics.
Many of these students never really studied much for Mathematics at school level and were used to obtaining high marks. They never really acquired the skills to work hard constantly and be disciplined in their studies, and few of them were ever challenged in any school Mathematics class. They enter the university with a perception that it is not necessary to work in Mathematics and that their marks should resemble their school Mathematics marks. Many of them are then disillusioned when they are not successful in Mathematics and are sometimes even at risk of failure. They experience their transition from school Mathematics to university Mathematics as traumatic, and some drop out in their first year.
15
There is a tendency in well-functioning schools to manage the learning programme tightly and to control learning. Teachers are reluctant to let learners ‘fall behind’ and go to great lengths, such as providing extra classes, to ensure that learners understand and master the curriculum, and are well prepared to do their best in the final NSC examination. Many of these students then never take responsibility for their own learning (IEB, n.d.).
Mathematically gifted students have unique learning characteristics and their abilities and motivation for academic achievement are well above the norm. Their specific intellectual needs are not always met in the current school system with the “one-size-fits-all” Mathematics approach offered in the current curriculum.
If students are unprepared in Mathematics when they enter university, it affects the quality of students graduating in the STEM fields. South African universities need to produce well-prepared STEM graduates with advanced knowledge and competencies for the challenging and changing demands of society and the economy. This is essential if South Africa wants to be a role player in the global economy.
This discontinuity between school and university or “gap” has a role player at each end of the gap, the university on the one side and the school system on the other. Universities cannot accept students for courses if they know in advance that they are underprepared and will most likely experience difficulties. What they can do, for example, is to raise their admission requirements, enrol more students in an extended programme, introduce more bridging programmes, change their curriculum or teaching strategies, extend their support programmes or do more research on the topic.
If higher education institutions are to remain relevant, that is, if we are serious about increasing access to higher education in an attempt to alleviate the critical shortage of science and engineering graduates in South Africa, we have to find ways to respond adequately to the problem of assisting under-prepared first-year students to succeed (Wolmarans, Smit, Collier-Reed & Leather, 2010, p. 10).
The school system, on the other hand, also has a crucial responsibility to help narrow the gap between school and university Mathematics. Possible options (among many) would
16
be to add an additional mathematics subject as another of the seven school subjects (Engelbrecht, Harding & Phiri, 2010) or to follow the global example of introducing Advanced Placement programmes.
Countries such as the USA, Canada and Australia have followed this route to strengthen students’ tertiary readiness and numerous studies have been conducted that prove that there is a strong relationship between Advanced Placement (AP) courses and tertiary readiness and success measures (Casement, 2003; Dougherty et al., 2005; Geiser & Santelices, 2004).
The concept of an advanced course in Mathematics at school level is not completely new in South Africa. In the SC curriculum there was a subject, Additional Mathematics, which was removed with the implementation of the NSC Curriculum. Currently there is an APM course available as part of the curriculum of the Independent Examination Board (IEB).
APM is a subject defined by the curriculum document of the IEB as an extension of Mathematics and based on the same type of discipline. It aims to broaden learners’ mathematical knowledge, deepen their mathematical thinking skills, and develop a passion for Mathematics and commitment to continued learning of Mathematics. It aims to enhance mathematical creativity and rigorous logical reasoning (IEB, 2006).
1.4 PURPOSE AND SIGNIFICANCE OF THE STUDY
The motivation of the IEB for the introduction of the APM to learners in any South African school, state or independent, reads as follows:
to provide interested and talented learners with the opportunity to study specific subject areas in greater depth, to provide schools with the opportunity to develop self-study skill in learners and ultimately to prepare good students for tertiary study (IEB, 2006, p. 3).
This study will aim to investigate the validity of these claims by evaluating the effectiveness of this APM programme in easing the transition from school to university Mathematics. To the author’s knowledge very little has been published in South Africa
17
on this subject, and she hopes that this research will contribute to more knowledge production in the area of Mathematics and the transition between school and university.
1.5 RESEARCH QUESTION
To address the problems stated above, the following central research question guides and directs the study:
To what extent does the course, Advanced Programme Mathematics, prepare students for the rigour of first-year Mathematics in the STEM university programmes?
In order to answer this question, three secondary research questions are asked:
How are the APM and NSC Mathematics (Papers 1, 2 & 3) curricula related to the first-year Mathematics curricula (at Stellenbosch University)?
To what extent, if any, do the learners who take the APM course and examinations prior to admission to the first year perform better in their first-year university examinations in Mathematics?
What are the students’ opinions on their experience of the effectiveness of APM in easing the transition between school and university Mathematics?
1.6 OBJECTIVES
In order to undertake this study, the following objectives are pursued: To do a document analysis of curricula of the following courses:
National Senior Certificate Mathematics papers 1, 2 and 3
Advanced Programme Mathematics
First and second semester first-year Mathematics (at SU)
To do an empirical investigation to determine the difference between the students who took APM and those who did not, when the following factors are compared:
Performance in the NSC examinations and performance in first semester examinations of first-year Mathematics
Performance in the NSC examinations and performance in second-semester
18
Performance in the NBT and performance in the first- and second-semester
examinations of first-year Mathematics.
To determine the relationship between APM marks, NBT marks and the first- and second-semester Mathematics marks.
To determine, by means of a questionnaire, how the students experienced the effectiveness of APM in easing the transition between school and university Mathematics.
1.7 THE RESEARCH PROCESS
1.7.1 Research design and methodology
This research was designed according to a new framework introduced by Plowright (2011), referred to as the Framework for an Integrated Methodology (FraIM). This framework proposes a fundamentally different way of thinking about, and doing educational research. It is a model that describes the process of designing, planning and carrying out research and aims at “supporting the integration of different elements of the research in the process of studying a topic, without favouring a certain element over any other” (Plowright, 2011, p. 4). The FraIM is a combination of a “pragmatic integrated methodology, a relativist social epistemology, a realist social ontology and a realist object ontology” (Plowright, 2011, p. 186).
This means that this research will focus on the purpose, which is to determine the usefulness of the subject APM, and it will be driven by the research question and not the researcher’s own philosophical position prior to the beginning of the research.
Plowright refers to the philosophical perspective of this approach as “holistic integrationism” (Plowright, 2011, p. 186). It relies heavily on the paradigm of pragmatism, which argues that the truth is ‘what works’. This study therefore aims to provide “a well referenced, coherent and organised account, that draws on rigorous empirical research that enables the researcher to provide evidence to support any claims she has made, in order to answer the research question” (Plowright, personal communication, 22 October 2014).
19 1.7.2 The participants and research data
After taking into account the different contexts in which the research is planned and undertaken and formulating the research question, the task of data source management starts and the sampling decisions underlying the case selection are made. Then the methods of data collection to be used, the types of data to be collected and the analyses of those data are chosen (Plowright, 2011). According to the FraIM there are three methods of data generation and collection i.e. observation, asking questions and artefact analysis.
For the first part of this study, the artefacts analysed are the curricula of the NSC Mathematics Papers 1 and 2, the APM paper and the first and second semester papers of first-year Mathematics. In the second part of this study the participants or case studies were purposely selected from the 2013 cohort of first-year students at the US who enrolled for either Mathematics 114 and 144 or Mathematics 115 and Mathematics 145. They were divided into two groups: those who had taken APM in high school and those who had not. Apart from the demographical data of these students, other sets of data of students used this stage of this study are their marks in the NSC Grade 12 Mathematics Papers 1, 2 and 3 examinations, the NBT Mathematics examination, the APM examination, their Grade 12 average and their Mathematics 114 and 115 examinations or Mathematics 115 and 145 examinations marks. The third part of the study uses data obtained by means of a questionnaire sent to the target group,
1.7.3 Analysis of the data
The analysis of the data entails three parts. First, a document analysis is done to compare the different curricula in terms of content and cognitive levels and to provide the context for the empirical analysis that follows. Then analyses and interpretations of raw statistical data of the findings on the academic scores of two groups of students, those that took APM and those that did not, are done. In the third part, the perceptions of the students as stated in the open question of the questionnaire are analysed and discussed. The aim is to integrate the different parts of the analyses to present an integrated picture of the effectiveness of APM.
20
1.8 BRIEF CHAPTER OVERVIEW
Chapter Two presents the story of APM, as found in the literature. It defines the concept of an Advanced Placement Course and describes the development thereof over the last 50 years in countries all over the world. It aims to provide a critical discussion on the benefits of Advanced Placement.
Chapter Three discusses the researcher’s journey in search of a theoretical framework for this study. It starts by giving background information on different types of theoretical frameworks and theories on Mathematical learning, and then gives some perspectives on curricula and thinking skills, after which it elaborates on the notion of student success and more specifically cognitive and non-cognitive predictors of success in Mathematics. Then the self-efficacy theory of Bandura, the self–confidence theory of
Stankov and Ackerman, Kanfer and Beier’s theory on AP are discussed as theoretical
basis for this study, providing a conceptual framework to link the different theories. Chapter Four starts by discussing the traditional concepts of ‘paradigms‘ and ‘designs’ and then positions this study within the FraIM model of Plowright, which explains how this research will be conducted. The sampling method, the data- collection procedures, the instruments used, the data presentation and the analysis procedures used are discussed for each of the three methods used in the study.
Chapter Five uses document analysis, an empirical analysis and a narrative analysis to analyse the data and then integrates the analyses of the different methods to answer the research question.
Chapter Six presents the final discussions and findings of this study, as well as recommendations for students, schools, teachers and curriculum planners. The limitations of this study and recommendations for future research are presented and conclude this investigation. References will follow.
This study should be seen as only a first attempt to do justice to the subject APM as possible instrument in easing the transition from school to university Mathematics.