Adv. Geosci., 17, 23–29, 2008 www.adv-geosci.net/17/23/2008/
© Author(s) 2008. This work is distributed under the Creative Commons Attribution 3.0 License.
Advances in
Geosciences
Climate change effects on drought severity
A. Loukas, L. Vasiliades, and J. Tzabiras
Department of Civil engineering, University of Thessaly, 38334 Volos, Greece
Received: 15 January 2008 – Revised: 6 March 2008 – Accepted: 15 May 2008 – Published: 20 June 2008
Abstract. This paper evaluates climate change effects on drought severity in the region of Thessaly, Greece. The Stan-dardized Precipitation Index (SPI) has been used for estima-tion of drought severity. A geographical informaestima-tion system is applied for the division of Thessaly region to twelve hy-drological homogeneous areas based on their geomorphol-ogy. Mean monthly precipitation values from 50 precipita-tion staprecipita-tions of Thessaly for the hydrological period Octo-ber 1960–SeptemOcto-ber 1990 were used for the estimation of mean areal precipitation. These precipitation timeseries have been used for the estimation of Standardized Precipitation Index (SPI) for multiple time scales (1-, 3-, 6-, 9-, and 12-months) for each sub-basin or area. The outputs of Global Circulation Model CGCM2 were applied for two socioeco-nomic scenarios, namely, SRES A2 and SRES B2 for the as-sessment of climate change impact on droughts. The GCM outputs were downscaled to the region of Thessaly using a statistical methodology to estimate precipitation time series for two future periods 2020–2050 and 2070–2100. A method has been proposed for the estimation of annual cumulative drought severity-time scale-frequency curves. These curves integrate the drought severity and frequency for various types of drought. The SPI timeseries and annual weighted cumu-lative drought severity were estimated and compared with the respective timeseries and values of the historical period 1960–1990. The results showed that the annual drought severity is increased for all hydrological areas and SPI time scales, with the socioeconomic scenario SRES A2 being the most extreme.
1 Introduction
Nowadays anthropogenic climate change and its socioeco-nomic impacts are major concerns of mankind. Global sur-face temperature has been increased significantly during the last century and will continue to rise unless greenhouse gas emissions are drastically reduced (IPCC, 2001, 2007).
Cli-Correspondence to: A. Loukas ([email protected])
mate change effects are manifold and vary regionally, even locally, in their intensity, duration and areal extent. How-ever, immediate damages to humans and their properties are not obviously caused by gradual changes in temperature or precipitation but mainly by so-called extreme events such as floods and droughts. The frequency and intensity of ex-treme events can be analysed with the use of long historical data series which are unavailable in many parts of the world. Hence, coupled atmosphere-ocean general circulation mod-els are suitable tools to simulate extreme events since they are able to generate long time series that can be used for model evaluation and also for analyses of possible future changes in extreme events.
There have been suggestions recently that changes in the frequency of extreme events may accompany climate change. Most general circulation models predict a prominent change in precipitation (IPCC, 2001, 2007), supported by ob-servations of precipitation trends (National Observatory of Athens, 2001) showing decreased winter precipitation and enhanced variability (IPCC, 2001). There is evidence that such changes are now reflected in low flows and hydrologic droughts (Hisdal et al., 2001). The frequency and severity of low flows has been extensively studied (Smakhtin, 2001). In contrast to various drought studies of river discharge, limited studies of drought based on meteorological drought indices, which require considerably less input data when compared to weather, soil and land use information needed by meteoro-logical, hydrologic, agrohydrologic and water management models, have been performed (i.e. Kothavala, 1999; Blenk-insop and Fowler, 2007; Mavromatis, 2007; Loukas et al., 2007). This study will, explicitly for the Thessaly Region in Greece, examine whether the upward trend of droughts (IPCC, 2001; Weiss et al., 2007), as described above, is likely to continue in the future, examining drought ity as the main indicator. It tries to understand the sever-ity and frequency of the present drought conditions; and, by reconstructing climatic records including climate and socio-economic changes on future drought severities using two of the IPCC global emission scenarios, A2 and B2, to under-stand whether such droughts are increasing in severity and frequency.
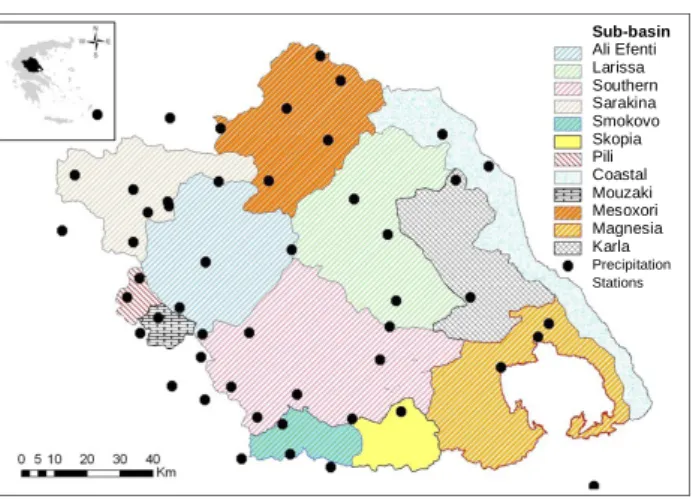
Sub-basin Ali Efenti Larissa Southern Sarakina Smokovo Skopia Pili Coastal Mouzaki Mesoxori Magnesia Karla Precipitation Stations
Figure 1. Sub-basins of Thessaly and location of precipitation stations.
Fig. 1. Sub-basins of Thessaly and location of precipitation stations.
2 Study area and data base
Thessaly is located in central Greece and is a plain region surrounded by high mountains. Thessaly’s total area is about 13 700 km2. Elevation ranges from sea level to more than 2800 m, and the mean elevation of the region is about 500 m. The Thessaly plain with an area of about 4000 km2is one of the most productive agricultural regions of Greece. The main crops cultivated in the plain area are cotton, wheat and maize whereas apple, apricot, cherry, olive trees and grapes are cul-tivated at the foothills of the eastern mountains. The climate is continental at the western and central side of Thessaly and Mediterranean at the eastern side. Winters are cold and wet and summers are hot and dry with large temperature differ-ence between the two seasons. Mean annual precipitation over Thessaly region is about 700 mm and it is distributed unevenly in space and time. The mean annual precipitation varies from about 400 mm at the central plain area to more than 1850 mm at the western mountain peaks. Generally, rainfall is rare from June to August. The mountain areas re-ceive significant amounts of snow during the winter months and transient snowpacks develop.
Greece, and especially Thessaly, experienced severe, ex-treme and persistent droughts during the periods from mid to late 1970s, from late 1980s to early 1990s and the first years of 2000s. These three drought periods were quite remarkable and affected large areas. The first drought episode (1976– 1977) affected southern and western Europe, the second drought episode (1988-1991) affected the whole Mediter-ranean Region with an estimated economic cost larger than 2.1 billion Euros, whereas the third drought episode (2000– 2001) affected Central Europe and the Balkans with total damage of 0.5 billion Euros (EEA, 2004). During these three periods the monthly and annual precipitation was signifi-cantly bellow normal in Thessaly. The prolonged and sig-nificant decrease of monthly and annual precipitation has a dramatic impact on natural vegetation, agricultural produc-tion and the water resources of the region.
Large scale atmospheric circulation patterns affect the droughts over Greece and the Mediterranean basin, in gen-eral. In a recent study (Bordi et al., 2007) analysis of geopo-tential height anomaly of 500 mb indicated that a high pos-itive anomaly over North-Eastern Europe is responsible for extended and severe droughts in Italy and Greece. These circulation patterns characterise mid- to high-latitude flow anomalies. These dipole-like geopotential anomalies char-acterize the large-scale circulation and produce long persis-tent droughts. Especially, the 1988–1991 drought episode has been observed during a high positive North Atlantic Os-cillation (NAO) index (Xoplaki et al., 2000; Houssos and Bartzokas, 2006). During this period, the extension of the subtropical anticyclone of the Atlantic (Azores) up to central Mediterranean modified the tracks of the traveling depres-sions affecting precipitation in NW Greece. Furthermore, during this period, low pressure systems approached Greece mainly from the North, causing dry katabatic winds in NW Greece due to the NW-SE orientation of the Pindus mountain range, west of Thessaly. These atmospheric circulation pat-terns are considered typical for extreme dry periods and have been identified by many researchers (Metaxas et al., 1993; Xoplaki et al., 2000; Bartzokas et al., 2003).
Thessaly was divided into twelve basins or areas using a digital elevation model (Fig. 1). The digital elevation model was developed within a G.I.S. from digitized elevation con-tours with a contour interval of 100 m from topographical maps. The sub-basins were also delineated using the posi-tions of hydrometric staposi-tions, where discharge is measured. Processed monthly precipitation data from 50 stations for the period October 1960 to September 1993 were available (Fig. 1). The mean areal precipitation of the sub-basins was estimated by the Thiessen polygon method modified by the precipitation gradient using the stations, which are within or in the vicinity of each sub-basin.
3 Methodology
The aim of this study is to evaluate the impact of climate change on droughts. The droughts have been assessed us-ing the most commonly used drought index, the Standard-ized Precipitation Index (SPI). The SPI timeseries have been estimated for the historical base period 1960–1990 and for two future periods, namely, 2020–2050 and 2070–2100 us-ing the precipitation timeseries. The future climate precip-itation timeseries were estimated using the outputs of the Global Circulation Model CGCM2 downscaled with a sta-tistical methodology. The methodologies used in this study are presented in the next paragraphs.
3.1 Standardized precipitation index
The SPI has been developed by McKee and his asso-ciates (1993) for defining and monitoring droughts. It is
A. Loukas et al.: Climate change effects on drought severity 25 used, among others, by the U.S. Colorado Climate Center,
the U.S. Western Regional Climate Center, and the U.S. Na-tional Drought Mitigation Center to monitor drought in the United States. The main advantage of the SPI is that can be calculated for multiple time-scales. This is very important because the time scale over which precipitation deficits accu-mulate functionally separates different types of drought (Mc-Kee et al., 1995) and, therefore, allows to quantify the natu-ral lags between precipitation and other water usable sources such as river discharge, soil moisture and reservoir storage. The U.S. National Drought Mitigation Center computes the SPI with five running time intervals, i.e. 1-, 3-, 6-, 9-, and 12-months, but the index is flexible with respect to the pe-riod chosen.
The SPI is computed by fitting a Gamma probability den-sity function to a given frequency distribution of areal pre-cipitation totals for time scales from 1 to 12 months. The parameters of the distribution have been estimated for each sub-basin or area, for each time scale of interest using the method of maximum likelihood. The Gamma distribution is not defined for P=0 and a precipitation distribution may con-tain zeros. In this study a “na¨ıve” method has been applied. According to this method the null precipitation is substituted with a small amount of precipitation, for example 0.1 mm. This substitution does not affect the distribution of precipi-tation and circumvent the problem. The error introduced by this method depend on the number of months with null cipitation (P=0) and it is usually evident for the 1-month pre-cipitation. The complete formulation of the SPI calculation can be found in the paper of Loukas and Vasiliades (2004). 3.2 Precipitation downscaling
Global Circulation Models (GCMs) have been used to study the effects of the increasing concentration of carbon dioxide and the other greenhouse gases on the Earth’s climate. In this study the outputs from the second-generation Canadian Centre for Climate Modeling and Analysis GCM (CGCMa2) (Boer et al., 2000; Flato and Boer, 2001) and for two socio-economic development scenarios were used for the assess-ment of climate change impacts on monthly precipitation. The two scenarios used are the SRES (Special Report on Emissions Scenarios) A2 and B2. The SRES A2 repre-sents an intermediate emissions scenario, whereas the SRES B2 represents a low emissions scenario. The two socio-economic scenarios used have been widely adopted as stan-dard scenarios for use in climate change impact studies (IPCC, 2001). Scenario runs were taken over two time pe-riods: a) 2020–2050 and b) 2070–2100.
In this study, the GCM outputs were downscaled using re-gression equations between GCM predictor output variables and areal monthly precipitation. These relationships were developed for each sub-basin or area. The predictors used in such analysis should be: a) well simulated by the GCM, b) strongly correlated with the predictand variable
(precipi-Table 1. Correlation coefficients of statistical downscaling method for development and validation periods.
Sub-basin Development Period Validation Period
Oct 1960 – Sep 1990 Oct 1990 – Sep 1993
Ali Efenti 0.69 0.75 Coastal 0.60 0.61 Karla 0.55 0.57 Larissa 0.55 0.58 Magnesia 0.58 0.61 Mesoxori 0.49 0.52 Mouzaki 0.77 0.84 Pili 0.80 0.77 Sarakina 0.72 0.76 Skopia 0.55 0.46 Smokovo 0.72 0.74 Southern 0.65 0.73
tation), and c) available. Using these criteria, six predictor grid variables were used, namely the mean sea level pres-sure (mslp), the mean 2 m wind speed (swa), the precipi-tation (pcp), the mean surface temperature (st), the 500 hPa geopotential height (gz500), and the geopotential thickness between 500 and 1000 hPa (gz500–1000). These are the most commonly used predictors in statistical downscaling of pre-cipitation (IPCC, 2001).
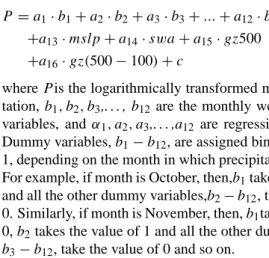
A procedure based on forward selection stepwise regres-sion technique and included testing with various linear and non-linear regression models was employed. In this study, the dummy variables are a set of twelve categorical vari-ables assigned to the 12 months of the year and used to ac-count for the effect of the “month” on precipitation. The best regression downscaling model containing monthly dummy variables is expressed as:
P =a1·b1+a2·b2+a3·b3+...+a12·b12
+a13·mslp+a14·swa+a15·gz500
+a16·gz(500−100)+c (1)
wherePis the logarithmically transformed monthly precipi-tation,b1, b2, b3,. . . , b12 are the monthly weighing dummy
variables, andα1, a2, a3,. . . ,a12 are regression coefficients.
Dummy variables,b1−b12, are assigned binary values, 0 or
1, depending on the month in which precipitation is referred. For example, if month is October, then,b1takes the value of 1
and all the other dummy variables,b2−b12, take the value of
0. Similarly, if month is November, then,b1takes the value of
0,b2takes the value of 1 and all the other dummy variables,
b3−b12, take the value of 0 and so on.
Equation (1) was applied to the twelve sub-basins of Thessaly producing one downscaling equation per sub-basin. This analysis has shown that the correlation coefficient, r, between the logarithmically transformed estimated down-scaled monthly areal precipitation and the logarithmically
0 5 10 15 20 25 1 10 100
Return Period (years)
A n n u al D rought Seve ri ty d cvv 1-month 3-month 6-month 9-month 12-month
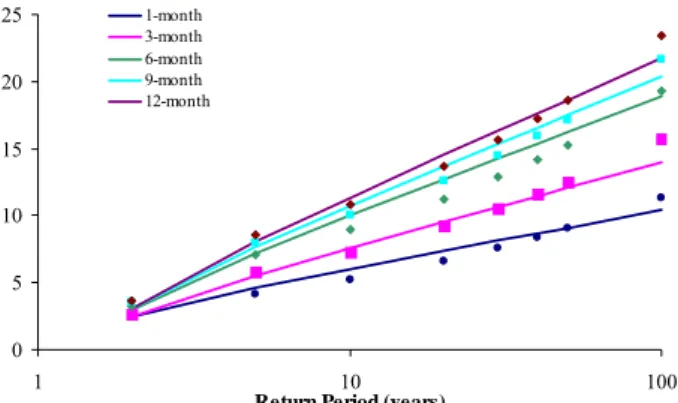
Figure 2. Empirical (lines) and the fitted analytical (symbols) Annual Weighted Cumulative Drought Severity-Timescale-Frequency curves – Ali Efenti sub-basin.
Fig. 2. Empirical (lines) and the fitted analytical (symbols) An-nual Weighted Cumulative Drought Severity-Timescale-Frequency curves – Ali Efenti sub-basin.
transformed observed monthly basin-wide precipitation was, on average, equal to 0.64 for the development base pe-riod, 1960–1990, and 0.66 for the validation pepe-riod, 1990– 1993 (Table 1). All the developed relationships have been found to be statistically significant at α=5% significance level using the t-test. The correlation coefficient was found to be higher for the mountainous sub-basins (e.g. Mouzaki, Pili, Smokovo, Sarakina), where precipitation is larger, than the correlation for the sub-basins of the Thessaly plain (e.g. Karla, Larissa, Mesoxori, etc.) (Table 1). These re-sults are comparable with the rere-sults of previous studies on statistical monthly precipitation downscaling with more so-phisticated methodologies (Schoof and Pryor, 2001; Buis-hand et al., 2004; Tatli et al., 2004). However, this regression model (Eq. 1) failed to reproduce the variance of precipita-tion, although simulated quite well the mean monthly precip-itation. For this reason, the statistical regression model was used to estimate the monthly change in downscaled precipi-tation between the historical base period, 1960–1990, and the future periods, 2020–2050, and 2070–2100. These monthly changes were, then, used to perturb the historical time series of precipitation generating the precipitation for the future pe-riods.
3.3 Annual Weighted Cumulative Drought Severity-Timescale-Frequency Curves
In this paper a procedure has been developed for the estima-tion of Annual Weighted Cumulative Drought Severity-Time Scale-Frequency curves. First, the Annual Weighted Cumu-lative Drought Severity has been calculated according to the following procedure:
– For every year, the computed monthly SPI values for various time scales were calculated,
– The annual weighted cumulative drought severity in sub-basin or area was estimated by dividing the annual
sum of SPI in monthly dry spells (negative SPI values) for a particular time scale by 12 (essentially multiply-ing with the probability of drought occurrence for each year) (Kim et al., 2002; Loukas and Vasiliades, 2004), – This procedure is repeated for each selected time scale
of SPI (i.e. 1 to 12 months)
Then, frequency analysis is performed for each time scale to associate the drought severity with return periods, con-sidering an adequate probability distribution. Finally, the empirical Annual Weighted Cumulative Drought Severity-Timescale-Frequency curves have been developed for each sub-basin or area. These curves integrate the drought severity and frequency for various forms of droughts (e.g. hydrologi-cal, agricultural, water resources droughts) since the various time scales of SPI quantify the natural lags between precip-itation and other water usable sources (e.g. river discharge, soil moisture and reservoir storage). These curves are sim-ilar to the Rainfall Depth-Duration-Frequency curves which are commonly used in hydrology (Maidment, 1993) and in-tegrate the relationships between drought severity, time scale and frequency. The above analysis was performed for the historical and the two future time periods.
Various theoretical probability distributions were statis-tically tested before fitting the observed weighted drought severity for the various SPI time scales. The Kolmogorov-Smirnov (K-S) test and the Chi-Square (χ2)tests were used for the selection of the most adequate probability distribu-tion. Most of the theoretical probability distributions have passed the tests. However, the Extreme Value I (Gumbel, EVI) distribution has been selected for the analysis because: 1) overall, it best performed for the analysis of drought sever-ity and for all SPI time scales, 2) it is a two parameter probability distribution and its parameter values may be es-timated with less uncertainty, especially for small samples, and 3) it is commonly used for drought analyses (Loaiciga et al., 1992; Lana and Burgueno, 1998; Henriques and Santos, 1999; Kim et al., 2002; Loukas and Vasiliades, 2004).
A general analytical relationship has also been fitted to the empirical Annual Weighted Cumulative Drought Severity-Timescale-Frequency curves of each sub-basin or area and for each one of the three time periods. The form of the ana-lytical relationship is:
X
SPI=λTk(D)1−η (2)
where, PSPI is the annual weighted drought severity, T is the return period, D is the time scale and λ, η, k are parameters fitted to the empirical curves. Figure 2 presents the empirical and the fitted analytical relation-ships of Annual Weighted Cumulative Drought Severity-Timescale-Frequency curves for the Ali Efenti sub-basin.
A. Loukas et al.: Climate change effects on drought severity 27 -4 -3 -2 -1 0 1 2 3 4 1 2 3 4 5 6 7 8 9 10 11 12 13 14 15 16 17 18 19 20 21 22 23 24 25 26 27 28 29 30 Hydrologic Year SP I V a lu e Historical A2 2020-2050 B2 2020-2050 -4 -3 -2 -1 0 1 2 3 4 1 2 3 4 5 6 7 8 9 10 11 12 13 14 15 16 17 18 19 20 21 22 23 24 25 26 27 28 29 30 Hydrologic Year SPI V a lu e Historical A2 2070-2100 B2 2070-2100
Figure 3. Present and future 6-month SPI timeseries for the two socio-economic scenarios in Ali Efenti sub-basin: a) Period 2020-2050 and b) Period 2070-2100.
a)
b)
Fig. 3. Present and future 6-month SPI timeseries for the two socio-economic scenarios in Ali Efenti sub-basin: (a) Period 2020–2050 and (b) Period 2070–2100. 0 5 10 15 20 25 30 35 40 1 10 100
Return Period (years)
A n nu al D rou ght S ever it y d 1960-93 EVI SRES A2 2020-2050 EVI SRES B2 2020-2050 EVI SRES A2 2070-2100 EVI SRES B2 2070-2100 EVI EVI UCL95 EVI LCL95
Figure 4. Fitted Extreme Value I (EVI, Gumbel) distributions to Annual Weighted Cumulative Drought Severity of 6-month SPI for historical and future periods – Ali Efenti sub-basin.
Fig. 4. Fitted Extreme Value I (EVI, Gumbel) distributions to An-nual Weighted Cumulative Drought Severity of 6-month SPI for his-torical and future periods – Ali Efenti sub-basin.
4 Results
The results for the sub-basin of Ali Efenti are mainly psented due to paper length limitations and because the re-sults of this sub-basin are considered representative of the whole area. The computation of SPI timeseries for the his-torical (1960–1990) and the two future periods (2020–2050, 2070–2100) and their comparison indicated that there is a
0 10 20 30 40 0 10 20 30 40
Annual Drought Severity (EVI)
A nnua l D r o u g h t Se v e r it y ( R e la ti o ns hi p) 2070-2100 based projections 2020-2050 based projections Present based projections
0 10 20 30 40 0 10 20 30 40
Annual Drought Severity (EVI)
A nnua l D r o u g h t Se v e r it y ( R e la ti o ns hi p) 2070-2100 based projections 2020-2050 based projections Present based projections
Fig. 5. : Scattergraphs of Annual Weighted Cumulative Drought Severity for various time scales and frequencies for empirical and analytical relationships. a) SRES A2 and b) SRES B2.
a)
b)
Fig. 5. Scattergraphs of Annual Weighted Cumulative Drought Severity for various time scales and frequencies for empirical and analytical relationships. (a) SRES A2 and (b) SRES B2.
small change in SPI severity between the historical and the first future period (2020–2050) (Fig. 3a). This result is ev-ident for both future socio-economic scenarios (SRES A2 and B2). However, the timeseries of SPI were found to be sifted to smaller and negative values during the second future period (2070–2100), when significant differences were ob-served. For this period, the drought severity increased, espe-cially, for the scenario SRES A2, whereas the scenario SRES B2 was found to be more conservative exhibiting smaller changes (Fig. 3b).
The above results were evident for all sub-basins or ar-eas of Thessaly and for all time scales of SPI, and they are better depicted in the comparison of number of dry months (with SPI<−1) for the historical and the two future peri-ods (Table 2). According to this analysis, the number of dry months was increased by an average of 40–50% for the period 2020–2050 for both socio-economic scenarios. On the other hand, the respective increase for the period 2070– 2100 over the historical period was overwhelming, espe-cially for the SRES A2 scenario (more than 160%, on av-erage). The number of dry months was found to tripled and even quadrupled for certain sub-basins or areas. Smaller, but
Table 2. Total numbers of dry months (SPI≤−1) in 6-month SPI for climate scenarios and future periods at the twelve study sub-basins.
Sub-basin Base Period 2020–2050 2020–2050 2070–2100 2070–2100
1960–1990 SRES A2 SRES B2 SRES A2 SRES B2
Ali Efenti 59 73 69 116 94 Coastal 60 79 82 148 112 Karla 53 76 75 132 103 Larissa 56 86 85 214 122 Magnesia 60 98 100 184 137 Mesoxori 67 94 96 159 120 Mouzaki 59 77 76 116 94 Pili 51 61 62 101 78 Sarakina 63 69 70 114 84 Skopia 60 74 70 95 111 Smokovo 52 131 105 196 150 Southern 54 106 103 218 158
Table 3. Parameters of the analytical Annual Weighted Cumulative Drought Severity-Timescale-Frequency curves for historical and future periods – Ali Efenti sub-basin.
Parameters Base Period 2020–2050 2020–2050 2070–2100 2070–2100
1960–1990 SRES A2 SRES B2 SRES A2 SRES B2
λ 2.45 2.95 2.95 4.08 3.46
κ 0.33 0.32 0.32 0.29 0.30
η 0.71 0.67 0.67 0.64 0.66
R2 0.95 0.95 0.95 0.97 0.96
still considerable, increase in the number of dry months was found for the SRES B2 scenario (100% increase, on aver-age). Additionally, this analysis indicated that the impacts of climate change on droughts would not be uniform over Thes-saly region and there would be certainly areas affected more than others without any obvious geographical trend.
The frequency analysis (Fig. 4) indicated that droughts would become more frequent and with increasing severity for all time scales and, especially, towards the end of the century (2070–2100) and for the socio-economic scenario SRES A2 (Fig. 4). The scenario SRES B2 produced less se-vere droughts and their fitted EVI frequency distribution was not statistically significant for the period 2020–2050 from the respective EVI for the historical period as indicated by the Kolmogorov-Smirnov test at 5% significance level. Fur-thermore, the fitted EVI curves for both socio-economic sce-narios for the period 2020–2050 were lying within the 95% confidence intervals of the fitted EVI curved for the historical base period 1960–1990 (Fig. 4).
The values of the parameters of the fitted analytical equa-tions of Annual Weighted Cumulative Drought Severity-Timescale-Frequency curves for the historical and the two future periods indicated the increase of drought severity for all time scales (Table 3). The increase of the annual
drought severity was much larger and statistically significant (indicated by the Kolmogorov-Smirnov test at 5% signifi-cance level) for the future 2070–2100 period and the socio-economic scenario SRES A2 (Fig. 5). The increase in an-nual drought severity over the historical drought severity was marginal and statistical insignificant (at 5% level) for the 2020–2050 period and, especially, for the scenario SRES B2. This is evident for all sub-basins or areas and for all time scales of SPI.
5 Conclusions
This study illustrated that Thessaly region experienced fre-quent moderate and severe droughts during the period 1960– 1990 and future climate change would result in a signifi-cant increase in drought severity. The outputs of CGCMa2 model have been employed for the estimation of future pre-cipitation timeseries for the periods of 2020–2050 and 2070– 2100. The historical and the downscaled future period pre-cipitation at twelve sub-basins or areas of Thessaly were used for the estimation of SPI for various time scales and for two socio-economic scenarios (i.e. SRES A2 and SRES B2). A new methodology was proposed for the estimation of
A. Loukas et al.: Climate change effects on drought severity 29 Annual Weighted Cumulative Drought
Severity-Timescale-Frequency curves which integrate the relationships between drought severity over the year, time scale and frequency and it could be applied for the identification of various types of drought. The results showed that the socio-economic sce-nario SRES A2 was more extreme than the scesce-nario SRES B2. Analyses of the future timeseries of SPI, of SPI fre-quency analysis, the Annual Weighted Cumulative Drought Severity-Timescale-Frequency curves indicated that large in-crease in drought severity is expected towards the end of the century for both socio-economic scenarios and for all time scales. However, these results were far from uniform for the region of Thessaly. These results indicated that cli-mate change would largely affect drought severity and sub-sequently the design of future water resources projects. Thus, sustainable water management measures should be planned to mitigate future impacts of droughts in Thessaly region.
Acknowledgements. The authors would like to thank the guest
editors and the anonymous reviewer for their valuable comments which improved the quality of the paper.
Edited by: A. Mugnai
Reviewed by: one anonymous referee
References
Bartzokas, A., Lolis, C., and Metaxas, D. A.: The 850 hPa relative vorticity centres of action for winter precipitation in the Greek area, Int. J. Climatol., 23, 813–828, 2003.
Blenkinsop, S. and Fowler, H. J.: Changes in drought characteris-tics for Europe projected by the PRUDENCE regional climate models, Int. J. Climatol., 27, 12, 1595–1610, 2007.
Boer, G. J., Flato, G., Reader, M. C., and Ramsden, D.: A transient climate change simulation with greenhouse gas and aerosol forc-ing: experimental design and comparison with the instrumental record for the twentieth century, Clim. Dyn., 16, 405–425, 2000. Bordi, I., Fraedrich, K., Petitta, M., and Suttera, A.: Extreme value analysis of wet and dry periods in Sicily, Theor. Appl. Climatol., 87, 61–71, 2007.
Buishand, T. A., Shabalova, M. V., and Brandsma, T.: On the choice of the temporal aggregation level for statistical downscaling of precipitation, J. Climate, 17, 1816–1827, 2004.
European Environmental Agency, (EEA): Mapping the impacts of recent natural disasters and technological accidents in Eu-rope, Environmental issue report No. 35, European Environment Agency, Copenhagen, 2004.
Flato, G. M. and Boer, G. J.: Warming asymmetry in climate change simulations, Geoph. Res. Lett., 28, 195–198, 2001.
Henriques, A. G. and Santos, M. J. J.: Regional drought distribution model, Phys. Chem. Earth (B), 24, 1–2, 19–22, 1999.
Hisdal, H., Stahl, K., Tallaksen, L. M., and Demuth, S.: Have streamflow droughts in Europe more severe of frequent?, Int. J. Climatol., 21, 317–333, 2001.
Houssos, E. E. and Bartzokas, A.: Extreme precipitation events in NW Greece, Adv. Geosci., 7, 91–96, 2006,
http://www.adv-geosci.net/7/91/2006/.
Intergovernmental Panel on Climate Change, (IPCC): Climate Change 2001 – The Scientific Basis, Cambridge University Press, Cambridge, 2001.
Intergovernmental Panel on Climate Change, (IPCC): Climate Change 2007: Synthesis Report of the Fourth Assessment Re-port, IPCC, 2007.
Kim, T. W., Valdes, J. B., and Aparicio, J.: Frequency and spatial characteristics of droughts in the Conchos River Basin, Mexico, Water Int., 27, 3, 420–430, 2002.
Kothavala, Z.: The duration and severity of drought over eastern Australia simulated by a coupled ocean-atmosphere GCM with a transient increase in CO2, Envir. Model. Soft., 14, 243–252, 1999.
Lana, X. and Burgueno, A.: Spatial and temporal characterization of annual extreme droughts in Catalonia (Northern Spain), Int. J. Climatol., 18, 93–110, 1998.
Loaiciga, H. A., Michaelsen, J., Garver, S., Haston, L., and Leipnik, L. B.: Droughts in river basins of the United States, Geophys. Res. Lett., 19, 20, 2051–2054, 1992.
Loukas, A. and Vasiliades, L.: Probabilistic analysis of drought spa-tiotemporal characteristics in Thessaly region, Greece, Nat. Haz-ards Earth Syst. Sci., 4, 719–731, 2004,
http://www.nat-hazards-earth-syst-sci.net/4/719/2004/.
Loukas, A., Vasiliades, L., and Tzabiras, J.: Evaluation of climate change on drought impulses in Thessaly, Greece, European Wa-ter Journal, 17/18, in press, 2007.
Maidment, D. R.: Handbook of Hydrology, McGraw-Hill, New York, 1424 pp., 1993.
Mavromatis, T.: Drought index evaluation for assessing future wheat production in Greece, Int. J. Climatol., 27, 7, 911–924, 2007.
McKee, T. B., Doesken, N. J., and Kleist, J.: Drought monitoring with multiple time scales, Preprints, 9th Conference on Applied Climatology, Dallas, TX, Amer. Meteor. Soc., 233–236, 1995. McKee, T. B., Doesken, N. J., and Kleist, J.: The relationship of
drought frequency and duration to time scales, Preprints, 8th Conference on Applied Climatology, Anaheim, CA, Amer. Me-teor. Soc., 179–184, 1993.
Metaxas, D. A., Bartzokas, A., Repapis, C. C., and Dalezios, N. R.: Atmospheric circulation anomalies in dry and wet winters in Greece, Meteor. Z., 2, 3, 127–131, 1993.
National Observatory of Athens: Climatic Changes in Mediter-ranean, Scientific Report, National Observatory of Athens, Athens, Greece, 2001.
Schoof, J. T. and Pryor, S. C.: Downscaling temperature and precip-itation: a comparison of regression-based methods and artificial neural networks, Int. J. Climatol., 21, 773–790, 2001.
Smakhtin, V. U.: Low flow hydrology: A review, J. Hydrol., 240, 147–186, 2001.
Tatli, H., Dalfes, H. N., and Mentes, S. S.: A statistical downscal-ing method for monthly total precipitation over Turkey, Int. J. Climatol., 24, 161–180, 2004.
Weiss, M., Fl¨orke, F., Menzel, L., and Alcamo, J.: Model-based scenarios of Mediterranean droughts, Adv. Geosci., 12, 145–151, 2007, http://www.adv-geosci.net/12/145/2007/.
Xoplaki, E. Luterbacher, J. Buckard, R., Patrikas, I., and Ma-heras, P.: Connection between the large-scale 500 hPa geopoten-tial height fields and precipitation over Greece during wintertime, Clim. Res., 14, 129–146, 2000.