0095-1137/09/$08.00⫹0 doi:10.1128/JCM.01297-08
Copyright © 2009, American Society for Microbiology. All Rights Reserved.
Comparison of Automated Microarray Detection with Real-Time PCR
Assays for Detection of Respiratory Viruses in Specimens Obtained
from Children
䌤
Fre
´de
´ric Raymond,
1Julie Carbonneau,
1Nancy Boucher,
1Lynda Robitaille,
1Se
´bastien Boisvert,
1Whei-Kuo Wu,
2Gaston De Serres,
3Guy Boivin,
1* and Jacques Corbeil
1*
Infectious Disease Research Center of the CHUQ-CHUL and Laval University, Saint-Foy, Quebec, Canada1; AutoGenomics, Inc., Carlsbad, California2; and Institut National de Sante´ Publique du Que´bec, Quebec City, Quebec, Canada3
Received 9 July 2008/Returned for modification 3 October 2008/Accepted 9 January 2009
Respiratory virus infections are a major health concern and represent the primary cause of testing consul-tation and hospitalization for young children. We developed and compared two assays that allow the detection of up to 23 different respiratory viruses that frequently infect children. The first method consisted of single TaqMan quantitative real-time PCR assays in a 96-well-plate format. The second consisted of a multiplex PCR followed by primer extension and microarray hybridization in an integrated molecular diagnostic device, the Infiniti analyzer. Both of our assays can detect adenoviruses of groups A, B, C, and E; coronaviruses HKU1, 229E, NL63, and OC43; enteroviruses A, B, C, and D; rhinoviruses of genotypes A and B; influenza viruses A and B; human metapneumoviruses (HMPV) A and B, human respiratory syncytial viruses (HRSV) A and B; and parainfluenza viruses of types 1, 2, and 3. These tests were used to identify viruses in 221 nasopharyngeal aspirates obtained from children hospitalized for respiratory tract infections. Respiratory viruses were de-tected with at least one of the two methods in 81.4% of the 221 specimens: 10.0% were positive for HRSV A, 38.0% for HRSV B, 13.1% for influenzavirus A, 8.6% for any coronaviruses, 13.1% for rhinoviruses or enteroviruses, 7.2% for adenoviruses, 4.1% for HMPV, and 1.5% for parainfluenzaviruses. Multiple viral infections were found in 13.1% of the specimens. The two methods yielded concordant results for 94.1% of specimens. These tests allowed a thorough etiological assessment of respiratory viruses infecting children in hospital settings and would assist public health interventions.
Respiratory tract infections are an important cause of hos-pitalization in children. Most of these infections are caused by RNA viruses that produce influenzalike symptoms of variable severity (18). Because of cost and technical limitations, viro-logical testing is currently done sporadically and for a limited number of viruses at the clinician’s request. The availability of a molecular diagnostic test that allows the detection of all respiratory tract infection-related viruses would permit better management of patients and possibly limit unnecessary use of antibiotics (2, 32, 36).
The most frequent virus detected in young children suffering from respiratory tract infections is the human respiratory syn-cytial virus (HRSV) (9, 11). HRSV is the causal agent in up to 70% of bronchiolitis episodes in infants and young children (29). Other well-known clinically relevant respiratory viruses include influenza virus, rhinovirus, enterovirus, coronavirus, parainfluenza viruses, and adenoviruses. Recently described respiratory pathogens include human metapneumovirus (HMPV) (5, 7, 14, 15); coronaviruses severe acute respiratory syndrome coronavirus, HKU1, and NL63 (10); and bocaviruses (17). When using conventional diagnostic methods, multiple
virus infections are observed in 5% of respiratory tract infec-tions (8), whereas codetection rates of 11 to 20% have been observed when using molecular methods (1, 3, 8).
Proper viral diagnosis has been shown to reduce the length of hospital stay (2, 36). The classic diagnostic methods for the detection of respiratory viruses consist of virus growth on cell culture and direct immunofluorescence assays (30). Although very specific, these methods lack sensitivity, are burdensome, require skilled personnel, and can take a few days, if not weeks, before generating results in the case of cell culture. Solid-phase immunoassays are often inexpensive and rapid, but they are limited to the detection of a single virus species and have reduced sensitivity and specificity compared to cell culture (30, 32). In addition, the development of immunological tests is limited for some viruses with many subtypes, for example, adenoviruses, enteroviruses, and rhinoviruses.
PCR has been used to amplify and detect many respiratory viruses (35). Conventional PCR or real-time PCR has the potential for high sensitivity and specificity compared to the sensitivities and specificities of previous methods (21, 22, 33, 35). PCR was initially limited by the number of species that could be detected and identified in a single test, often requiring multiple parallel reactions (3, 28). In the last years, numerous tests have been developed using single-tube multiplex PCR to detect many viruses in one assay (12, 13, 31). Single-tube or parallel multiplex PCR assays can be coupled to hybridization using nylon membrane DNA arrays (6), conventional microar-rays (34), flow-thru DNA chips (19), semiconductor-based DNA microchips (24), or microspheres (25, 27). Several
respi-* Corresponding author. Mailing address for G. Boivin and J. Cor-beil: Infectious Disease Research Center of the CHUQ-CHUL and Laval University, 2705, Boulevard Laurier, Sainte-Foy (Quebec), G1V 4G2 Canada. Phone: 418-654-2705. Fax: 418-654-2715. E-mail for G. Boivin: [email protected]. E-mail for J. Corbeil: jacques [email protected].
䌤Published ahead of print on 21 January 2009.
743
on May 16, 2020 by guest
http://jcm.asm.org/
Downloaded from
on May 16, 2020 by guest
http://jcm.asm.org/
Downloaded from
on May 16, 2020 by guest
http://jcm.asm.org/
ratory virus panels (RVP) using the Luminex technology have been commercialized, such as xTAG RVP from Luminex (20, 26), Multicode PLx RVP from Eragen (27), and Resplex II from Qiagen (23). So far, these tests have not been fully automated, which limits their use in most clinical laboratories (16).
In order to identify the etiology of respiratory tract infec-tions, we developed a real-time PCR assay and a microarray assay detection system, allowing the diagnosis of 18 and 23 different respiratory virus types, respectively. The first method consists of single quantitative real-time PCR (qRT-PCR) Taq-Man assays adapted to the 96-well plate format, each plate allowing the testing of four specimens, along with a series of positive and negative controls. The real-time PCR assay has been optimized to reduce hands-on time. The second method consists of a multiplex PCR test followed by primer extension and microarray hybridization. The microarray as-say is automated with the Infiniti analyzer manufactured by AutoGenomics, Inc. (Carlsbad, CA). The Infiniti analyzer was 510K cleared by the FDA for several pharmacogenomic assays. After validation of both assays using laboratory strains of tar-geted viruses, we compared the performance of the two assays using specimens collected from childrenⱕ3 years of age hos-pitalized for acute respiratory tract infections (ARTI).
MATERIALS AND METHODS
Specimen collection and preparation.This study was accepted by the ethics committee of the Centre Hospitalier Universitaire de Quebec. We tested
naso-pharyngeal aspirate (NPA) specimens from 221 childrenⱕ3 years old who were
hospitalized between November 2001 and April 2002 for an ARTI ofⱕ7 days as
previously described (4, 5). NPAs (one per patient) were aliquotted and stored
at⫺80°C. Clinical information and clinical laboratory results were prospectively
collected after informed consent was obtained. Before nucleic acid extraction,
NPAs were thawed on ice and 0.5l of hepatitis C genotype 1a armored RNA
(Ambion Diagnostics, CA) was added to 200l of each NPA as an internal
control. Nucleic acid extraction was performed with a Qiamp viral RNA mini kit (Qiagen, Mississauga, Ontario, Canada) using the protocol suggested by the
manufacturer, except for the final elution volume, which was 40l. Reverse
transcription was done using a Superscript II reverse transcriptase kit
(Invitro-gen, Carlsbad, CA). The reaction mixture was composed of 1l of 50 ng/l
random primers (Amersham, Piscataway, NJ), 1l of 10M deoxynucleoside
triphosphates (dNTPs), and 10l of extracted RNA. The mixture was incubated
at 65°C for 5 min and then put on ice. The following reagents were then added
to the solution: 4l of 5⫻first-strand buffer (Invitrogen), 2l of 0.1 M
dithio-threitol (Invitrogen), and 1l of 40 U/l RNAsin (Promega, Madison, WI). The
solution was incubated at room temperature for 2 min, and then 200 units of Superscript II (Invitrogen) were added. The solution was incubated at room temperature for 10 min, then at 42°C for 50 min, and finally at 70°C for 15 min.
The cDNA was kept at⫺20°C. The reverse-transcripted samples were then
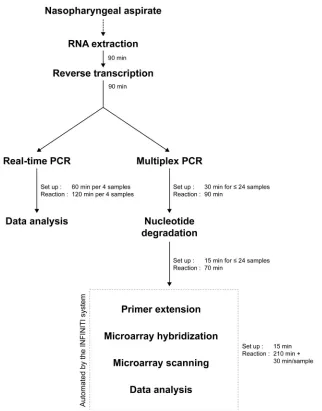
tested using both the microarray assay and the qRT-PCR assay (Fig. 1).
Clone generation and sensitivity studies.Laboratory strains or clinical speci-mens were used to generate the clones for the sensitivity analyses. Amplicons generated using qRT-PCR primers or multiplex PCR primers were cloned in the pCR II (Invitrogen) or pGEM-T Easy (Promega) vectors. The insert sequence was verified by DNA sequencing. Prior to sensitivity studies, amplicons were digested with EcoRV (pCR II) or NdeI (pGEM-T Easy) for 120 to 180 min at 37°C. They were then purified using Qiagen PCR purification kits and quantified with a NanoDrop (Thermo Scientific, Wilmington, DE). Serial dilutions were performed in water to obtain a range of concentrations between 100,000 and 0.1
copies/l.
Both the cycle thresholds for the real-time PCR assay and the signal thresholds for the microarray assay were determined by analyzing the results obtained with laboratory strains and the results of the sensitivity study. Then, thresholds were adjusted according to the background signal of several negative specimens and the signals obtained with several laboratory strains and clinical specimens.
Primers and probes.The PCR primers for the real-time PCR assay and for the multiplex PCR targeted the same gene, except for the HMPV and adenovirus primers. However, even when targeting the same gene, both assays had distinct
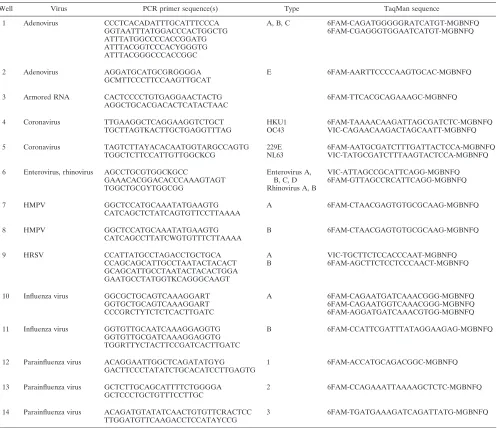
primer sets. All primers for qRT-PCR were obtained from Invitrogen Canada. TaqMan probes with minor groove binding quenchers were obtained from Ap-plied Biosystems (Streetsville, Ontario, Canada). The sequences of primers and probes used for the qRT-PCR assay are shown in Table 1. The multiplex PCR primer mix contains all PCR primers at final concentrations ranging between 50 and 200 nM depending on the targeted virus. The primers used for primer extension were composed of a proprietary tag sequence followed by a virus-specific detection sequence. The primer concentration in the primer exten-sion mix ranged from 250 to 500 nM, depending on the virus targeted. The multiplex PCR primer mix and primer extension mix were obtained from AutoGenomics, Inc.
qRT-PCR assay.All reactions were performed in a 96-well plate using TaqMan universal PCR master mix (Applied Biosystems) in an ABI 7500 apparatus (Applied Biosystems). PCR primers were used at a 200 nM concentration, and TaqMan probes were used at a total probe concentration per well of 250 nM. Each 96-well PCR plate allows for the testing of four specimens, positive controls consisting of cloned amplicons of specific viruses, and negative controls consist-ing of water for each virus. For each specimen tested, 14 wells of the plate were used. One microliter of specimen cDNA or plasmid control was added to each well of the plate. The PCR program consisted of the following steps: 2 min at 50°C and 10 min at 95°C, followed by 50 cycles of 15 s at 95°C, 15 s at 55°C, and 40 s at 60°C. A specimen was considered positive for a virus if its cycle threshold was lower than a predefined value (Table 2).
Infiniti microarray assay.First, reverse-transcribed samples were amplified using a highly multiplexed PCR. Then, amplicons were cleaned by enzymatic reactions and were then subjected to primer extension within the Infiniti ana-lyzer. The assay relies on a proprietary tag system in which amplicons are tagged at the primer extension step. Amplicons are also labeled with fluorescent nucle-otides at the primer extension step. Hybridization of the tags to the antitags immobilized on the microarray allows the specific identification of targets. Each antitag hybridizes to three replicates on the microarray. Microarray washing and scanning were done within the Infiniti analyzer without human intervention. A summary of the microarray assay protocol is shown in Fig. 1.
Multiplex PCR was performed in a T1plus thermocycler (Biometra; Montreal Biotech, Montreal, Canada). The multiplex PCR primer mix was composed of 46 primers at concentrations ranging from 50 nM to 200 nM. The amplification
solution was composed of 10⫻buffer, 0.2M dNTPs, 1.5 mM MgCl2, multiplex
PCR primer mix, 0.5 units of platinumTaqDNA polymerase (Invitrogen
Can-ada), and 2.5l of cDNA in a final volume of 20l. The PCR program consisted
of the following steps: 60 s at 94°C, followed by 39 cycles of 30 s at 94°C, 30 s at 55°C, and 60 s at 72°C. The reaction mixture was then incubated at 72°C for 3 min. Then, 3 units of shrimp alkaline phosphatase (Clontech, Mountain View,
CA), 7.5 units of exonuclease (Clontech), and 0.25l of 50⫻titanium DNA
polymerase (Clontech) were added to the solution, which was incubated at 37°C for 50 min and at 94°C for 20 min. This step allows for the degradation of remaining dNTPs and PCR primers that were not used in the multiplex PCR. The subsequent steps were automated by the Infiniti analyzer (AutoGenomics, Inc.). The primer extension solution, comprising 34 tagged detection primers (AutoGenomics, Inc.), was then added to the solution. The primer extension reaction consisted of the following steps: 60 s at 94°C, followed by 39 cycles of 15 s at 94°C and 15 s at 50°C. Primer extension was done in the presence of
Cy5-dCTP. Following the primer extension reaction, 80l of hybridization
so-lution (AutoGenomics, Inc.) was added to each reaction mixture. The total
volume of 120l was then hybridized to a DNA microarray (AutoGenomics,
Inc.) for 90 min at 42°C at high humidity. The tags on the extension primers hybridize to corresponding probes on the microarray. After hybridization, each
chip was washed five times with 300l of 1⫻SSC (1⫻SSC is 0.15 M NaCl plus
0.015 M sodium citrate). The chips were dried and scanned using a confocal scanner. A specimen was considered positive for a virus if the ratio between the signal for a virus and the background signal was above a defined threshold (Table 2) after background correction.
RESULTS
Sensitivities of real-time PCR assay and microarray assay.
The capacity of both methods to detect each targeted virus was initially validated by using laboratory isolates and clinical spec-imens. The technical specificity was assessed by using labora-tory strains and clinical specimens validated by using culture or sequencing (Table 3). No false positives were observed, and all described specimens were positive by both assays. Then,
on May 16, 2020 by guest
http://jcm.asm.org/
sitivity assays were conducted using cloned amplicons (Table 2). The sensitivities of each single TaqMan qRT-PCR assay ranged from 5 to 250 copies of target DNA per reaction, depending on the virus targeted. The sensitivity of the Infiniti microarray assay ranged from 10 copies of target DNA for HRSV B and HMPV A to 2,500 copies for parainfluenza viruses type 2 and 3 and coronavirus 229E and 5,000 copies for parainfluenza virus type 1. In most cases, the qRT-PCR assay was more sensitive than the microarray assay. However, similar sensitivities of the two assays were obtained for HRSV B and an increased sensitivity was obtained with the microarray assay for HMPV A.
Retrospective study results.The study included 221 speci-mens collected during the 2001-to-2002 winter season from children ⱕ3 years old hospitalized for ARTI. All specimens were positive by both methods for the armored-RNA internal control. Specimens were considered positive for one virus if
they were positive by one or both methods. Of the 221 speci-mens, 81.4% of the specimens were positive for at least one virus. Furthermore, 68.3% of the specimens were positive for one virus, 12.2% were positive for two viruses, and 0.9% were positive for three viruses. Among coinfections, 41.4% involved adenoviruses (P ⬍ 0.001; Fisher’s exact test) and 34.5% in-volved picornaviruses (P⬍0.05; Fisher’s exact test).
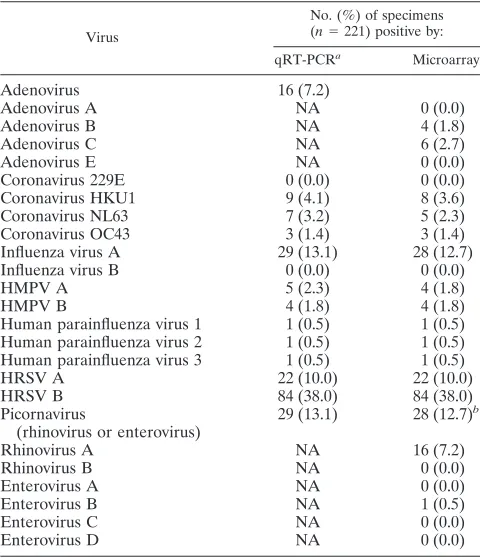
[image:3.585.133.455.65.476.2]Table 4 shows the sample positivity for each virus as de-tected by the two methods. We considered a specimen positive for a virus if it was positive with either method. The most frequently detected virus was HRSV, including 38% type B and 10% type A. Influenza virus A and picornaviruses (rhino-viruses or entero(rhino-viruses) were both detected in 13.1% of spec-imens. Adenoviruses, coronaviruses, HMPV, and parainflu-enza viruses were detected in 7.2%, 8.6%, 4.1%, and 1.5% of specimens, respectively.
FIG. 1. Flowchart comparing the protocols for the real-time PCR assay and for the microarray assay. RNA extraction and reverse transcription steps are common to both methods. The real-time PCR assay has only one setup step, while the microarray assay has three. However, the time required to perform the real-time PCR assay increased for each four samples tested. The time required for the automated microarray assay is increased for each 24 samples. Overall, the qRT-PCR assay requires 60 min of setup time and a total of 120 min of reaction time for 4 specimens, while the microarray assay requires 60 min of setup time and 17 h of reaction time for 24 specimens.
on May 16, 2020 by guest
http://jcm.asm.org/
For some viruses, the type was also identified. Due to the methodological design, the identification of virus types for adenoviruses and picornaviruses was only possible with the microarray assay. Of the nine specimens that were positive for adenoviruses by the microarray, three were adenovirus type B, five were adenovirus type C, and one was positive for both type B and C. Of the 29 specimens that were positive for respiratory picornaviruses, 16 were positive for rhinovirus type A, one was positive for enterovirus type B, and 11 were untyped picorna-viruses. HRSV types were identified by both methods for all HRSV-positive specimens, which included 22 type A and 84 type B. HMPV types were also identified by both methods for all positive specimens, including five type A (including one microarray false negative), and four type B. Coronaviruses HKU1, NL63, and OC43 were identified by qRT-PCR in nine, seven, and three specimens, respectively.
Comparison of real-time PCR assay with microarray assay.
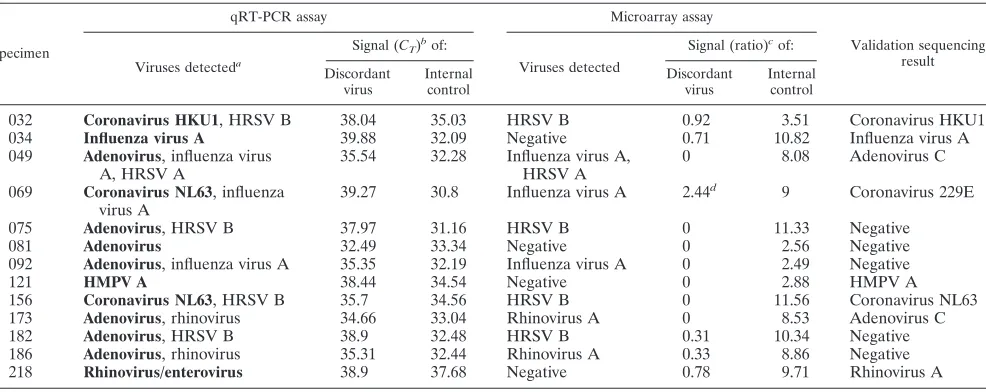
[image:4.585.45.546.79.507.2]Overall, 79.6% of the 221 specimens were positive for at least one virus with both techniques, 18.5% were negative for all viruses by both methods, and 1.8% (4/221) were positive for at least one virus by qRT-PCR only (Table 5). No viruses were detected with the microarray method only. The results with both methods were compared for each specimen, and a con-cordance in the diagnosis was observed for 94.1% of the spec-imens. When specific diagnosis for each virus was considered, a perfect concordance between the two methods was observed for HRSV types A and B, parainfluenza viruses, HMPV type B, and coronavirus OC43. Of the 5.9% (13/221) of specimens with discordant results (all positive with qRT-PCR only), there were seven specimens of adenoviruses, two of coronavirus NL63, one of coronavirus HKU1, one of HMPV A, one of influenza virus A, and one of picornavirus (Table 6). In most
TABLE 1. Sequences of primers and probes for the qRT-PCR assay
Well Virus PCR primer sequence(s) Type TaqMan sequence
1 Adenovirus CCCTCACADATTTGCATTTCCCA A, B, C 6FAM-CAGATGGGGGRATCATGT-MGBNFQ
GGTAATTTATGGACCCACTGGCTG 6FAM-CGAGGGTGGAATCATGT-MGBNFQ
ATTTATGGCCCCACCGGATG ATTTACGGTCCCACYGGGTG ATTTACGGGCCCACCGGC
2 Adenovirus AGGATGCATGCGRGGGGA E 6FAM-AARTTCCCCAAGTGCAC-MGBNFQ
GCMTTCCCTTCCAAGTTGCAT
3 Armored RNA CACTCCCCTGTGAGGAACTACTG 6FAM-TTCACGCAGAAAGC-MGBNFQ
AGGCTGCACGACACTCATACTAAC
4 Coronavirus TTGAAGGCTCAGGAAGGTCTGCT HKU1 6FAM-TAAAACAAGATTAGCGATCTC-MGBNFQ
TGCTTAGTKACTTGCTGAGGTTTAG OC43 VIC-CAGAACAAGACTAGCAATT-MGBNFQ
5 Coronavirus TAGTCTTAYACACAATGGTARGCCAGTG 229E 6FAM-AATGCGATCTTTGATTACTCCA-MGBNFQ
TGGCTCTTCCATTGTTGGCKCG NL63 VIC-TATGCGATCTTTAAGTACTCCA-MGBNFQ
6 Enterovirus, rhinovirus AGCCTGCGTGGCKGCC Enterovirus A,
B, C, D
VIC-ATTAGCCGCATTCAGG-MGBNFQ
GAAACACGGACACCCAAAGTAGT 6FAM-GTTAGCCRCATTCAGG-MGBNFQ
TGGCTGCGYTGGCGG Rhinovirus A, B
7 HMPV GGCTCCATGCAAATATGAAGTG A 6FAM-CTAACGAGTGTGCGCAAG-MGBNFQ
CATCAGCTCTATCAGTGTTCCTTAAAA
8 HMPV GGCTCCATGCAAATATGAAGTG B 6FAM-CTAACGAGTGTGCGCAAG-MGBNFQ
CATCAGCCTTATCWGTGTTTCTTAAAA
9 HRSV CCATTATGCCTAGACCTGCTGCA A VIC-TGCTTCTCCACCCAAT-MGBNFQ
CCAGCAGCATTGCCTAATACTACACT B 6FAM-AGCTTCTCCTCCCAACT-MGBNFQ
GCAGCATTGCCTAATACTACACTGGA GAATGCCTATGGTKCAGGGCAAGT
10 Influenza virus GGCGCTGCAGTCAAAGGART A 6FAM-CAGAATGATCAAACGGG-MGBNFQ
GGTGCTGCAGTCAAAGGART 6FAM-CAGAATGGTCAAACGGG-MGBNFQ
CCCGRCTYTCTCTCACTTGATC 6FAM-AGGATGATCAAACGTGG-MGBNFQ
11 Influenza virus GGTGTTGCAATCAAAGGAGGTG B 6FAM-CCATTCGATTTATAGGAAGAG-MGBNFQ
GGTGTTGCGATCAAAGGAGGTG TGGRTTYCTACTTCCGATCACTTGATC
12 Parainfluenza virus ACAGGAATTGGCTCAGATATGYG 1 6FAM-ACCATGCAGACGGC-MGBNFQ
GACTTCCCTATATCTGCACATCCTTGAGTG
13 Parainfluenza virus GCTCTTGCAGCATTTTCTGGGGA 2 6FAM-CCAGAAATTAAAAGCTCTC-MGBNFQ
GCTCCCTGCTGTTTCCTTGC
14 Parainfluenza virus ACAGATGTATATCAACTGTGTTCRACTCC 3 6FAM-TGATGAAAGATCAGATTATG-MGBNFQ
TTGGATGTTCAAGACCTCCATAYCCG
on May 16, 2020 by guest
http://jcm.asm.org/
cases, no signal was observed with the microarray assay for discordant specimens. However, discordant coronavirus HKU1, influenza virus A, and picornavirus specimens gave equivocal (0⬍ratio⬍threshold) results with the microarray assay and had high cycle thresholds of 38.0, 39.9, and 38.9, respectively, with the qRT-PCR assay. Discordant specimens were tested by DNA sequencing, as shown in Table 6. Seven discordant specimens were confirmed by DNA sequencing, while we were unable to confirm five specimens positive for adenovirus with the qRT-PCR assay. One specimen, positive for coronavirus NL63 with the qRT-PCR assay and giving an equivocal coronavirus 229E signal with the microarray assay, was shown to be positive for coronavirus 229E by DNA se-quencing, suggesting possible specificity issues with the qRT-PCR assay. We observed no false positives with the microarray assay compared to the results from the qRT-PCR assay and DNA sequencing.
From a technical viewpoint, the microarray assay required 77 events of manual pipetting for 24 specimens, while qRT-PCR required at least 288 manual pipetting events for only 4 specimens and appropriate controls. Figure 1 shows a
flow-TABLE 2. Sensitivity of qRT-PCR and microarray assay for each virus
Virus Gene(s)a
qRT-PCR assay Microarray assay
Thresholdb Sensitivity
(copy no.) Threshold
c Sensitivity (copy no.)
Adenovirus IVA2/L4100kd 40 10 1.5 1,000 (group B)/250 (group C)
Coronavirus 229E Nucleocapsid 45 50 3 2,500
Coronavirus HKU1 Nucleocapsid 40 10 1.5 500
Coronavirus NL63 Nucleocapsid 40 100 1.5 500
Coronavirus OC43 Nucleocapsid 45 50 2 250
Enterovirus 5⬘untranslated region 40 5 1/1.5 250
Rhinovirus 5⬘untranslated region 40 250 1/1.5 1,000
Influenza virus A Nucleocapsid 40 50 1.5 100
Influenza virus B Nucleocapsid 42 10 1.5 100
HMPV A Matrix/F 40 50 1 10
HMPV B Matrix/F 40 50 3 250
HRSV A Nucleocapsid 45 250 1 50
HRSV B Nucleocapsid 45 10 1 10
Parainfluenza virus 1 Hemagglutinin-neuraminidase 43 50 2 5,000
Parainfluenza virus 2 Fusion 40 5 2 2,500
Parainfluenza virus 3 Hemagglutinin-neuraminidase 44 50 2 2,500
a
A slash shows target genes that differ in qRT-PCR/microarray assays.
b
Maximum cycle threshold for positivity.
c
[image:5.585.46.541.82.268.2]Minimum ratio for positivity. A slash shows threshold forPicornaviridaedetection/threshold for species-specific detection.
TABLE 3. Specimens tested in the analytical specificity study
Virus No. of
specimens
Adenovirus B...1
Adenovirus C...1
Adenovirus E...1
Coronavirus 229E...1
Coronavirus NL63...1
Coronavirus OC43 ...1
Enterovirus B ...2
HMPV ...1
HRSV A...1
HRSV B ...5
Influenza virus A...3
Influenza virus B ...4
Parainfluenza virus 1 ...4
Parainfluenza virus 2 ...4
Parainfluenza virus 3 ...4
Parainfluenza virus 4 ...5
[image:5.585.301.541.405.684.2]Rhinovirus A ...2
TABLE 4. Sample positivity by qRT-PCR and microarray for each virus
Virus
No. (%) of specimens
(n⫽221) positive by:
qRT-PCRa Microarray
Adenovirus 16 (7.2)
Adenovirus A NA 0 (0.0)
Adenovirus B NA 4 (1.8)
Adenovirus C NA 6 (2.7)
Adenovirus E NA 0 (0.0)
Coronavirus 229E 0 (0.0) 0 (0.0)
Coronavirus HKU1 9 (4.1) 8 (3.6)
Coronavirus NL63 7 (3.2) 5 (2.3)
Coronavirus OC43 3 (1.4) 3 (1.4)
Influenza virus A 29 (13.1) 28 (12.7)
Influenza virus B 0 (0.0) 0 (0.0)
HMPV A 5 (2.3) 4 (1.8)
HMPV B 4 (1.8) 4 (1.8)
Human parainfluenza virus 1 1 (0.5) 1 (0.5) Human parainfluenza virus 2 1 (0.5) 1 (0.5) Human parainfluenza virus 3 1 (0.5) 1 (0.5)
HRSV A 22 (10.0) 22 (10.0)
HRSV B 84 (38.0) 84 (38.0)
Picornavirus
(rhinovirus or enterovirus)
29 (13.1) 28 (12.7)b
Rhinovirus A NA 16 (7.2)
Rhinovirus B NA 0 (0.0)
Enterovirus A NA 0 (0.0)
Enterovirus B NA 1 (0.5)
Enterovirus C NA 0 (0.0)
Enterovirus D NA 0 (0.0)
aGenotyping of adenoviruses and picornaviruses (rhinoviruses and
enterovi-ruses) was not done with the qRT-PCR method. NA, not applicable.
bAn independent probe targeting all picornaviruses (enteroviruses and
rhino-viruses) was used. A specimen can be positive for this probe without being positive for a type-specific enterovirus or rhinovirus probe.
on May 16, 2020 by guest
http://jcm.asm.org/
[image:5.585.43.281.544.722.2]chart comparing the steps and timelines for the real-time PCR assay and for the microarray system. Excluding RNA extrac-tion and reverse transcripextrac-tion, the automated microarray assay required at most 60 min of setup time for up to 24 samples, while the real-time PCR assay required the same time for a 96-well plate preparation to test only 4 specimens.
DISCUSSION
The comparison of the microarray assay automated by the Infiniti analyzer with the single qRT-PCR assays showed that both techniques were useful to detect and identify a panel of respiratory viruses in clinical specimens, present either as
sin-gle agents or as part of a coinfection. Overall, the sinsin-gle qRT-PCR assays were associated with better analytical sensitivity than the multiplex PCR followed by microarray detection. However, the results suggest that the 46-primer multiplex PCR assay should, in more than 94% of cases, give results similar to those obtained with the qRT-PCR assay when using naso-pharygeal aspirates from children.
[image:6.585.47.542.80.261.2]Because the sensitivity of the qRT-PCR assay is usually higher than that of the microarray assay, discordant specimens could generally be explained by differences in detection limits for the two assays (Tables 2 and 6). This seems particularly true for adenoviruses, for which the real-time PCR assay could
TABLE 5. Comparison of qRT-PCR and microarray results for 221 specimens
Virus
No. of specimens with indicated qRT-PCR/microarray resultsb Microarrayc
Pos/pos Pos/neg Neg/pos Neg/neg Sensitivity Specificity
Adenovirusa 9 7 0 205 0.563 1.000
Coronavirus 229E 0 0 0 221 NA 1.000
Coronavirus HKU1 8 1 0 212 0.889 1.000
Coronavirus NL63 5 2 0 214 0.714 1.000
Coronavirus OC43 3 0 0 218 1.000 1.000
Enterovirus/rhinovirus 28 1 0 192 0.966 1.000
Influenza virus A 28 1 0 192 0.966 1.000
Influenza virus B 0 0 0 221 NA 1.000
HMPV A 4 1 0 216 0.800 1.000
HMPV B 4 0 0 217 1.000 1.000
HRSV A 22 0 0 199 1.000 1.000
HRSV B 84 0 0 137 1.000 1.000
Parainfluenza virus 1 1 0 0 220 1.000 1.000
Parainfluenza virus 2 1 0 0 220 1.000 1.000
Parainfluenza virus 3 1 0 0 220 1.000 1.000
Any virus 176 4 0 41 0.978 1.000
a
Results of qRT-PCR and microarray assays were significantly different only for adenovirus. (P⬍0.05; McNemar’s test).
b
Pos, positive; neg, negative.
c
NA, not applicable.
TABLE 6. Signal, internal control, and DNA sequence validation results for specimens with discordant results in qRT-PCR and microarray assays
Specimen
qRT-PCR assay Microarray assay
Validation sequencing result
Viruses detecteda
Signal (CT)bof:
Viruses detected
Signal (ratio)cof:
Discordant virus
Internal control
Discordant virus
Internal control
032 Coronavirus HKU1, HRSV B 38.04 35.03 HRSV B 0.92 3.51 Coronavirus HKU1 034 Influenza virus A 39.88 32.09 Negative 0.71 10.82 Influenza virus A 049 Adenovirus, influenza virus
A, HRSV A
35.54 32.28 Influenza virus A, HRSV A
0 8.08 Adenovirus C
069 Coronavirus NL63, influenza virus A
39.27 30.8 Influenza virus A 2.44d 9 Coronavirus 229E
075 Adenovirus, HRSV B 37.97 31.16 HRSV B 0 11.33 Negative 081 Adenovirus 32.49 33.34 Negative 0 2.56 Negative 092 Adenovirus, influenza virus A 35.35 32.19 Influenza virus A 0 2.49 Negative
121 HMPV A 38.44 34.54 Negative 0 2.88 HMPV A
156 Coronavirus NL63, HRSV B 35.7 34.56 HRSV B 0 11.56 Coronavirus NL63 173 Adenovirus, rhinovirus 34.66 33.04 Rhinovirus A 0 8.53 Adenovirus C 182 Adenovirus, HRSV B 38.9 32.48 HRSV B 0.31 10.34 Negative 186 Adenovirus, rhinovirus 35.31 32.44 Rhinovirus A 0.33 8.86 Negative 218 Rhinovirus/enterovirus 38.9 37.68 Negative 0.78 9.71 Rhinovirus A
aViruses with discordant results are shown in boldface.
bC
T, cycle threshold.
cRatio of results for virus or internal control/background.
dAn equivocal signal was seen for coronavirus 229E.
on May 16, 2020 by guest
http://jcm.asm.org/
[image:6.585.48.541.497.693.2]detect as few as 10 copies of the target sequence, while the microarray assay detected only 250 copies of adenovirus C and 1,000 copies of adenovirus B. Moreover, the mean cycle threshold of the discordant adenovirus samples (35.7) was higher than that of the concordant adenovirus samples (31.9) (P⫽0.08; Student’sttest). In all seven discordant adenovirus cases, no significant signal (⬍0.5) was observed on the microar-ray assay. Only two of the seven discordant adenovirus speci-mens were confirmed by DNA sequencing. Thus, it is unclear if these specimens are false positives of the qRT-PCR assay or if the viral load is too low to allow DNA sequencing. Differ-ences in primer sequDiffer-ences may explain some discrepancies, either because of sequence variations or different PCR effi-ciencies. A low sensitivity for adenovirus detection was also described for other multiplex RVP assays (20, 25).
It is of note that 69.4% (9/13) of the discordant specimens had more than one virus detected by qRT-PCR (P⬍ 0.001; Fisher’s exact test). However, this analysis could be biased by the high rate of discordant adenoviruses that were part of coinfections (6/7). The rate of multiple infection was not dif-ferent for discordant and concordant adenovirus-positive spec-imens (P ⫽ 0.57; Fisher’s exact test). Still, multiple viruses within a specimen could potentially reduce the sensitivity of the microarray assay for some viruses, but further studies would be required to confirm this hypothesis.
The current version of the qRT-PCR 96-well-plate assay, although optimized to reduce pipetting steps, is labor inten-sive, time consuming, and has low throughput, allowing the testing of only four clinical samples per 96-well plate. Contrar-ily, the microarray assay, when automated by using the Infiniti analyzer, requires fewer human interventions and allows the testing of up to 24 samples per run. Due to its automation, this assay is also potentially less susceptible to manipulation errors and to cross-contamination than plate-based qRT-PCR tests. Notably, up to 5 h of hands-on time can be saved by using the automated microarray assay. The reduction in hands-on time with the microarray assay could be a financial advantage of this technique. Samples tested using the qRT-PCR assay could have results available on the same day, while samples tested using the microarray assay will have results available on the next day. Although results on the same day would be the ideal scenario, ease of implementation and a higher throughput may still be important factors in choosing a molecular diagnostic assay, especially in high-volume laboratories.
As new highly multiplexed molecular diagnostic devices are developed, it will be important to compare these techniques in order to establish their relative sensitivities, specificities, and ease of implementation in a clinical setting. Comparison of the automated microarray assay with commercially available RVP, such as xTAG RVP from Luminex (20, 26), Multicode PLx RVP from Eragen (27), and Resplex II from Qiagen (23), is an essential step in assessing the quality and clinical usefulness of the next generation of respiratory virus diagnostic methods. The viruses included in each panel may vary from product to product, according to assay design and approval by regulatory institutions. Also, threshold levels should be validated in each laboratory when implementing a new multiplex molecular as-say, because they may vary according to sample preparation methods and other internal issues. The ease of implementation of these techniques in a clinical setting is a critical factor in the
selection of a diagnostic assay (16). Currently, because of its automation on the Infiniti analyzer, the microarray assay de-scribed herein is the most adaptable system for clinical labo-ratories. Moreover, the ease of use of this assay could still be improved by performing one-step reverse transcription and by reducing the time dedicated to or completely removing the nucleotide degradation step. These improvements would fur-ther reduce the pipetting events required to test 24 specimens to only three steps per specimen. On the other hand, as for other multiplex assays, the workload of a clinical laboratory is an important criterion when selecting a diagnostic test for respiratory viruses.
While the precise identification of all viruses is not a high priority for clinicians at the moment, the multiplex assays should become increasingly helpful for epidemiological stud-ies, to assess clinical outcome according to virus type or mul-tiple infections, to understand the role of emerging viruses, and to limit the use of antibiotics. Future therapeutic modalities for many respiratory viruses should also increase the usefulness of these assays, in particular for immunocompromised patients and in urgent or intensive care settings. As respiratory viruses become a greater concern worldwide, such a tool will have increased usefulness for diagnosis and adequate use of antibi-otics and antiviral agents.
ACKNOWLEDGMENTS
F.R. holds a Ph.D. scholarship from the Canadian Institutes of Health Research. G.B. is the holder of the Canada Research Chair in Emerging Viruses and Antiviral Resistance. J.C. is the holder of the Canada Research Chair in Medical Genomics and is supported by the Canadian Institute of Health Research and the Canadian Foundation for Innovation. G.D.S. holds a clinical researcher scholarship from the Fond de la Recherche en Sante´ du Que´bec.
We thank AutoGenomics, Inc., for providing reagents necessary to conduct this study.
REFERENCES
1.Aberle, J. H., S. W. Aberle, E. Pracher, H. Hutter, M. Kundi, and T. Popow-Kraupp.2005. Single versus dual respiratory virus infections in hospitalized infants: impact on clinical course of disease and interferon-gamma response.
Pediatr. Infect. Dis. J.24:605–610.
2.Barenfanger, J., C. Drake, N. Leon, T. Mueller, and T. Troutt.2000. Clinical and financial benefits of rapid detection of respiratory viruses: an outcomes
study. J. Clin. Microbiol.38:2824–2828.
3.Bellau-Pujol, S., A. Vabret, L. Legrand, J. Dina, S. Gouarin, J. Petitjean-Lecherbonnier, B. Pozzetto, C. Ginevra, and F. Freymuth.2005. Develop-ment of three multiplex RT-PCR assays for the detection of 12 respiratory
RNA viruses. J. Virol. Methods126:53–63.
4.Boivin, G., M. Baz, S. Coˆte´, R. Gilca, C. Deffrasnes, E. Leblanc, M. G. Bergeron, P. De´ry, and G. De Serres.2005. Infections by human
coronavi-rus-NL in hospitalized children. Pediatr. Infect. Dis. J.24:1045–1048.
5.Boivin, G., G. De Serres, S. Coˆte´, R. Gilca, Y. Abed, L. Rochette, M. G. Bergeron, and P. De´ry.2003. Human metapneumovirus infections in
hospi-talized children. Emerg. Infect. Dis.9:634–640.
6.Coiras, M. T., M. R. Lo´pez-Huertas, G. Lo´pez-Campos, J. C. Aguilar, and P. Pe´rez-Bren˜a.2005. Oligonucleotide array for simultaneous detection of re-spiratory viruses using a reverse-line blot hybridization assay. J. Med. Virol.
76:256–264.
7.Deffrasnes, C., M. Hamelin, and G. Boivin.2007. Human metapneumovirus.
Semin. Respir. Crit. Care Med.28:213–221.
8.Drews, A. L., R. L. Atmar, W. P. Glezen, B. D. Baxter, P. A. Piedra, and S. B. Greenberg. 1997. Dual respiratory virus infections. Clin. Infect. Dis.25:
1421–1429.
9.Fleming, D. M., R. S. Pannell, A. J. Elliot, and K. W. Cross.2005. Respira-tory illness associated with influenza and respiraRespira-tory syncytial virus infection.
Arch. Dis. Child.90:741–746.
10.Fouchier, R. A., G. F. Rimmelzwaan, T. Kuiken, and A. D. Osterhaus.2005. Newer respiratory virus infections: human metapneumovirus, avian influenza
virus, and human coronaviruses. Curr. Opin. Infect. Dis.18:141–146.
11.Greenough, A.2002. Respiratory syncytial virus infection: clinical features,
management, and prophylaxis. Curr. Opin. Pulm. Med.8:214–217.
on May 16, 2020 by guest
http://jcm.asm.org/
12.Gro¨ndahl, B., W. Puppe, A. Hoppe, I. Ku¨hne, J. A. Weigl, and H. J. Schmitt.
1999. Rapid identification of nine microorganisms causing acute respiratory tract infections by single-tube multiplex reverse transcription-PCR:
feasibil-ity study. J. Clin. Microbiol.37:1–7.
13.Gruteke, P., A. S. Glas, M. Dierdorp, W. B. Vreede, J. Pilon, and S. M. Bruisten.2004. Practical implementation of a multiplex PCR for acute
respiratory tract infections in children. J. Clin. Microbiol.42:5596–5603.
14.Hamelin, M., and G. Boivin.2005. Human metapneumovirus: a ubiquitous
and long-standing respiratory pathogen. Pediatr. Infect. Dis. J. 24:S203–
S207.
15.Hamelin, M., Y. Abed, and G. Boivin.2004. Human metapneumovirus: a new
player among respiratory viruses. Clin. Infect. Dis.38:983–990.
16.Holland, C. A., and F. L. Kiechle.2005. Point-of-care molecular diagnostic
systems: past, present and future. Curr. Opin. Microbiol.8:504–509.
17.Kahn, J. S.2007. Newly discovered respiratory viruses: significance and
implications. Curr. Opin. Pharmacol.7:478–483.
18.Kelly, H., and C. Birch.2004. The causes and diagnosis of influenza-like
illness. Aust. Fam. Physician.33:305–309.
19.Kessler, N., O. Ferraris, K. Palmer, W. Marsh, and A. Steel.2004. Use of the DNA flow-thru chip, a three-dimensional biochip, for typing and subtyping
of influenza viruses. J. Clin. Microbiol.42:2173–2185.
20.Krunic, N., T. D. Yager, D. Himsworth, F. Merante, S. Yaghoubian, and R. Janeczko. 2007. xTAG RVP assay: analytical and clinical performance.
J. Clin. Virol.40(Suppl. 1):S39–S46.
21.Kuroiwa, Y., K. Nagai, L. Okita, S. Ukae, T. Mori, T. Hotsubo, and H. Tsutsumi.2004. Comparison of an immunochromatography test with mul-tiplex reverse transcription-PCR for rapid diagnosis of respiratory syncytial
virus infections. J. Clin. Microbiol.42:4812–4814.
22.Kuypers, J., N. Wright, J. Ferrenberg, M. Huang, A. Cent, L. Corey, and R. Morrow.2006. Comparison of real-time PCR assays with fluorescent-anti-body assays for diagnosis of respiratory virus infections in children. J. Clin.
Microbiol.44:2382–2388.
23.Li, H., M. A. McCormac, R. W. Estes, S. E. Sefers, R. K. Dare, J. D. Chappell, D. D. Erdman, P. F. Wright, and Y. W. Tang.2007. Simultaneous detection and high-throughput identification of a panel of RNA viruses
causing respiratory tract infections. J. Clin. Microbiol.45:2105–2109.
24.Lodes, M. J., D. Suciu, M. Elliott, A. G. Stover, M. Ross, M. Caraballo, K. Dix, J. Crye, R. J. Webby, W. J. Lyon, D. L. Danley, and A. McShea.2006.
Use of semiconductor-based oligonucleotide microarrays for influenza a
virus subtype identification and sequencing. J. Clin. Microbiol.44:1209–1218.
25.Mahony, J., S. Chong, F. Merante, S. Yaghoubian, T. Sinha, C. Lisle, and R. Janeczko.2007. Development of a respiratory virus panel test for detection of twenty human respiratory viruses by use of multiplex PCR and a fluid
microbead-based assay. J. Clin. Microbiol.45:2965–2970.
26.Merante, F., S. Yaghoubian, and R. Janeczko.2007. Principles of the xTAG
respiratory viral panel assay (RVP assay). J. Clin. Virol.40(Suppl. 1):S31–S35.
27.Nolte, F. S., D. J. Marshall, C. Rasberry, S. Schievelbein, G. G. Banks, G. A. Storch, M. Q. Arens, R. S. Buller, and J. R. Prudent.2007. MultiCode-PLx system for multiplexed detection of seventeen respiratory viruses. J. Clin.
Microbiol.45:2779–2786.
28.Perkins, S. M., D. L. Webb, S. A. Torrance, C. El Saleeby, L. M. Harrison, J. A. Aitken, A. Patel, and J. P. DeVincenzo.2005. Comparison of a real-time reverse transcriptase PCR assay and a culture technique for quantitative assessment of viral load in children naturally infected with respiratory
syn-cytial virus. J. Clin. Microbiol.43:2356–2362.
29.Smyth, R. L., and P. J. M. Openshaw.2006. Bronchiolitis. Lancet.368:312– 322.
30.Storch, G. A.2000. Diagnostic virology. Clin. Infect. Dis.31:739–751. 31.van de Pol, A. C., A. M. van Loon, T. F. W. Wolfs, N. J. G. Jansen, M.
Nijhuis, E. K. Breteler, R. Schuurman, and J. W. A. Rossen.2007. Increased detection of respiratory syncytial virus, influenza viruses, parainfluenza vi-ruses, and adenoviruses with real-time PCR in samples from patients with
respiratory symptoms. J. Clin. Microbiol.45:2260–2262.
32.Vega, R.2005. Rapid viral testing in the evaluation of the febrile infant and
child. Curr. Opin. Pediatr.17:363–367.
33.Vernet, G.2004. Molecular diagnostics in virology. J. Clin. Virol.31:239–247. 34.Wang, D., L. Coscoy, M. Zylberberg, P. C. Avila, H. A. Boushey, D. Ganem, and J. L. DeRisi.2002. Microarray-based detection and genotyping of viral
pathogens. Proc. Natl. Acad. Sci. USA99:15687–15692.
35.Weinberg, G. A., D. D. Erdman, K. M. Edwards, C. B. Hall, F. J. Walker, M. R. Griffin, and B. Schwartz.2004. Superiority of reverse-transcription polymerase chain reaction to conventional viral culture in the diagnosis of
acute respiratory tract infections in children. J. Infect. Dis.189:706–710.
36.Woo, P. C., S. S. Chiu, W. H. Seto, and M. Peiris.1997. Cost-effectiveness of rapid diagnosis of viral respiratory tract infections in pediatric patients.
J. Clin. Microbiol.35:1579–1581.
on May 16, 2020 by guest
http://jcm.asm.org/
0095-1137/10/$12.00 doi:10.1128/JCM.00255-10
Copyright © 2010, American Society for Microbiology. All Rights Reserved.
ERRATUM
Comparison of Automated Microarray Detection with Real-Time PCR Assays
for Detection of Respiratory Viruses in Specimens Obtained from Children
Fre
´de
´ric Raymond, Julie Carbonneau, Nancy Boucher, Lynda Robitaille, Se
´bastien Boisvert,
Whei-Kuo Wu, Gaston De Serres, Guy Boivin, and Jacques Corbeil
Infectious Disease Research Center of the CHUQ-CHUL and Laval University, Saint-Foy, Quebec, Canada; AutoGenomics, Inc., Carlsbad, California; and Institut National de Sante´ Publique du Que´bec, Quebec City, Quebec, Canada
Volume 47, no. 3, p. 743–750, 2009. Page 746, Table 1, “TaqMan sequence” column, rows for wells 7 and 8: “6FAM-CTAA CGAGTGTGCGCAAG-MGBNFQ” should read “6FAM-ACAATTACTGGAGTTGGC-MGBNFQ.”