Do
Staphylococcus epidermidis
Genetic Clusters Predict Isolation
Sources?
Isaiah Tolo,aJonathan C. Thomas,bRebecca S. B. Fischer,cEric L. Brown,cBarry M. Gray,dD. Ashley Robinsona
Department of Microbiology and Immunology, University of Mississippi Medical Center, Jackson, Mississippi, USAa; Department of Biology, University of Bolton, Bolton, United Kingdomb; Center for Infectious Disease, University of Texas Health Science Center, Houston, Texas, USAc; Department of Pediatrics, University of Illinois College of Medicine at Peoria, Peoria, Illinois, USAd
Staphylococcus epidermidis
is a ubiquitous colonizer of human skin and a common cause of medical device-associated
infec-tions. The extent to which the population genetic structure of
S. epidermidis
distinguishes commensal from pathogenic isolates
is unclear. Previously, Bayesian clustering of 437 multilocus sequence types (STs) in the international database revealed a
popu-lation structure of six genetic clusters (GCs) that may reflect the species’ ecology. Here, we first verified the presence of six GCs,
including two (GC3 and GC5) with significant admixture, in an updated database of 578 STs. Next, a single nucleotide
polymor-phism (SNP) assay was developed that accurately assigned 545 (94%) of 578 STs to GCs. Finally, the hypothesis that GCs could
distinguish isolation sources was tested by SNP typing and GC assignment of 154 isolates from hospital patients with bacteremia
and those with blood culture contaminants and from nonhospital carriage. GC5 was isolated almost exclusively from hospital
sources. GC1 and GC6 were isolated from all sources but were overrepresented in isolates from nonhospital and infection
sources, respectively. GC2, GC3, and GC4 were relatively rare in this collection. No association was detected between
fdh-posi-tive isolates (GC2 and GC4) and nonhospital sources. Using a machine learning algorithm, GCs predicted hospital and
nonhos-pital sources with 80% accuracy and predicted infection and contaminant sources with 45% accuracy, which was comparable to
the results seen with a combination of five genetic markers (icaA, IS256,
sesD
[bhp],
mecA, and arginine catabolic mobile element
[ACME]). Thus, analysis of population structure with subgenomic data shows the distinction of hospital and nonhospital
sources and the near-inseparability of sources within a hospital.
S
taphylococcus epidermidis
is a commensal of human skin and a
common contaminant of clinical specimens, but it is also an
important human pathogen (
1
,
2
). Currently, the
coagulase-neg-ative staphylococci (CoNS), of which
S. epidermidis
is the species
most commonly isolated from humans, ranks as the number one
cause of central line-associated bloodstream infections, the
sec-ond-most-common cause of surgical site infections, and the
third-most-common cause of all health care-associated infections
reported to the National Healthcare Safety Network from 2009 to
2010 (
3
,
4
). Uncertainty in the clinical interpretation of
S.
epider-midis
blood cultures can delay or misguide diagnosis and
treat-ment, increasing both morbidity and treatment costs (
5
,
6
). The
ideal of distinguishing “true” infection from specimen
contami-nation has not yet been realized, and even the strictest definitions
of
S. epidermidis
sepsis have been fraught with exceptions, false
positives, and examples of polyclonal infection (
7
,
8
).
The diagnosis of
S. epidermidis
infections could be aided by the
identification of markers that accurately distinguish between
in-fection and contaminant or commensal sources. Antimicrobial
resistance and biofilm phenotypes as well as the genetic markers
mecA
,
icaA
, and IS
256
have repeatedly been shown to be more
common in hospital isolates than in nonhospital isolates, but
these markers are not necessarily useful for distinguishing
infec-tion isolates from coresident hospital isolates that contaminate
clinical specimens (
9–13
). Such markers may promote a hospital
lifestyle and thus provide increased opportunities to cause
infec-tions. In contrast, the genetic markers
fdh
and arginine catabolic
mobile element (ACME) have been reported to be more common
in contaminant or commensal isolates than in true infection
iso-lates (
14–16
).
The search for markers of pathogenicity has extended to
stud-ies of
S. epidermidis
population genetic structure. Multilocus
se-quence typing (MLST) has identified clones such as sese-quence type
2 (ST2) that are common in hospitals (
15
,
17–24
). However, a
robust classification of
S. epidermidis
STs into larger groups of
related STs has been lacking (
25
). Recently, we used Bayesian
clus-tering of the MLST data in the international database to identify a
species-wide population structure of six genetic clusters (GCs)
that may relate to bacterial lifestyle (
26
). Analysis of isolates from
clinical specimens from a New York hospital showed that GC5 was
common and enriched for hospital-associated markers such as
antibiotic resistance, high biofilm production,
icaA
, IS
256
, and
sesD
(
bhp
), suggesting a lifestyle adapted to the hospital
environ-ment (
26
). GC1 and GC6 were also commonly isolated from
clin-ical specimens but were not associated with the tested markers
(except GC6 and
sesF
[
aap
]), suggesting a more generalist lifestyle.
GC2 was rare from clinical specimens and positive for the putative
commensal marker
fdh
. GC3 was also rarely isolated from clinical
specimens, and it was identified as a cluster with a significant
Received22 December 2015Returned for modification15 January 2016
Accepted7 April 2016
Accepted manuscript posted online13 April 2016
CitationTolo I, Thomas JC, Fischer RSB, Brown EL, Gray BM, Robinson DA. 2016. Do
Staphylococcus epidermidisgenetic clusters predict isolation sources? J Clin
Microbiol 54:1711–1719.doi:10.1128/JCM.03345-15.
Editor:K. C. Carroll, The Johns Hopkins University School of Medicine Address correspondence to D. Ashley Robinson, [email protected].
Supplemental material for this article may be found athttp://dx.doi.org/10.1128
/JCM.03345-15.
Copyright © 2016, American Society for Microbiology. All Rights Reserved.
on May 16, 2020 by guest
http://jcm.asm.org/
admixture of DNA from all other clusters (
26
). Results from a
recent genomic analysis of diverse
S. epidermidis
isolates were
con-sistent with this MLST classification; specifically, genomic group
A included MLST groups GC5, GC1, and GC6 and was separated
from genomic group B, which included MLST groups GC2 and
GC4 (
27
). Recombination was most extensive in genomic group
C, which included MLST group GC3 (
27
).
In this study, using a larger, updated MLST database, we
veri-fied that six GCs define the population genetic structure of
S.
epidermidis
. We developed a SNP assay for accurately assigning
isolates to GCs without the need for full MLST or genomic data.
To test the hypothesis that GCs could distinguish isolation
sources, we applied this system to three collections of
S.
epidermi-dis
isolates representing “true” bacteremia, blood isolates
consid-ered to be contaminants, and nonhospital carriage isolates. We
further characterized isolates for seven previously studied genetic
markers and developed a machine learning algorithm to predict
isolation sources with these data.
MATERIALS AND METHODS
Bacterial isolates.Isolates were collected at the OSF Saint Francis Medical Center in Peoria, Illinois, with the approval of the Peoria Institutional Review Board. Blood cultures were processed in the OSF System Labora-tory using a Bactec blood culture system (Becton Dickinson). Several typical colonies were picked for identification and sensitivity, done in a Vitek automated system (bioMérieux). The subcultures were then stored on slants. Isolates were recovered from slants in the Pediatric Research Laboratory, University of Illinois College of Medicine at Peoria, on tryp-tone soya 5% blood agar. Single representative colonies were picked by one physician-microbiologist (B. M. Gray). The predominant strain was selected by colony morphology from each of one to six separate blood cultures. Single-colony picks were also made for presumed contaminant strains.
The total of 154 isolates were derived from three sources.
(i) There were 59 isolates from 32 adult patients with “true” bactere-mia, as determined from two positive blood cultures obtained within 24 h, having similar colony morphologies, plus evidence of infection confirmed by chart review. Two exceptions were a patient who had a single blood culture associated with an infected vascular graft and another with an associated skin infection. The selection of patient strains was intended to provide a set of isolates with high specificity for infection (7,8). Samples from 17 of the infected patients also had 21 isolates deemed to be contam-inants from the same or separate blood cultures as the predominant in-fecting strain.
(ii) There were 55 isolates considered to be contaminants: the 21 con-taminant isolates from the infected patients just described and 34 isolates from 26 patients who had only a single positive blood culture and evidence against infection upon chart review. Results from these two sets of con-taminants were analyzed separately and together and were combined for the final analyses described below. All bacteremia and contaminant blood culture isolates were collected from March 2013 through February 2014; patients ranged in age from 19 to⬎80 years; 51% were male.
(iii) There were 40 isolates from 23 nonhospital subjects who were fathers visiting their infants in the neonatal intensive care unit during August 2009 through January 2010; cultures were obtained from all but three fathers within 1 week of admission of their infants, usually at their first visit. Cultures of anterior nares were obtained with Dacron swabs; cultures of both hands were obtained using a bag and buffer method.
Isolates were stored and shipped in Dorset egg medium without anti-biotics (28) to the University of Mississippi Medical Center. Isolates were coded, and genetic characterization was completed in a blind fashion. Isolates were cultured overnight at 37°C on tryptone soya agar or blood agar and were cryopreserved at⫺80°C in a solution of tryptic soy broth with 15% glycerol. DNA was extracted using a DNeasy blood and tissue kit
(Qiagen) according to the manufacturer’s instructions and using a solu-tion of 1.5% lysostaphin and lysozyme during the initial incubasolu-tion steps. Species identification of isolates was confirmed by sequencing both strands of atufgene fragment (29) and detecting⬎99% nucleotide iden-tity to a reference sequence fromS. epidermidisstrain ATCC 12228. Char-acteristics of all study isolates are given in Data Set S1 in the supplemental material.
Bayesian clustering of MLST data.The international multilocus se-quence typing (MLST) database forS. epidermidis(sepidermidis.mlst.net) consisted of 588 sequence types (STs) when downloaded on 4 September 2015. Ten STs with insertion-deletion polymorphism in thetpiAgene fragment were excluded, leaving 578 STs for analysis. STs were assigned to genetic clusters (GCs) using the Bayesian clustering program BAPS v6 (30) with previously described methods (31). In brief, MLST loci were oriented and trimmed to the⫹1 reading frame and clustered with the codon linkage model. Upper bounds of 11 to 20 populations were con-sidered, each evaluated five times. Admixture analysis based on mixture clustering of individuals used 100 iterations, 50 reference individuals per population, and 10 iterations per reference individual.
Identification of SNPs that distinguish genetic clusters.Seven single nucleotide polymorphisms (SNPs), comprising one SNP from each of the seven MLST gene fragments, were selected from the 578 STs to maximally differentiate GCs. SNP selection was guided by the GSTstatistic, which estimates the proportion of the between-GC diversity in the total diver-sity. GSTwas calculated using DnaSP v5.10 software (32).
Assignment of SNP types to genetic clusters.SNP types were assigned to GCs using an approach inspired by earlier studies that used multilocus data for probabilistic assignment of individuals to populations (33). First, a reference table was constructed by calculating the frequency of each allele for each of the seven SNPs for each GC, using data from the 578 STs (see Table S1 in the supplemental material). Next, a likelihood score for assigning each SNP type to each GC was calculated as⌸pi2, wherepiis the frequency of the allele of SNPiin a given GC. Zero-frequency alleles were recorded as 1/(n⫹1), where nis the number of STs in the GC; this treatment assumes that zero-frequency alleles are rare and would be found with additional sampling. Finally, a given SNP type was assigned to the GC with the highest likelihood score if the log of the ratio of the highest likelihood score to the next highest was⬎1.3, indicating⬎95% confi-dence in the assignment.
SNP assay.PCR amplification of the MLST loci used the standard primers and thermocycler conditions described previously (34), with the exception that an annealing temperature of 50°C was used for some am-plifications ofgtrandpyrRloci. PCR products were combined to reach a total volume of 10l for each of two subsequent, allele-specific primer extension (ASPE) reaction mixtures containing PCR products fromarcC, aroE,tpiA, andyqiL(reaction 1) and fromgtr,mutS, andpyrR(reaction 2). The two reaction mixtures were purified of residual deoxynucleoside triphosphates (dNTPs) by addition of 1l of 5 U of exonuclease I (EXO) and 0.5 U of shrimp alkaline phosphatase (SAP) (Invitrogen) and incu-bation at 37°C for 30 min and 80°C for 15 min.
Fourteen ASPE primers were designed to detect the alleles of the seven selected SNPs (described in Results). Each of the two ASPE reaction mix-tures contained 5l of the EXO-SAP-treated PCR products, 0.3 U of tsp DNA polymerase (Invitrogen), 25 nM ASPE primer mixture, 5M dATP, dTTP, dGTP, and biotin-dCTP (Invitrogen), 20 mM Tris-HCl, 50 mM KCl, and 1.25 mM MgCl2. The ASPE thermocycler conditions were 1 cycle of 95°C for 5 min and then 30 cycles of 94°C for 30 s, 55°C for 30 s, and 72°C for 1 min, with a final extension of 72°C for 3 min. The manufactur-er’s protocol (Luminex) was followed for hybridization of ASPE products to xTAG microspheres and washing, except that the concentrations of microspheres were increased to 125 perl, followed by incubation in 50
l 1⫻Tm hybridization buffer with 0.2% streptavidin R–phycoerythrin conjugate at 37°C for 15 min.
Samples were analyzed on a Luminex 200 system (Millipore) using Luminex Xponent v3.1 software. Results were expressed as median
on May 16, 2020 by guest
http://jcm.asm.org/
fluorescence intensity (MFI) for each allele. The MFI values were cor-rected for background by subtracting the value of the MFI of unreacted bead controls from the test MFI value. An allele was scored with a minimum threshold of⬎150 MFI and a proportion of MFIcalled allele/ (MFIwild type allele⫹MFImutant type allele) of⬎0.9.
Detection of various genetic markers.Isolates were screened by PCR for the presence of seven genetic markers previously studied for their associations with GCs (26). These included the putative hospital markers icaA, IS256,mecA,sesD(bhp), andsesF(aap) and the putative commensal markersfdhand arginine catabolic mobile element (ACME). PCR primer sequences for these markers were listed previously (26), and thermocycler conditions were the same as those used for MLST (34).
Statistical analyses.Bivariate associations were measured with odds ratios and 95% confidence intervals (CIs), using InStat v3.1 software (GraphPad). In cases where 2-by-2 contingency tables had zero-frequency cells, 0.5 was automatically added to each cell. The diversity of SNP types within GCs was measured by Simpson’s index (35) using the Comparing Partitions website (http://www.comparingpartitions.info/), with 95% CIs calculated as described previously (36).
Machine learning algorithm for prediction of isolation sources. Support vector machines (SVMs) represent a type of supervised machine learning algorithm that can perform classification (37). In essence, SVMs first transform the predictor data (in this study, binary-coded GCs and genetic markers) into a higher-dimensional space by use of a kernel func-tion and then find a hyperplane that maximally separates the classes. Two-class prediction was done to distinguish hospital from nonhospital sources and, separately, infection from contaminant sources. SVMs were run with the e1071 v1.6-4 package of R v2.7.0 software (38). SVMs used a radial kernel and two parameters, C (cost of errors) and␥(kernel spe-cific). Optimal values of C and␥were determined from a grid of values, using 10-fold cross-validation with a random 70% of the sample. The SVMs were trained with the same random 70% of the sample as used for cross-validation and were tested with the remaining 30% of the sample. This entire procedure was repeated 10 times, where each replicate repre-sented a random 70:30 partition of the sample. Classification accuracy, sensitivity, and specificity were averaged across the 10 replicates. SVMs were rerun using “clone-corrected” samples, which excluded duplicate isolates of the same SNP type and source from the same patient. This clone-corrected sample totaled 119 isolates: 39 isolates from hospital in-fections, 47 contaminants of clinical specimens, and 33 nonhospital car-riage isolates.
RESULTS
Verification of the population genetic structure of
S.
epidermi-dis.
Bayesian clustering of 578 STs in the international MLST
da-tabase identified six GCs (
Fig. 1
). A total of 419 (96%) of 437 STs
previously analyzed by Thomas et al. (
26
) were classified into the
same GCs with the updated database (see Table S2 in the
supple-mental material). All of the 18 STs that were reclassified involved
GC3 (16 changed to GC3, 2 changed from GC3). Both GC3 and
GC5 were significantly enriched for admixed STs and had the
highest proportions of admixed nucleotides (
Table 1
). Both GC1
and GC6 were significantly underrepresented for admixed STs
and had the lowest proportions of admixed nucleotides. Thus, the
population structure of
S. epidermidis
, as inferred from Bayesian
clustering of the MLST database, was relatively consistent when
the sample of 437 STs was increased to 578 STs.
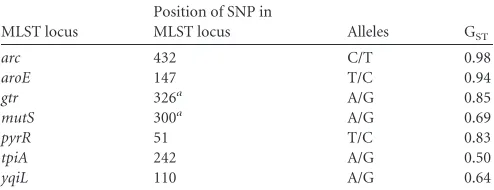
Development, validation, and application of a SNP typing
assay to assign isolates to GCs.
One SNP from each of the seven
MLST loci was selected to maximally differentiate GCs, as guided
by the G
STstatistic (
Table 2
). These seven SNPs produced 54 SNP
types among the 578 STs (see Table S2 in the supplemental
mate-rial). The accuracy of assigning these SNP types to the same GCs as
found with full MLST data was determined
in silico
using the
approach described in Materials and Methods. The SNP types for
545 (94%) of 578 STs were correctly assigned to GCs with
confi-dence. Of the remaining 33 STs, the SNP types for 6 STs were
incorrectly assigned to GCs with confidence, and the SNP types
for 27 STs were unassigned because the threshold for confidence
was not met (see Table S2 in the supplemental material). SNP type
3 (CTAATAA) was represented by 143 STs, including 3 (ST145,
ST161, and ST164) of the 6 STs that would be incorrectly assigned
to GCs with confidence. However, the presence of the
arcC8
allele
[image:3.585.60.265.65.220.2]FIG 1Assignment of 578 sequence types (STs) in the multilocus sequence typing (MLST) database to six genetic clusters (GCs). Thexaxis corresponds to all 578 STs in the MLST database, color coded by GC as follows: red, GC1; green, GC2; blue, GC3; orange, GC4; pink, GC5; teal, GC6. Theyaxis indicates the percentage of ancestry contributed to the ST by each GC.
TABLE 1Summary of BAPS admixture analysis of 578S. epidermidis sequence types
GC
Total no. of STs
No. (%) of significantly admixed STs
Odds ratio (95% CI)a
Proportion of admixed nucleotides
1 142 5 (4) 0.17 (0.07, 0.44) ⬍0.01
2 61 10 (16) 1.23 (0.60, 2.54) 0.04
3 49 21 (43) 5.86 (3.13, 10.97) 0.33
4 91 15 (16) 1.26 (0.68, 2.32) 0.05
5 71 21 (30) 3.13 (1.76, 5.57) 0.09
6 164 9 (5) 0.28 (0.13, 0.57) 0.02
a
Statistically significant values are highlighted in boldface.
TABLE 2Single nucleotide polymorphisms used to assignS. epidermidis isolates to genetic clusters
MLST locus
Position of SNP in
MLST locus Alleles GST
arc 432 C/T 0.98
aroE 147 T/C 0.94
gtr 326a A/G 0.85
mutS 300a A/G 0.69
pyrR 51 T/C 0.83
tpiA 242 A/G 0.50
yqiL 110 A/G 0.64
a
The locus has been reverse complemented from that in theS. epidermidisMLST database.
on May 16, 2020 by guest
http://jcm.asm.org/
[image:3.585.298.545.87.185.2] [image:3.585.298.545.610.705.2]can be used to identify SNP type 3 isolates that are classified
among these problematic STs.
Allele-specific primer extension primers were designed to
de-tect the alleles of the seven SNPs (
Table 3
) with Luminex
technol-ogy. This SNP assay was technically validated using 30 strains of
known, diverse STs. Each of these strains’ alleles matched the
ex-pected result, with a mean fluorescence intensity of
⬎
150 and an
allele proportion of
⬎
0.90 (see Table S3 in the supplemental
ma-terial). Application of the SNP typing assay to our study sample of
154 isolates resulted in confident assignment of each of 14 SNP
types to a GC (
Table 4
). SNP type 3 was the most frequent SNP
type, with 62 isolates; sequencing of the
arcC
gene fragment from
these isolates showed that none had the
arcC8
allele and thus did
not belong to the problematic STs. Although GC2, GC3, and GC4
were relatively rare in this sample, they tended to be more diverse
in SNP type than GC1, GC5, and GC6, but this result was not
statistically significant (
Table 4
).
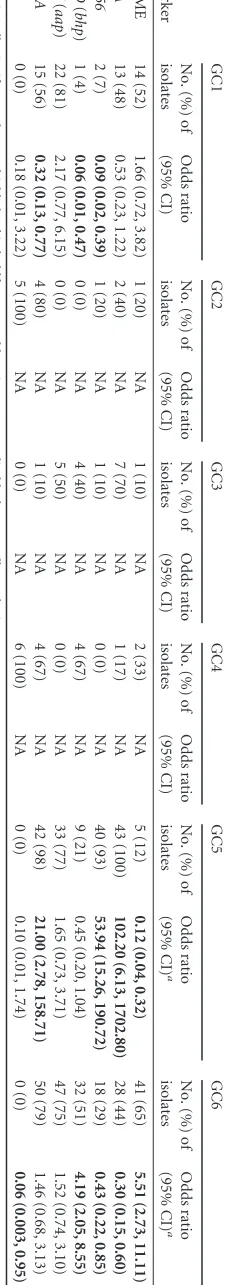
Associations between GCs, genetic markers, and isolation
sources.
PCR was used to detect seven genetic markers that had
been studied previously for their associations with GCs (
26
). GC5
was positively associated with
icaA
, IS
256
, and
mecA
(
Table 5
).
GC6 was positively associated with ACME and
sesD
(
bhp
). The
fdh
gene was detected exclusively within GC2 and GC4 (
Table 5
).
While there is a large literature on the associations between
some genetic markers and isolation sources, the associations
be-tween GCs and isolation sources have not been measured
previ-ously. Results in
Table 6
contrast hospital with nonhospital
sources and further subdivide hospital sources to contrast
infec-tion with contaminant sources. GC5, GC6,
icaA
, IS
256
,
sesD
(
bhp
), and
mecA
were associated with hospital sources (
Table 6
).
GC1 and ACME were associated with nonhospital sources. There
was no evidence of an association between GC2, GC4, and
fdh
and
nonhospital sources (
Table 6
). In contrast, GC6 and
mecA
were
associated with an infection source, and no characteristic was
as-sociated with contaminant sources.
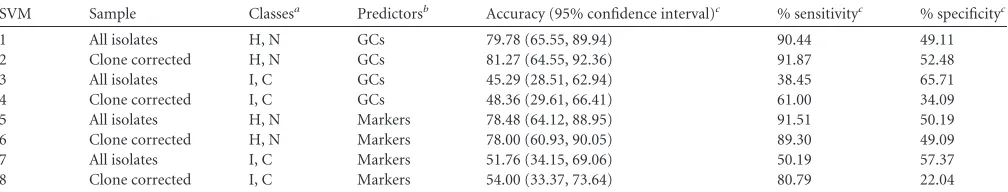
Prediction of isolation sources with GCs and genetic
mark-ers.
Support vector machines (SVMs) were used to predict
isola-tion sources with all six GCs and the five genetic markers that were
associated with isolation sources in bivariate analyses.
Perfor-mance measures were averaged over 10 replicates of
cross-validat-ing parameters, traincross-validat-ing, and testcross-validat-ing of SVMs with random 70:30
partitions of the sample as described in Materials and Methods.
GCs predicted hospital and nonhospital sources with an accuracy
of 80%, and the prediction of a hospital source when the isolate
was from the hospital was much better (90% sensitivity) than the
prediction of a nonhospital source when the isolate was from
non-hospital carriage (49% specificity) (
Table 7
). Genetic markers
pre-dicted hospital and nonhospital sources with an accuracy of 78%,
which was indistinguishable from the accuracy achieved with
GCs, considering the broad confidence intervals. As with the
ac-curacy achieved with GCs, the acac-curacy achieved with the markers
was mostly due to the ability to distinguish the hospital sources
(92% sensitivity, 50% specificity). In contrast, neither GCs nor
markers performed well in analyses predicting infection and
con-TABLE 3Allele-specific primer extension (ASPE) primers
Primer name MLST locus Primer sequence (5=–3=)a xTag IDb
Multiplexed ASPE reaction
ASPE_SNP432_35W arcC CATCTTCATATCAATTCTCTTATTAATAAAGGAGATGGCAGATTCG 35 1
ASPE_SNP432_15 M arcC TACTTCTTTACTACAATTTACAACAATAAAGGAGATGGCAGATTCA 15 1
ASPE_SNP147_12W aroE CATAATCAATTTCAACTTTCTACTTTTATATAATTCAATTGCTATA 12 1
ASPE_SNP147_13 M aroE CAAATACATAATCTTACATTCACTTTTATATAATTCAATTGCTATG 13 1
ASPE_SNP326_35W gtr CATCTTCATATCAATTCTCTTATTTTGCCCACCTGATAAACGATGT 35 2
ASPE_SNP326_15 M gtr TACTTCTTTACTACAAATTACAACTTGCCCACCTGATAAAGCATGC 15 2
ASPE_SNP300_12W mutS CATAATCAATTTCAACTTTCTACTTTTTTCTTTTCATCCATACCAT 12 2
ASPE_SNP300_13 M mutS CAAATACATAATCTTACATTCACTTTTTTCTTTTCATCCATACCAC 13 2
ASPE_SNP51_42W pyrR CACTACACATTTATCATAACAAATGCCTAATAGAACTAAATCTTTA 42 2
ASPE_SNP51_43 M pyrR AACTTTCTCTCTCTATTCTTATTTGCCTAATAGAACTAAATCTTTG 43 2
ASPE_SNP242_42W tpiA CACTACACATTTATCATAACAAATTCACTTGATTACCTACGATTTT 42 1
ASPE_SNP242-43 M tpiA AACTTTCTCTCTCTATTCTTATTTTCACTTGATTACCTACGATTTC 43 1
ASPE_SNP110_55W yqiL ACATCAAATTCTTTCAATATCTTCTTGTCCTTGACCTGCCTGTAAT 55 1
ASPE_SNP110_56 M yqiL CTTAAACTCTACTTACTTCTAAATTTGTCCTTGACCTGCCTGTAAC 56 1
aSequences complementary to the xTags and target alleles are underlined and in boldface, respectively. b
ID, identifier.
TABLE 4Diversity of the sixS. epidermidisgenetic clusters in the Illinois population
GC
No. of isolates
Simpson’s index of diversity (95% CI)
SNP type (no. of isolates)
Alleles at 7 MLST loci
1 27 0.15 (0.00–0.32) 1 (25) CTGATAA
9 (1) CTGGTAA
17 (1) CTGATGA
2 5 0.40 (0.00–0.83) 10 (1) TTAGCAG
5 (4) TTAGCGG
3 10 0.36 (0.05–0.66) 7 (8) CTAACGA
4 (2) CTAACAA
4 6 0.33 (0.00–0.74) 6 (5) TCAGCGG
29 (1) TCAACGA
5 43 0.18 (0.03–0.33) 2 (39) TTGATAA
8 (3) TTGACAA
16 (1) TTAATAA
6 63 0.03 (0.00–0.09) 3 (62) CTAATAA
35 (1) CTAGTAA
on May 16, 2020 by guest
http://jcm.asm.org/
taminant sources; the accuracy was
⬍
53% for both predictors
(
Table 7
). Clone-corrected samples had similar levels of accuracy
with broader confidence intervals than the samples that included
all isolates, but they had larger differences in sensitivity and
spec-ificity in analyses predicting infection versus contaminant sources
(
Table 7
). As noted previously, only two characteristics were
asso-ciated with infection source (GC6 and
mecA
;
Table 6
) and no
characteristic was associated with contaminant source. The SVMs
performed poorly under these conditions and appear to have
sometimes overfitted the training data (i.e., the SVMs picked the
predominant class from the training set).
Post hoc
analysis of isolation sources.
Although isolation
sources were not defined using genetic information, it might be
instructive to reevaluate sources in light of this added
informa-tion. In particular, we expect multiple infection isolates from the
same patient to often be indistinguishable genetically, allowing for
some intrahost evolution of the bacteria. For 20 (83%) of 24
pa-tients with multiple infection isolates, all infection isolates from a
given patient matched by GC, and for 13 (54%) of 24 patients, all
infection isolates from a given patient were found to match by the
five genetic markers. Note, however, that the markers include
sev-eral mobile genetic elements and are not intended for strain
iden-tification. On the other hand, among the 17 patients who were
deemed to have both infection and contaminant isolates, we
ex-pect the isolates from these different sources to often differ
genet-ically. All contaminant isolates were different from all infection
isolates from a given patient in only 4 (24%) of 17 patients in
analyses considering GCs and 7 of 17 (41%) patients in analyses
considering markers.
These results suggest that our sampling procedures adequately
captured true infection isolates, but they also suggest that
distin-guishing contaminants from infection isolates from the same
patient on the basis of colony morphology, as is common
prac-tice in some hospital laboratories, may not be ideal. To
deter-mine the impact of some potentially misclassified contaminant
isolates on our analysis, we reran the SVMs after removing all
21 contaminant isolates from infected patients, leaving the 34
unambiguous contaminant isolates from patients with single
blood cultures and evidence against infection upon chart
re-view. While the results of analysis of the ability to distinguish
hospital from nonhospital sources were very similar to those of
the previous analysis (77% and 78% accuracy by GCs and
markers, respectively), there was a 12% to 16% increase in
accuracy in distinguishing infection from contaminant sources
in comparison to the previous analysis (61% and 64% accuracy
by GCs and markers, respectively).
DISCUSSION
In pioneering work on the population genetic structure of
S.
epi-dermidis
, MLST data were analyzed using the eBURST algorithm
and most STs were classified into one clonal complex (
22
).
Sub-sequent studies reported some instabilities in this classification
scheme as the MLST database grew from 74 STs to 211 STs (
25
).
With other species of recombining bacteria, Bayesian
cluster-ing tools that model genetic admixture have helped to define
population structure (
39
,
40
). Recently, we used a Bayesian
clustering approach with
S. epidermidis
MLST data, including
all 437 STs in the international database, and identified six
genetic clusters (GCs) (
26
). Here, we confirmed the presence of
these six GCs in an updated database of 578 STs. A total of 96%
TABLE 5 Associations of genetic clusters with selected genetic markers a Marker GC1 GC2 GC3 GC4 GC5 GC6 No. (%) of isolates Odds ratio (95% CI) No. (%) of isolates Odds ratio (95% CI) No. (%) of isolates Odds ratio (95% CI) No. (%) of isolates Odds ratio (95% CI) No. (%) of isolates Odds ratio (95% CI) a No. (%) of isolates Odds ratio (95% CI) a ACME 14 (52) 1.66 (0.72, 3.82) 1 (20) NA 1 (10) NA 2 (33) NA 5 (12) 0.12 (0.04, 0.32) 41 (65) 5.51 (2.73, 11.11) icaA 13 (48) 0.53 (0.23, 1.22) 2 (40) NA 7 (70) NA 1 (17) NA 43 (100) 102.20 (6.13, 1702.80) 28 (44) 0.30 (0.15, 0.60) IS 256 2 (7) 0.09 (0.02, 0.39) 1 (20) NA 1 (10) NA 0 (0) NA 40 (93) 53.94 (15.26, 190.72) 18 (29) 0.43 (0.22, 0.85) sesD ( bhp ) 1 (4) 0.06 (0.01, 0.47) 0 (0) NA 4 (40) NA 4 (67) NA 9 (21) 0.45 (0.20, 1.04) 32 (51) 4.19 (2.05, 8.55) sesF ( aap ) 22 (81) 2.17 (0.77, 6.15) 0 (0) NA 5 (50) NA 0 (0) NA 33 (77) 1.65 (0.73, 3.71) 47 (75) 1.52 (0.74, 3.10) mecA 15 (56) 0.32 (0.13, 0.77) 4 (80) NA 1 (10) NA 4 (67) NA 42 (98) 21.00 (2.78, 158.71) 50 (79) 1.46 (0.68, 3.13) fdh 0 (0) 0.18 (0.01, 3.22) 5 (100) NA 0 (0) NA 6 (100) NA 0 (0) 0.10 (0.01, 1.74) 0 (0) 0.06 (0.003, 0.95) a Statistically significant values are highlighted in boldface. NA, odds ratio was not applicable due to small sample size.
on May 16, 2020 by guest
http://jcm.asm.org/
[image:5.585.103.218.80.724.2]of previously studied STs were classified into the same GCs
with the enlarged database, and all differently classified STs
involved the recombinant GC3.
In a clinical setting, collecting and analyzing MLST data may
not be practical, but it is not a stretch to consider implementing
SNP typing and analysis using various multiplex platforms
al-ready operational in many laboratories (
41
). Diverse sets of
SNPs have been used in several studies for typing staphylococci
(
42–44
). Here, we used the G
STstatistic to select those SNPs
from MLST data that best distinguish the six GCs. The seven
selected SNPs correctly and confidently assigned 94% of the
578 STs to their GC, which indicates that small sets of SNPs can
provide a reliable foundation for a rapid assay of
S. epidermidis
genetic background.
Previous work indicated that
S. epidermidis
GCs may reflect the
species’ ecology to some extent (
26
). Specifically, associations
were found between GCs and genetic markers of isolation sources
in clinical specimens from New York, but that study did not
at-tempt to distinguish infection from contaminant isolates and it
did not include nonhospital carriage isolates (
26
). Here, study of
isolates from both clinical and nonclinical samples from Illinois
replicated several of the previously observed GC-marker
associa-tions and allowed associaassocia-tions between GCs and isolation sources
to be measured for the first time. GC5 was confirmed to be
asso-ciated with
icaA
, IS
256
, and
mecA
, and all isolates but one were
from a hospital source, supporting the notion that this cluster is a
hospital specialist. On the other hand, GC1 and GC6 did not have
consistent associations with genetic markers across studies, and
they differed from each other in their associations with isolation
sources. Studies of isolates from other geographic areas are needed
to assess whether GC1 and GC6 exhibit wide variation in their
marker profiles and isolation sources, as might be expected of
generalists.
[image:6.585.40.546.78.269.2]Hospital-associated populations have been identified in other
bacterial species that are opportunistic pathogens. Willems et al.
(
40
) identified three hospital-associated populations of
Enterococ-cus faecium
using Bayesian clustering of MLST data, which
subdi-vided the CC17 group previously defined by eBURST analysis of
MLST data. Each of the three populations was significantly
under-represented for admixed STs (
40
); however, subsequent analysis
of genome sequences from representatives of these populations
identified an important role for recombination in generating their
diversity (
45
). By comparison, the MLST data for
S. epidermidis
suggest relatively more recombination in hospital-associated GC5
and less recombination in hospital-associated GC6, whereas a
subsequent genomic analysis that placed GC5 and GC6 together
in a group with GC1 showed recombination in all three of these
backgrounds (
27
). These results indicate that hospital-associated
TABLE 6Associations of genetic clusters and selected genetic markers with isolation sourcesa Characteristic or
marker
No. (%) of isolates
Odds ratio (95% CI)
No. (%) of isolates
Odds ratio (95% CI)a
Hospital Carriage Infection Contaminant
GC
1 9 (33) 18 (67) 0.10 (0.04, 0.26) 5 (56) 4 (44) 1.18 (0.30, 4.64)
2 3 (60) 2 (40) NA 1 (33) 2 (67) NA
3 3 (30) 7 (70) NA 1 (33) 2 (67) NA
4 5 (83) 1 (17) NA 2 (40) 3 (60) NA
5 42 (98) 1 (2) 22.75 (3.01, 171.77) 17 (40) 25 (60) 0.49 (0.22, 1.05)
6 52 (83) 11 (17) 2.21 (1.01, 4.85) 33 (63) 19 (37) 2.41 (1.13, 5.13)
Marker
icaA 80 (70) 14 (35) 4.37 (2.04, 9.38) 39 (66) 41 (75) 0.67 (0.30, 1.50)
IS256 62 (54) 0 (0) 96.43 (5.79, 1607.40) 29 (49) 33 (60) 0.64 (0.31, 1.36)
sesD(bhp) 45 (39) 5 (13) 4.57 (1.66, 12.53) 24 (41) 21 (38) 1.11 (0.52, 2.36)
sesF(aap) 81 (71) 26 (65) 1.32 (0.61, 2.84) 45 (76) 36 (65) 1.70 (0.75, 3.84)
mecA 103 (90) 13 (33) 19.45 (7.84, 48.22) 57 (97) 46 (84) 5.58 (1.15, 27.10)
ACME 41 (36) 23 (58) 0.42 (0.20, 0.87) 24 (41) 17 (31) 1.53 (0.71, 3.32)
fdh 8 (7) 3 (8) 0.93 (0.23, 3.70) 3 (5) 5 (9) 0.54 (0.12, 2.36)
a
Statistically significant values are highlighted in boldface. NA, odds ratio was not applicable due to small sample size.
TABLE 7Performance of genetic clusters and selected genetic markers in predicting isolation source with SVMs
SVM Sample Classesa Predictorsb Accuracy (95% confidence interval)c % sensitivityc % specificityc
1 All isolates H, N GCs 79.78 (65.55, 89.94) 90.44 49.11
2 Clone corrected H, N GCs 81.27 (64.55, 92.36) 91.87 52.48
3 All isolates I, C GCs 45.29 (28.51, 62.94) 38.45 65.71
4 Clone corrected I, C GCs 48.36 (29.61, 66.41) 61.00 34.09
5 All isolates H, N Markers 78.48 (64.12, 88.95) 91.51 50.19
6 Clone corrected H, N Markers 78.00 (60.93, 90.05) 89.30 49.09
7 All isolates I, C Markers 51.76 (34.15, 69.06) 50.19 57.37
8 Clone corrected I, C Markers 54.00 (33.37, 73.64) 80.79 22.04
aTwo-class predictions of whether isolates are from hospital (H) or nonhospital carriage (N) sources or from infection (I) or contaminant (C) sources. b
Predictors are either genetic clusters (GC) or the presence/absence profiles of the genetic markers ACME,icaA, IS256,sesD(bhp), andmecA.
cValues are the averages of results across 10 replicates as described in Materials and Methods. The scale is 0% to 100%.
on May 16, 2020 by guest
http://jcm.asm.org/
[image:6.585.41.545.600.696.2]populations of
S. epidermidis
may not be isolated from
recombi-nation with nonhospital populations as has been proposed for
E.
faecium
.
GC3 was confirmed to be a highly recombinant genetic cluster
of
S. epidermidis
. The previous analysis of the MLST database of
437 STs (
26
) and the current analysis of the larger database of 578
STs both showed that GC3 has a higher proportion of admixed
STs and a higher proportion of admixed nucleotides than other
GCs. These results are consistent with the genomic analysis
re-ported by Méric et al. (
27
), which showed GC3 isolates to be the
most recombinant. The genetic and/or ecological basis for
recom-binant character of GC3 and its role in the diversification of
S.
epidermidis
populations require further study.
GC2 and GC4 were the sole backgrounds for the
fdh
gene, and
all isolates belonging to these two GCs were positive for
fdh
. This
gene was proposed by Conlan et al. (
14
) as a marker for
commen-sal isolates. Here, the GC2 and GC4 isolates were relatively rare
overall, but they were not overrepresented by nonhospital carriage
isolates. Our data suggest that
fdh
is a marker of these particular
GCs rather than a marker of a commensal lifestyle. Despite their
rarity in the sample, GC2, GC3, and GC4 tended to be more
diverse in SNP types than GC1, GC5, and GC6. Of note, SNP
types extracted from draft genome sequences of
S. epidermidis
from wild mouse species (
46
) as well as from an unusual
enter-otoxin-producing human clinical isolate (
47
) can be reliably
classified into GC4 (I. E. Tolo and D. A. Robinson, unpublished
data). Together, these observations may indicate that some of
these rare GCs represent a large, scantly sampled population
with an ecological niche that is broader than that of the skin of
healthy humans.
The goal of this study was to test the hypothesis that GCs could
distinguish isolation sources. Using a supervised machine
learn-ing algorithm, no significant differences were observed in the
ac-curacy of predicting isolation sources with either GCs or a set of
five genetic markers that might more directly relate to
pathoge-nicity. While both GCs and markers predicted hospital and
nonhospital sources with about 80% accuracy, they predicted
infection and contaminant sources within the hospital only
about half the time. These results indicate that hospital and
nonhospital sources are better distinguished than are different
populations within hospitals. Infection isolates might be
se-lected at random from a population that has evolved fitness for
hospital settings.
Our study had some limitations. One potential source of error,
evaluated in the
post hoc
analysis of sources, comes from the
selec-tion of contaminant isolates from infected patients using colony
morphology as the discriminator. Even though this reflects a “real
world” approach to identifying contaminants in some hospital
laboratories, these potential misclassifications of source make
the infection and contaminant sources appear to be more
sim-ilar to each other. Here, isolate selection attempted to
mini-mize false positives with respect to infection, and very few of
the multiple infection isolates may have been inadvertent
con-taminants. Thus, while blood culturing and sepsis diagnosis
remain complex processes, involving blood sampling
tech-niques, laboratory procedures, and clinical assessments (
8
,
48
),
SNP-based characterization of two or more isolates from the
same patient may aid in diagnosing “true” infection in some
individual patients.
The use of relatively small sample sizes of the different
sources was another limitation of our study that resulted in
broad confidence intervals for accuracy and some overfitting of
the training data in analyzing subsets of the sample. Sharma et
al. (
23
) used SVMs directly with
S. epidermidis
MLST data and
reported a slightly lower prediction accuracy (73%) that was
partially attributed to the small sample size of 100 isolates and
the high diversity of STs. Here, using a sample size of 154
isolates, clustering of isolates into GCs, and two-class
predic-tion with cross-validated SVM parameter values, it was
possi-ble to achieve slightly higher, but still generalizapossi-ble, prediction
accuracy. However, we anticipate that the greatest gains in
pre-dicting the sources of
S. epidermidis
isolates solely from
bacte-rial characteristics will come from studying well-sampled
ge-nome sequences for informative polymorphisms, which might
be exploited for diagnostic assays using an approach similar to
that outlined in this report.
FUNDING INFORMATION
This work, including the efforts of D. Ashley Robinson, was funded by HHS | NIH | National Institute of General Medical Sciences (NIGMS) (GM080602).
REFERENCES
1.Grice EA, Kong HH, Conlan S, Deming CB, Davis J, Young AC, Comparative Sequencing Program NISC, Bouffard GG, Blakesley RW, Murray PR, Green ED, Turner ML, Serge JA.2009. Topographical and temporal diversity of the human skin microbiome. Science324:1190 – 1192.http://dx.doi.org/10.1126/science.1171700.
2.Rupp ME.2014. Clinical characteristics of infections in humans due to Staphylococcus epidermidis, p 1–16.InFey PD (ed),Staphylococcus epider-midismethods and protocols. Springer, New York, NY.
3.Rogers KL, Fey PD, Rupp ME.2009. Epidemiology of infections due to coagulase-negative staphylococci, p 310 –332.InCrossley KB (ed), The staphylococci in human disease, 2nd ed. Blackwell Publishing, Oxford, United Kingdom.
4.Sievert DM, Ricks P, Edwards JR, Schneider A, Patel J, Srinivasan A, Kallen A, Limbago B, Fridkin S; National Healthcare Safety Network (NHSN) Team and Participating NHSN Facilities.2013. Antimicrobial-resistant pathogens associated with healthcare-associated infections: sum-mary of data reported to the National Healthcare Safety Network at the Centers for Disease Control and Prevention, 2009 –2010. Infect Control Hosp Epidemiol34:1–14.http://dx.doi.org/10.1086/668770.
5.Blot SI, Depuydt P, Annemans L, Benoit D, Hoste E, De Waele JJ, Decruyanaere J, Vogelaers D, Colardyn F, Vandewoude KH. 2005. Clinical and economic outcomes in critically ill patients with nosocomial catheter-related bloodstream infections. Clin Infect Dis41:1591–1598. http://dx.doi.org/10.1086/497833.
6.Rello J, Ochagavia A, Sabanes E, Roque M, Mariscal D, Reynaga E, Valles J. 2000. Evaluation of outcome of intravenous catheter-related infections in critically ill patients. Am J Respir Crit Care Med162(Pt 1):
1027–1030.http://dx.doi.org/10.1164/ajrccm.162.3.9911093.
7.Sharma M, Riederer K, Johnson LB, Khatib R.2001. Molecular analysis of coagulase-negativeStaphylococcusisolates from blood cultures: preva-lence of genotypic variation and polyclonal bacteremia. Clin Infect Dis
33:1317–1323.http://dx.doi.org/10.1086/322673.
8.Beekmann SE, Diekema DJ, Doern GV.2005. Determining the clinical significance of coagulase-negative staphylococci isolated from blood cul-tures. Infect Control Hosp Epidemiol26:559 –566.http://dx.doi.org/10 .1086/502584.
9.Frebourg NB, Lefebvre S, Baert S, Lemeland JF.2000. PCR-based assay for discrimination between invasive and contaminatingStaphylococcus epidermidisstrains. J Clin Microbiol38:877– 880.
10. Kozitskaya S, Cho SH, Dietrich K, Marre R, Naber K, Ziebuhr W.2004. The bacterial insertion sequence element IS256occurs preferentially in nosocomialStaphylococcus epidermidisisolates: association with biofilm formation and resistance to aminoglycosides. Infect Immun72:1210 – 1215.http://dx.doi.org/10.1128/IAI.72.2.1210-1215.2004.
11. Mekni MA, Bouchami O, Achour W, Ben Hassen A. 2012. Strong
on May 16, 2020 by guest
http://jcm.asm.org/
biofilm production but not adhesion virulence factors can discrimi-nate between invasive and commensal Staphylococcus epidermidis strains. APMIS120:605– 611.http://dx.doi.org/10.1111/j.1600-0463.2012 .02877.x.
12. Rohd H, Kalitzky M, Kröger N, Scherpe S, Horstkotte MA, Knobloch JK, Zander AR, Mack D.2004. Detection of virulence–associated genes not useful for discriminating between invasive and commensal Staphylo-coccus epidermidisstrains from a bone marrow transplant unit. J Clin Microbiol 42:5614 –5619. http://dx.doi.org/10.1128/JCM.42.12.5614 -5619.2004.
13. Vandecasteele SJ, Peetermans WE, Merckx RR, Rijnders BJ, Van Eldere J.2003. Reliability of theica,aapandatlEgenes in the discrimination between invasive, colonizing and contaminantStaphylococcus epidermidis isolates in the diagnosis of catheter-related infections. Clin Microbiol In-fect9:114 –119.http://dx.doi.org/10.1046/j.1469-0691.2003.00544.x. 14. Conlan S, Mijares LA; NISC Comparative Sequencing Program, Becker
J, Blakesley RW, Bouffard GG, Brooks S, Coleman H, Gupta J, Gurson N, Park M, Schmidt B, Thomas PJ, Otto M, Kong HH, Murray PR, Segre JA.2012.Staphylococcus epidermidispan-genome sequencing anal-ysis reveals diversity of skin commensal and hospital infection-associated isolates. Genome Biol 13:R64.http://dx.doi.org/10.1186/gb-2012-13-7 -r64.
15. Du X, Zhu Y, Song Y, Li T, Lou T, Sun G, Yang C, Cao C, Lu Y, Li M.
2013. Molecular analysis ofStaphylococcus epidermidisstrains isolated from community and hospital environments in China. PLoS One
8:e62742.http://dx.doi.org/10.1371/journal.pone.0062742.
16. Granslo HN, Klingenberg C, Fredheim EG, Rønnestad A, Mollnes TE, Flægstad T.2010. Arginine catabolic mobile element is associated with low antibiotic resistance and low pathogenicity inStaphylococcus epider-midisfrom neonates. Pediatr Res68:237–241.http://dx.doi.org/10.1203 /00006450-201011001-00463.
17. Cherifi S, Byl B, Deplano A, Nonhoff C, Denis O, Hallin M. 2013. Comparative epidemiology ofStaphylococcus epidermidisisolates from pa-tients with catheter-related bacteremia and from healthy volunteers. J Clin Microbiol51:1541–1547.http://dx.doi.org/10.1128/JCM.03378-12. 18. Kozitskaya S, Olson ME, Fey PD, Witte W, Ohlsen K, Ziebuhr W.2005.
Clonal analysis ofStaphylococcus epidermidisisolates carrying or lacking biofilm-mediating genes by multilocus sequence typing. J Clin Microbiol
43:4751– 4757.http://dx.doi.org/10.1128/JCM.43.9.4751-4757.2005. 19. Li M, Wang X, Gao Q, Lu Y. 2009. Molecular characterization of
Staphylococcus epidermidisstrains isolated from a teaching hospital in Shanghai, China. J Med Microbiol58(Pt 4):456 – 461.http://dx.doi.org/10 .1099/jmm.0.007567-0.
20. Iorio NL, Caboclo RF, Azevedo MB, Barcellos AG, Neves FP, Domingues RM, dos Santos KR.2012. Characteristics related to antimicrobial resistance and biofilm formation of widespread methicillin-resistantStaphylococcus epidermidisST2 and ST23 lineages in Rio de Janeiro hospitals, Brazil. Diagn Microbiol Infect Dis 72:32– 40. http://dx.doi.org/10.1016/j .diagmicrobio.2011.09.017.
21. Mendes RE, Deshpande LM, Costello AJ, Farrell DJ.2012. Molecular epidemiology ofStaphylococcus epidermidisclinical isolates from U.S. hos-pitals. Antimicrob Agents Chemother56:4656 – 4661.http://dx.doi.org /10.1128/AAC.00279-12.
22. Miragaia M, Thomas JC, Couto I, Enright MC, de Lencastre H.2007. Inferring a population structure forStaphylococcus epidermidisfrom mul-tilocus sequence typing data. J Bacteriol189:2540 –2552.http://dx.doi.org /10.1128/JB.01484-06.
23. Sharma P, Satorius AE, Raff MR, Rivera A, Newton DW, Younger JG.
2014. Multilocus sequence typing for interpreting blood isolates of Staph-ylococcus epidermidis. Interdiscip Perspect Infect Dis2014:787458.http: //dx.doi.org/10.1155/2014/787458.
24. Widerström M, McCullough CA, Coombs GW, Monsen T, Christian-sen KJ.2012. A multidrug-resistant Staphylococcus epidermidis clone (ST2) is an ongoing cause of hospital-acquired infection in a Western Australian hospital. J Clin Microbiol 50:2147–2151 dio:10.1128/ JCM.06456-11.http://dx.doi.org/10.1128/JCM.06456-11.
25. Smyth DS, Robinson DA.2010. Population genetics ofStaphylococcus, p 321–343.InRobinson DA, Falush D, Feil EJ (ed), Bacterial population genetics in infectious disease. John Wiley & Sons, Hoboken, NJ. 26. Thomas JC, Zhang L, Robinson DA.2014. Differing lifestyles of
Staph-ylococcus epidermidisas revealed through Bayesian clustering of multilo-cus sequence types. Infect Genet Evol22:257–264.http://dx.doi.org/10 .1016/j.meegid.2013.06.020.
27. Méric G, Miragaia M, de Been M, Yahara K, Pascoe B, Mageiros L, Mikhail J, Harris LG, Wilkinson TS, Rolo J, Lamble S, Bray JE, Jolley KA, Hanage WP, Bowden R, Maiden MCJ, Mack D, de Lencastre H, Feil EJ, Corander J, Sheppard SK. 16 April 2015. Ecological overlap and horizontal gene transfer inStaphylococcus aureus andStaphylococcus epidermidis. Genome Biol Evolhttp://dx.doi.org/10 .1093/gbe/evv066.
28. Gray BM.2002. Egg-based media for delayed processing of nasopharyn-geal swabs in colonization studies ofStreptococcus pneumoniae. Eur J Clin Microbiol Infect Dis21:666 – 670.http://dx.doi.org/10.1007/s10096-002 -0796-z.
29. Heikens E, Fleer A, Paauw A, Florijn A, Fluit AC.2005. Comparison of genotypic and phenotypic methods for species-level identification of clin-ical isolates of coagulase-negative staphylococci. J Clin Microbiol43:
2286 –2290.http://dx.doi.org/10.1128/JCM.43.5.2286-2290.2005. 30. Corander J, Marttinen P, Sirén J, Tang J.2008. Enhanced Bayesian
modelling in BAPS software for learning genetic structures of populations. BMC Bioinformatics9:539.http://dx.doi.org/10.1186/1471-2105-9-539. 31. Thomas JC, Robinson DA.2014. Multilocus sequence typing of
Staphy-lococcus epidermidis, p 61– 69.InFey PD (ed),Staphylococcus epidermidis methods and protocols. Springer, New York, NY.
32. Librado P, Rozas J.2009. DnaSP v5: a software for comprehensive anal-ysis of DNA polymorphism data. Bioinform25:1451–1452.http://dx.doi .org/10.1093/bioinformatics/btp187.
33. Paetkau D, Calvert W, Stirling I, Strobeck C.1995. Microsatellite anal-ysis of population structure in Canadian polar bears. Mol Ecol4:347–354. http://dx.doi.org/10.1111/j.1365-294X.1995.tb00227.x.
34. Thomas JC, Vargas MR, Miragaia M, Peacock SJ, Archer GL, Enright MC.2007. Improved multilocus sequence typing scheme for Staphylococ-cus epidermidis. J Clin Microbiol45:616 – 619.http://dx.doi.org/10.1128 /JCM.01934-06.
35. Simpson E.1949. Measurement of diversity. Nature163:688.http://dx .doi.org/10.1038/163688a0.
36. Grundmann H, Hori S, Tanner G.2001. Determining confidence inter-vals when measuring genetic diversity and the discriminatory abilities of typing methods for microorganisms. J Clin Microbiol39:4190 – 4192. http://dx.doi.org/10.1128/JCM.39.11.4190-4192.2001.
37. Noble WS.2006. What is a support vector machine? Nat Biotechnol
24:1565–1567.http://dx.doi.org/10.1038/nbt1206-1565.
38. Meyer D, Dimitriadou E, Hornik K, Weingessel A, Leisch F. 2014. e1071: misc functions of the Department of Statistics, Probability Theory Group (formerly: E1071), TU Wien. R package version 1.6-4.https://cran .r-project.org/package⫽e1071.
39. Falush D, Stephens M, Pritchard JK. 2003. Inference of population structure using multilocus genotype data: linked loci and correlated allele frequencies. Genetics164:1567–15687.
40. Willems RJ, Top J, van Schaik W, Leavis H, Bonten M, Sirén J, Hanage WP, Corander J.2012. Restricted gene flow among hospital subpopula-tions ofEnterococcus faecium. mBio3(4):e00151-12.http://dx.doi.org/10 .1128/mBio.00151-12.
41. Liesenfeld O, Lehman L, Hunfeld KP, Kost G.2014. Molecular diagnosis of sepsis: new aspects and recent developments. Eur J Microbiol Immunol
4:1–25.http://dx.doi.org/10.1556/EuJMI.4.2014.1.1.
42. Robertson GA, Thiruvenkataswamy V, Shilling H, Price EP, Huygens F, Henskens FA, Giffard PM. 2004. Identification and interrogation of highly informative single nucleotide polymorphism sets defined by bacte-rial multilocus sequence typing databases. J Med Microbiol53(Pt 1):35– 45.http://dx.doi.org/10.1099/jmm.0.05365-0.
43. Stephens AJ, Huygens F, Inman-Bamber J, Price EP, Nimmo GR, Schooneveldt J, Munckhof W, Giffard PM.2006. Methicillin-resistant Staphylococcus aureusgenotyping using a small set of polymorphisms. J Med Microbiol55(Pt 1):43–51.http://dx.doi.org/10.1099/jmm.0.46157-0. 44. Holmes A, McAllister G, McAdam PR, Hsien Choi S, Girvan K, Robb
A, Edwards G, Templeton K, Fitzgerald JR.2014. Genome-wide single nucleotide polymorphism-based assay for high-resolution epidemiologi-cal analysis of the methicillin-resistantStaphylococcus aureushospital clone EMRSA-15. Clin Microbiol Infect20:0124 – 0131.http://dx.doi.org /10.1111/1469-0691.12328.
45. de Been M, van Schaik W, Cheng L, Corander J, Willems RJ.2013. Recent recombination events in the core genome are associated with adap-tive evolution inEnterococcus faecium. Genome Biol Evol5:1524 –1535. http://dx.doi.org/10.1093/gbe/evt111.
on May 16, 2020 by guest
http://jcm.asm.org/
46. Wang J, Kuenzel S, Baines JF. 2014. Draft genome sequences of 11 Staphylococcus epidermidisstrains isolated from wild mouse species. Genome Announc2(1):e01148 –13.http://dx.doi.org/10.1128/genomeA .01148-13.
47. Madhusoodanan J, Seo KS, Remortel B, Park JY, Hwang SY, Fox LK, Park YH, Deobald CF, Wang D, Liu S, Daugherty SC, Gill AL, Bohach
GA, Gill SR.2011. An enterotoxin-bearing pathogenicity island in Staph-ylococcus epidermidis. J Bacteriol 193:1854 –1862. http://dx.doi.org/10 .1128/JB.00162-10.
48. Weinstein MP.2003. Blood culture contamination: persisting problems and partial progress. J Clin Microbiol41:2275–2278.http://dx.doi.org/10 .1128/JCM.41.6.2275-2278.2003.