Technology (IJRASET)
Data Stream Classification Using Ant Colony
Optimization
S. Rajesh Kumar1, Dr. S. Murugappan2 1
Research Scholar, Department of Computer Science, Research & Development Center, Bharathiar University, Coimbatore, Tamil Nadu, India
2
Associate Professor & Head, School of Computer Sciences, Tamil Nadu Open University, Chennai, Tamil Nadu, India
Abstract:- Ant Colony Optimization is mostly used to find the short path to reach the destination for food source to their nest which helps to solve so many problem optimizations. It is based on the meta-heuristic function that should be presented in classification problems. The problem making more challenging when concept drift occurs when data totally change in different time and the major problems of data stream mining is infinite length, concept drift, concept evolution. Novel class detection in data stream classification is interesting research topic for concept drift problem here we compare different techniques for same. Most of the existing data stream classification techniques that work to assume that the feature space of the data points in the stream is static.
Keyword: ACO, Data Stream, Classification, Mining, Drift
I. INTRODUCTION
In Ant Colony Optimization, problems are defined in terms of components and states, which are sequences of components. Ant Colony Optimization incrementally generates solutions in the form of paths in the space of such components, adding new components to a state. Memory is kept of all the observed transitions between pairs of solution components and a degree of desirability is associated to each transition depending on the quality of the solutions in which it occurred so far. While a new solution is generated, a component y is included in a state, with a probability that is proportional to the desirability of the transition between the last components included in the state, and y itself. From the point of view, all the states finishing by the same component are identical [1].
The feature space that represents a data point in the stream may change over time. For example, consider a text stream where each data point is a document, and each word is a feature. Since it is impossible to know which words will appear in the future, the complete feature space is unknown. Besides, it is customary to use only a subset of the words as the feature set because most of the words are likely to be redundant for classification [2].
The probabilistic rule is biased by pheromone values and heuristic information: the higher the pheromone and the heuristic value associated to an edge, the higher the probability an ant will choose that particular edge. Once all the ants have completed their tour, the pheromone on the edges is updated. Each of the pheromone values is initially decreased by a certain percentage. Each edge then receives an amount of additional pheromone proportional to the quality of the solutions to which it belongs repeatedly applied until a termination criterion is satisfied.
II. DATA STREAM MINING
A data stream is an ordered sequence of instances that arrive at a rate that does not permit to permanently store them in memory. Data streams are potentially unbounded in size making them impossible to process by most data mining approaches.
The main characteristics of the data stream model imply the following constraints [3]
A. It is impossible to store all the data from the data stream. Only small summaries of data streams can be computed and stored, and the rest of the information is thrown away.
B. The arrival speed of data stream tuples forces each particular element to be processed essentially in real time, and then discarded.
555
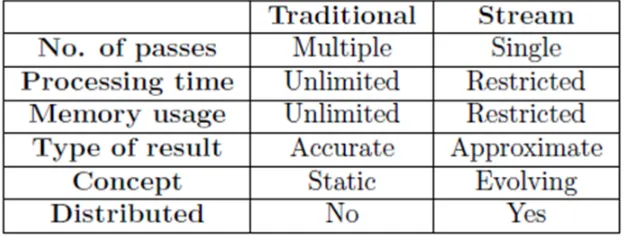
Table 1: Traditional and stream data mining comparisonMost of data stream analysis, querying, classification, and clustering applications require some sort of summarization techniques to satisfy the earlier mentioned constraints. Summarization techniques are used for producing approximate answers from large data sets usually by means of data reduction and synopsis construction. This can be done by selecting only a subset of incoming data or by using sketching, load shedding, and aggregation techniques.
1) Sampling: Random sampling is probably the first developed and most common technique used to decrease data size whilst still capturing its essential characteristics. It is perhaps the easiest form of summarization in a data stream and other synopses can be built from a sample itself [4]. To obtain an unbiased sample of data we need to know the data set’s size. Because in the data stream model the length of the stream is unknown and at times even unbounded, the sampling strategy needs to be modified.
2) Sketching: Sketching involves building a statistical summary of a data stream using a small amount of memory. It was introduced by Alon, Matias, and Szegedy [5] and consists of frequency moments.
3) Histograms: Histograms are summary structures capable of aggregating the distribution of values in a dataset. They are used in tasks such as query size estimation, approximate query answering, and data mining. The most common types of histograms for data streams are: V-optimal histograms, equal-width histograms, end-biased histograms.
4) Wavelets: Wavelets are used as a technique for approximating data with a given probability. Wavelet coefficients are projections of a given signal (set of data values) onto an orthogonal set of basis vectors. There are many types of basis vectors, but due to their ease of computation, the most commonly used are Haar wavelets [6].
III. CONCEPT DRIFT MINING
Concept drift is an unforeseen substitution of one data source S1 (with an underlying probability distribution IIS1), with another
source S2 (with distribution IIS2). The most popular example to present the problem of concept drift is that of detecting and
filtering out spam e-mail. The distinction between unwanted and legitimate e-mails is user-specific and evolves with time. As concept drift is assumed to be unpredictable, periodic seasonality is usually not considered as a concept drift problem. As an exception, if seasonality is not known with certainty, it might be regarded as a concept drift problem. The core assumption, when dealing with the concept drift problem, is uncertainty about the future – we assume that the source of the target instance is not known with certainty.
The first plot (Sudden) shows abrupt changes that instantly and irreversibly change the variables class assignment. Real life examples of such changes include season change in sales. The next two plots (Incremental and Gradual) illustrate changes that happen slowly over time. Incremental drift occurs when variables slowly change their values over time, and gradual drift occurs when the change involves the class distribution of variables.
Some researchers do not distinguish these two types of drift and use the terms gradual and incremental as synonyms. A typical example of incremental drift is price growth due to inflation, whilst gradual changes are exemplified by slowly changing definitions of spam or user-interesting news feeds. The left-bottom plot (Recurring) represents changes that are only temporary and are reverted after some time. This type of change is regarded by some researchers as local drift [7].
Technology (IJRASET)
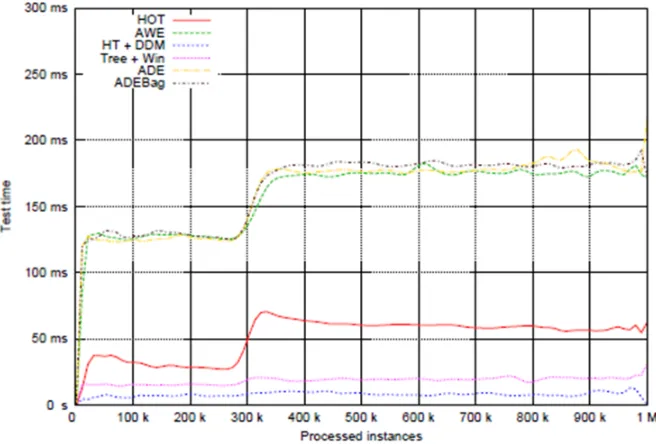
Fig 1: Constant testing time for all the algorithms and a visible example of concept drift
This drift is not certainly periodic, it is not clear when the source might reappear, that is the main difference from the seasonality concept used in statistics. The fifth plot (Blip) represents a “rare event”, which could be regarded as an outlier in a static distribution. In streaming data, detected blips should be ignored as the change they represent is random. It is important to note that the presented types of drift are not exhaustive and that in real life situations concept drift is a complex combination of many types of drift.
[image:4.612.80.466.407.702.2]557
data streams are possibly unbounded, the number of source distribution changes can be infinite. Nevertheless, it is important to identify structural types of drift, since the assumption about the change types is absolutely needed for designing adaptively strategies.IV. STREAMING ENSEMBLE ALGORITHM
Street and Kim [8] proposed an ensemble method called Streaming Ensemble Algorithm (SEA) that changes its structure to react to changes. They propose a heuristic replacement strategy of the “weakest” expert based on two factors: accuracy and diversity. Accuracy is important because, as the authors suggest, an ensemble should correctly classify the most recent examples to adapt to drift. On the other hand, diversity is the source of success of such ensemble methods like bagging or boosting in static environments. The pseudo-code for SEA is listed in Algorithm is given below
The Streaming Ensemble Algorithm [8]
[image:5.612.168.448.482.661.2]The algorithm processes the incoming stream in data chunks. The size of those chunks is an important parameter because it is responsible for the trade-off between accuracy and flexibility. Each data chunk is used to train a new classifier, which is later compared with ensemble members.
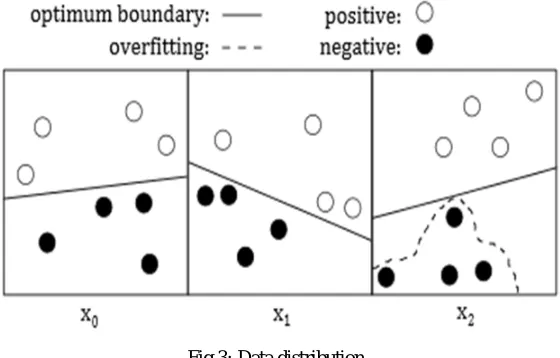
Fig 3: Data distribution
Technology (IJRASET)
V. CONCLUSION
The mining of data streams with concept drift is build into a sub division of knowledge discovery, with its own individual research problems. The need for accessible by processing with time and memory constraints forces researchers to find the resulted focus on resource usage while designing accurate classifiers. In Addition, concept drift of data stream introduces the requirement for a forgetting mechanism that dynamically removes outdated data. In future we plan to implement that analyze the various ways of diversifying ensemble members like the use of different base learners or promote.
REFERENCES
[1]. Denis Darquennes, "Implementation and Applications of Ant Colony Algorithms" Faculties Universites Notre-Dame de la Paix, Namur Institute of Informatic Annee academic 2004-2005
[2]. Mohammad M. Masud, “Classification and Novel Class Detection of Data Streams in a Dynamic Feature Space”, ECML PKDD 2010, Part II, LNAI 6322, pp. 337–352, 2010.
[3]. Albert Bifet. Adaptive learning and mining for data streams and frequent patterns. PhD thesis, Universitat Polit´ecnica de Catalunya, 2009.
[4]. Brian Babcock, Shivnath Babu, Mayur Datar, Rajeev Motwani, and Jennifer Widom. Models and issues in data stream systems. In Lucian Popa, editor, PODS, pages 1–16. ACM, 2002.
[5]. Noga Alon, Yossi Matias, and Mario Szegedy. The space complexity of approximating the frequency moments. J. Comput. Syst. Sci., 58(1):137–147, 1999. [6]. Anna C. Gilbert, Sudipto Guha, Piotr Indyk, Yannis Kotidis, S. Muthukrishnan, and Martin Strauss. Fast, small-space algorithms for approximate histogram maintenance. In STOC, pages 389–398, 2002.
[7]. Alexey Tsymbal, Mykola Pechenizkiy, Padraig Cunningham, and Seppo Puuronen. Dynamic integration of classifiers for handling concept drift. Information Fusion, 9(1):56–68, 2008.
[8]. W. Nick Street and YongSeog Kim. A streaming ensemble algorithm (sea) for large-scale classification. In KDD, pages 377–382, 2001. [9]. Wang, H., Fan, W., Yu, P.S., Han, J.: Mining concept-drifting data streams using ensemble classifiers. In: KDD 2003, pp. 226–235 (2003)
[10]. Wenerstrom, B., Giraud-Carrier, C.: Temporal data mining in dynamic feature spaces. In: Perner, P. (ed.) ICDM 2006. LNCS (LNAI), vol. 4065, pp. 1141–1145. Springer, Heidelberg (2006)