Research Article
A Novel Scheduling Algorithm Based on Game Theory and
Multicriteria Decision Making in LTE Network
Mohammad Nour Hindia, Ahmed Wasif Reza, and Kamarul Ariffin Noordin
Department of Electrical Engineering, Faculty of Engineering, University of Malaya, 50603 Kuala Lumpur, Malaysia Correspondence should be addressed to Ahmed Wasif Reza; [email protected]
Received 27 July 2014; Revised 18 December 2014; Accepted 19 December 2014
Academic Editor: Lillykutty Jacob
Copyright © Mohammad Nour Hindia et al. This is an open access article distributed under the Creative Commons Attribution License, which permits unrestricted use, distribution, and reproduction in any medium, provided the original work is properly cited.
Fourth generation wireless networks provide mobile users with high data rate and quality of services, such as Long Term Evolution (LTE), which has been developed by the 3rd Generation Partnership Project (3GPP). However, 3GPP is not a standardized scheduling algorithm to utilize LTE properties in smart grid applications. This paper proposes a two-level scheduling scheme composed of cooperative game theory (bankruptcy and shapely) and Technique for Order Performance by Similarity to Ideal Solution (TOPSIS). The proposed algorithm improves resource allocation for three smart grid applications, namely, voice, video surveillance, and metering data. On the first level, bankruptcy and shapely value algorithm fairly distribute the resources among smart grid applications. On the second level, TOPSIS algorithm allocates the resources among application’s users based on their criteria and the application’s preferences. Moreover, the system’s performance has been evaluated in terms of throughput, delay, and fairness index. The proposed algorithm is compared with existing algorithms, such as proportional fairness, modified largest weighted delay first, and exponential rule schemes. The results show a significant improvement compared to other algorithms. This paper presents a novel technique consisting of both TOPSIS and game theory algorithms to study three smart grid applications. The novel algorithm has proven to be an effective scheduling technique for smart grid applications.
1. Introduction
Nowadays, smart grid has drawn a lot of research interests due to its ability to provide valuable information to monitor, control, and manage source generation, substation, and consumers’ power consumption. Some of the key smart grid components are advance meter infrastructures (AMI) and phasor measure units (PMU) [1,2]. Moreover, AMI provides consumers with full information on the electricity status, such as consumption rates, and then the data is transmitted to the control centre through a communications network. PMU also has an essential role since it provides monitoring for voltage and current. Furthermore, it is fixed at the power generator and the substation. For real monitoring, the smart grid utilizes smart applications, such as video surveillance and voice (work force).
According to [3], LTE is a promising technology for smart grid applications since it demonstrates a good performance
in terms of delay, data rate, and reliability compared to other technologies. In addition, the LTE system represents an important milestone towards the so called 4G cellular networks. However, LTE is not a standardized scheduling algorithm for smart grid applications despite the fact that it plays a crucial role in the smart grid performance. The scheduling mechanism handles the resource distribution among the users. To be more precise, it chooses how to distribute radio resources among different stations taking into account channel condition and quality of service (QoS) requirements. Moreover, scheduling process is handled by the base station at the medium access control (MAC) layer for LTE network [4]. Uplink and downlink scheduling are separated in LTE and the scheduling decisions can be taken independently of each other. The scheduler takes into account the channel conditions status labeled as channel quality inductor (CQI), which is updated regularly at each transmis-sion time interval (TTI) [5]. The resource block is the basic
time-frequency unit in the scheduler, spanning 180 kHz in the frequency domain. The scheduler assigns resource blocks to a user each 1 ms of scheduling interval [6].
Several algorithms have been proposed such as round robin (RR), proportional fairness (PF), modified largest weighted delay first (M-LWDF), and exponential rule (EXP-rule) schemes to improve the resource allocation perfor-mance in terms of throughput and fairness.
The RR provides a fair time resource sharing among the users. However, in wireless systems, this approach is not fair in terms of user throughput, due to the fact that it does not depend solitarily on the amount of time in which the resources are occupied, but also on the experienced channel conditions. The introduction of PF solved that problem [7]. It considers both channel condition and average throughput to determine the transmission order among the users. The PF metric is obtained by merging blind equal throughput (BET) and maximum throughput (MT). BET aims at serving all users equally in terms of throughput, whereas MT prioritizes the users who have better channel conditions. Although PF strategy shows high performance for non-real time applications, it is inefficient for real time applications, because it does not consider delay requirements for real time applications. Moreover, as a guaranteed delay technique, M-LWDF is proposed in [8, 9]. It shows better performance than PF since it takes delay requirements into consideration. This scheduling guarantees packet delivery within the specific delay budget. The delay metric is used for shaping the behavior of PF; it even assures a good balance among spectral efficiency and fairness, but it is not concerned about the user’s preferences. Furthermore, to increase the end-to-end system delay sensitivity, EXP/PF is proposed in [10] resulting in an improved performance. EXP/PF is based on the behavior shapes of the PF algorithm by taking an exponential function of the end-to-end system delay. Even though previous scheduling algorithms have succeeded to provide better performance of the real and non-real time applications, there is still a main drawback in the static way of decision making. In other words, it could not be adapted to changeable application’s preferences with time.
A new concept for scheduling, such as game theory (bankruptcy and shapely value), was proposed to enable bandwidth sharing between coalitions of applications, result-ing in an improvement in resource allocations [11]. Authors in [12] used cooperative game theory concept to allocate the resources over LTE technology. Furthermore, the Nash Bargaining Solution (NBS) concept is utilized to address the fairness issue by introducing an optimal fair resource allocation. Using the game theory concept, this scheme illustrates a high fairness level. The main drawback of the game theory is that a large number of users add further complexity to the system. To solve such a problem, the users are grouped into 2 users, rather thann-users group. In the same manner, the shapely value algorithm is proposed in [13] to perform the resource allocation for the real time services. It shows an improved performance and trade-off between the throughput gain and fairness index.
Recently, a new scheduling algorithm has been proposed for smart grid applications over LTE technology. Moreover,
this scheduler is based on the mathematical game theory concept to define linear optimization for the resource allo-cation problem. For that reason, an algorithm is derived and analyzed theoretically. This algorithm concludes that if the new algorithms are used to enhance the latency, LTE could be utilized to support smart grid applications [14–16]. In [17], cooperative game theory (bankruptcy and shapely value) is proposed with the modified EXP-rule and M-LWDF algorithms, by introducing virtual token mechanism. The proposed mechanism works by forming coalitions between flow classes to distribute the bandwidth fairly among all users and gives priority to real time flows. Even if this approach is suitable for real time applications, it is not concerned about non-real time applications.
However, this paper proposes a combination of game the-ory (bankruptcy and shapely value) and TOPSIS concepts for smart grid applications. This combination has significantly improved the scheduling scheme. In addition, the proposed novel scheme considers four criteria (delay, throughput, fairness, and queue length) for both real and non-real time applications. It is worth mentioning that the existing algo-rithms do not consider all these criteria at the same time for real and non-real time applications together. The use of game theory concept (bankruptcy and shapely value) provides a fair resource sharing between applications. To start with, bankruptcy forms a coalition between applications so that the distribution decision is shared among a group of applications rather than individual application. Consequently, bankruptcy algorithm utilizes transferable utility (TU) concept (band-width in our approach), which allows shifting the benefits among applications. For instant, if the number of application’s users suddenly increases, more resources are assigned to this application (class) from other applications. Furthermore, the shapely value algorithm adds an essential enhancement to the scheduling mechanism where it distributes the resources fairly among the applications as a proportion, which prevents low priority classes from being starved. TOPSIS concept prioritizes the application’s users based on their criteria and the application’s preferences. The priority will be given to the users with urgent requirements (e.g., delay). To the best of our knowledge, the evaluation study of these three applications using the TOPSIS and the game theory combination is considered novel.
The rest of this paper is structured in the following order. The proposed model and the theoretical and the related equations for the proposed algorithm are described inSection 2.Section 3describes the procedure used for the game theory calculations of three smart grid applications. The evaluation of the proposed approaches and the simulation results are presented inSection 4. Finally, the conclusion and some ideas for future work are described inSection 5.
2. Proposed Model
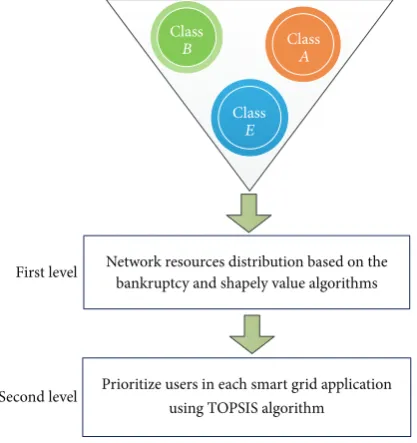
Network resources distribution based on the bankruptcy and shapely value algorithms
Prioritize users in each smart grid application using TOPSIS algorithm First level
Second level
Class B
Class E
[image:3.600.68.277.74.296.2]Class A
Figure 1: Main system diagram.
resources among a group of classes. Afterwards, shapely value fairly distributes the resources among classes as a proportion according to their demands, which results in serving the low priority classes without starvation.
On the second level, TOPSIS algorithm allocates the resources among the users of the class based on the class preferences. Figure 1 illustrates a general diagram of the proposed model.
2.1. Bankruptcy and Shapely Value. In order to divide the
resources perfectly among the classes, bankruptcy forms a coalition between applications (classes), so that the distribu-tion decision is shared among classes rather than individual users. To apply this mechanism, the transferable utility concept (bandwidth in our approach) is used to allow shifting the bandwidth among classes. For instance, if number of class 𝐴users suddenly increases, more resources are assigned to it from either class𝐵or𝐶. Bankruptcy determines the required data rate of classes based on the O’Neill approach [18], as shown in
𝑈 (𝑆) =max{𝐶 − ∑
𝑖∈𝑁\𝑆
𝑃𝑖× 𝐾𝑖, 0} ,
𝑈 (𝑁) = 𝐶,
(1)
where 𝑈(𝑆) is the utility for the set of coalition 𝑆 in the game,𝐶 is the total available system capacity, 𝑁is the set of the smart grid applications(𝑁 = {1, 2, . . . , 𝑛}),𝑃𝑖 is the required bandwidth for a smart grid application𝑖, and𝐾𝑖is the quantity of users in a smart grid application𝑖.
Once all the potential coalitions among classes are cal-culated, shapely value distributes the resources fairly among them. The fairness distribution property of shapely value is based on the three main parameters (symmetry, additivity, and efficiency) [19,20], where symmetry means there is no
relationship between the player’s resource allocation and the order of the players entry into the game. Additivity axiom predicts the relationship between different values of the game and is valid for independent and composite games. The Pareto efficiency axiom guarantees that no player can earn a better allocation without worsening other players.
The shapely value concept prevents low priority classes from being starved since the resources are distributed as a proportion among classes, as shown in
Sh𝑖(𝑈) = ∑
𝑆⊆𝑁𝑊 (𝑆) × (𝑈 (𝑆) − 𝑈 (𝑆 \ {𝑖}))
where𝑊 (𝑆) = (|𝑆| − 1)! × (𝑛 − |𝑆|)!
𝑛! ,
(2)
where Sh𝑖(𝑈)is the shapely value of smart grid applicationi
(the worth of a smart grid application𝑖in the game),𝑈(𝑆 \ {𝑖})indicates the coalition utility𝑆excluding the smart grid application𝑖,𝑛is the number of smart grid applications in the game, and𝑊(𝑆)is the probability of entrance for smart grid applications to the game.
2.2. TOPSIS. TOPSIS method allows the scheduler to select
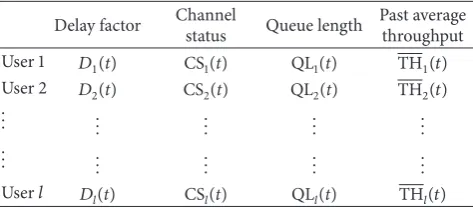
the best option from all possible ones [21]. Furthermore, it is defined as a multiple-decision maker, which chooses the most appropriate solution from all potential alternatives. TOPSIS method has several advantages, such as multiple attribute decision making, guaranteed high satisfaction factor to the smart grid application preferences, low complexity, and robust scheduling decision. In this work, TOPSIS method is utilized to serve the smart grid application’s users based on their criteria values and preferences. Moreover, four criteria are used to make the scheduling decision (delay, channel status, queue length, and the past average throughout). Such weighting coefficients increase the scheduling robustness, control, and dynamic adjustment. TOPSIS procedures are described in the following steps.
Step 1 (criteria value calculation). As the user criteria are
the inputs of the TOPSIS algorithm, they are calculated as follows:
(1) User 𝑚 delay metric is the difference between the current time and the stamped time of the packet in the buffer queue, which is normalized by the delay budget of the related application
𝐷𝑚(𝑡) = 𝑡 − 𝑇stamp𝑚
𝑑𝑖 , (3)
where𝐷𝑚(𝑡)is the delay factor of user𝑚at time𝑡,𝑡 is the real time,𝑇stamp𝑚is the entrance time of user𝑚
packets in the buffer queue, and𝑑𝑖is the delay budget of application𝑖.
Table 1: TOPSIS evaluation criteria.
Delay factor Channel
status Queue length
Past average throughput User 1 𝐷1(t) CS1(t) QL1(t) TH1(𝑡) User 2 𝐷2(t) CS2(t) QL2(t) TH2(𝑡)
... ... ... ... ...
... ... ... ... ...
User𝑙 𝐷𝑙(t) CS𝑙(t) QL𝑙(t) TH𝑙(𝑡)
(3) The queue length metric is used as a pointer to give the situation of the user’s buffer, and it is calculated as follows:
QL𝑚(𝑡) = 𝑄𝑚(𝑡)
𝑄 , (4)
where QL𝑚(𝑡)is the queue length metric of user𝑚at time𝑡,𝑄𝑚(𝑡)is the number of packets of user𝑚in the buffer at time𝑡, and𝑄is the total accommodation capacity of the buffer.
(4) The past average throughput metric is used as a pointer to determine the data rate, which has been transmitted to user 𝑚 in the previous TTI. It is calculated as a moving average, as shown in
TH𝑚(𝑡) = 𝛼 ⋅TH𝑚(𝑡 − 1) + (1 − 𝛼) ⋅ 𝑟𝑚(𝑡)
where 0 ≤ 𝛼 ≤ 1, (5)
where TH𝑚(𝑡)is the past average throughput of user 𝑚,𝛼is constant related to the window size, and𝑟𝑚(𝑡) is the acquired data rate of user𝑚at time𝑡.
After calculating the evaluation criteria (Step 1, as above) for each user, they will be inserted intoTable 1.
Step 2(construct the normalized decision matrix). To make
a decision over multicriteria using TOPSIS algorithm, each attribute is transferred from dimensions into dimensionless by finding the normalized value of criteria𝑗related to user𝑚 as it is shown in(6). The matrix in(7)contains the normalized attribute values of all users. Consider
𝑟𝑚𝑗= 𝑥𝑚𝑗 √∑𝑙𝑚=1𝑥2
𝑚𝑗
, (6)
𝑅 =[[[[
[
𝑟11 𝑟12 ⋅ ⋅ ⋅ 𝑟1𝑦 𝑟21 𝑟22 ⋅ ⋅ ⋅ 𝑟2𝑦
... ... ... ... 𝑟𝑙1 𝑟𝑙2 ⋅ ⋅ ⋅ 𝑟𝑙𝑦
] ] ] ] ]
, (7)
where𝑟𝑚𝑗is the normalized value of user𝑚metric𝑗,𝑥𝑚𝑗is the value of user𝑚metric𝑗, and𝑅is the normalized decision matrix.
Step 3(construct the weighted normalized decision matrix).
The weighted matrix is obtained by multiplying each attribute from the normalized decision matrix by its associated weight. As we mentioned earlier, each metric has specific weight, which is chosen carefully to be appropriate to the smart grid application demands. For instance, voice application requires higher concentration on the delay factor and queue length rather than past average throughput and channel status. Video surveillance application has a little more tolerance to delay with as much fewer packet loss rate (PLR) as possible. On the other hand, the metering data application requires the highest data rate, to achieve that the higher weights on channel status and past average throughput than other criteria will be given. It is worth mentioning that the sum of the criteria weights is equal to 100%.
Each of the criteria values is updated at each TTI, and the weight related to each criterion is multiplied by criteria values for each smart grid application, as illustrated in
V(𝑡) =[[[[
[
𝑤𝐷× 𝐷1(𝑡) 𝑤CS×CS1(𝑡) 𝑤QL×QL1(𝑡) 𝑤TH×TH1(𝑡) 𝑤𝐷× 𝐷2(𝑡) 𝑤CS×CS2(𝑡) 𝑤QL×QL2(𝑡) 𝑤TH×TH2(𝑡)
... ... ... ...
𝑤𝐷× 𝐷𝑙(𝑡) 𝑤CS×CS𝑙(𝑡) 𝑤QL×QL𝑙(𝑡) 𝑤TH×TH𝑙(𝑡) ] ] ] ] ]
, (8)
where V(𝑡) is the decision matrix and 𝑤𝐷, 𝑤CS, 𝑤QL, and 𝑤THare the attribute weights for delay, channel status, queue length, and past average throughput, respectively.
Step 4 (separation measurement calculation based on the
Euclidean distance). TOPSIS utilizes Euclidean distances to measure the separation measurement for users (positive ideal value and negative ideal value). The user, who is prioritized to serve, supposed to have the shortest distance from the positive ideal value and the farthest distance from the negative ideal value. The positive ideal value is calculated by
the summation of the Euclidean distance between the user criteria values and the highest criteria values among all the users, as shown in
𝑆∗𝑚= √∑𝑦
𝑗=1
(V𝑚𝑗(𝑡) −V∗ 𝑗 (𝑡))
2
, 𝑚 = (1, 2, . . . , 𝑦) , (9)
Similarly, the negative ideal value is calculated by the summation of the Euclidean distance between the user criteria values and the lowest criteria values among all the users, as shown in
𝑆−𝑚= √∑𝑦
𝑗=1
(V𝑚𝑗(𝑡) −V− 𝑗 (𝑡))
2
, 𝑚 = (1, 2, . . . , 𝑦) , (10)
where𝑆−𝑚 is the user𝑚separation measurement of negative ideal value at time𝑡.
At the end ofStep 4, two values, namely,𝑆∗𝑚and𝑆−𝑚, for each metric have been counted. These two values represent the distance between each metric and both the ideal and the negative ideal metric values.
Step 5 (closeness to the ideal solution calculation). In the
process, the closeness of user𝑚to the ideal solution is defined as
𝐶∗𝑚(𝑡) = 𝑆−𝑚(𝑡)
𝑆∗
𝑚(𝑡) + 𝑆−𝑚(𝑡), 0 < 𝐶 ∗
𝑚< 1, (𝑚 = 1, 2, . . . , 𝑙) ,
(11)
where𝐶∗𝑚(𝑡)defines how much the user𝑚is close to the ideal solution.
Step 6(prioritize the users in each smart grid application).
The set of the users can now be ranked according to the descending order of criteria where the highest value will be the first to be served, and so on.
3. Game Theory Calculations
Various applications require different data rates. In this scenario, voice, video surveillance, and metering data appli-cations require 32, 242, and 500 kbps, respectively [22]. The bandwidth is assumed to be 15 MHz, which corresponds to 75 RBs, and the system’s capacity is 54 Mbps [23].
On the first level, the characteristic functions for proba-bilities of all potential coalitions among classes are calculated as follows:
𝑈 (𝐴) = max{54000 − (242 × 𝐾𝐵+ 500 × 𝐾𝐸) , 0} , 𝑈 (𝐵) = max{54000 − (32 × 𝐾𝐴+ 500 × 𝐾𝐸) , 0} , 𝑈 (𝐸) = max{54000 − (32 × 𝐾𝐴+ 242 × 𝐾𝐵) , 0} , 𝑈 (𝐴, 𝐵) = max{54000 − (500 × 𝐾𝐸) , 0} ,
𝑈 (𝐴, 𝐸) = max{54000 − (242 × 𝐾𝐵) , 0} , 𝑈 (𝐵, 𝐸) = max{54000 − (32 × 𝐾𝐴) , 0} , 𝑈 (𝐴, 𝐵, 𝐸) = 54000,
(12)
[image:5.600.310.549.99.226.2]where𝑈(𝐴),𝑈(𝐵), and𝑈(𝐸)are the utility of voice, video surveillance, and metering data, respectively, and 𝐾𝐴, 𝐾𝐵, and𝐾𝐸are the flow quantity of voice, video surveillance, and metering data, respectively.
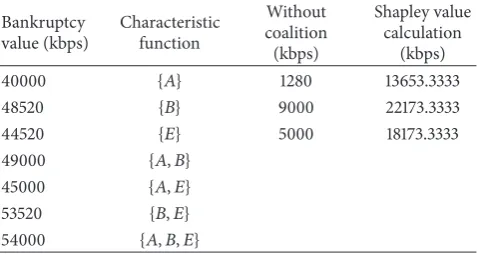
Table 2: With and without bankruptcy and shapely value calcula-tions.
Bankruptcy value (kbps)
Characteristic function
Without coalition (kbps)
Shapley value calculation
(kbps)
40000 {𝐴} 1280 13653.3333
48520 {𝐵} 9000 22173.3333
44520 {𝐸} 5000 18173.3333
49000 {𝐴, 𝐵}
45000 {𝐴, 𝐸}
53520 {𝐵, 𝐸}
54000 {𝐴, 𝐵, 𝐸}
Assume 80 users are assigned to the voice, video surveil-lance, and metering data applications (40, 30, and 10, resp.). Bankruptcy and shapely values are calculated, as shown in
Table 2.
As can be seen fromTable 2, the use of coalition concept will increase the bandwidth efficiency roughly up to 10, 2, and 3 times (voice, video, and metering data).
On the second level, TOPSIS prioritizes the class’s users for scheduling based on their criteria values and weighting coefficients. It is worth mentioning that these weights were experimentally selected because they showed a good perfor-mance. This experiment is inspired by trial-based technique which is based on considering different weight values and then simulates them. Consequently, after testing the upper and lower values from the experimental value, we ensure that the proper selection is done.
4. Results and Discussion
The simulation was conducted using LTE-Simulink built on C++ platform. One cell is considered in this scenario which includes noise and interferences. The propagation model such as simple path loss is based on the distance from the base station and multipath losses are used. Furthermore, shadowing based on log normal distribution (0 dB and 8 dB) and penetration loss with 12 dB is used. The fairness among each user is measured using Jain’s fairness method [24].
The proposed algorithm is conducted under two scenar-ios. The first scenario is dedicated to voice and video (real time applications) whereas the second scenario considers all applications including (real time and non-real time applica-tions). The purpose of the two scenarios is to demonstrate the robustness of the proposed algorithm.
10 20 30 40 50
Number of users
1000 1500 2000 2500 3000 3500 4000 4500 5000 5500 6000
Thr
o
u
gh
p
u
t (k
b
ps)
EXP-rule PF
[image:6.600.316.541.71.318.2]M-LWDF Proposed
Figure 2: Aggregate throughput of voice and video applications.
10 20 30 40 50
Number of users
EXP-rule
PF M-LWDF
Proposed
0 0.005 0.01 0.015 0.02 0.025 0.03 0.035
D
ela
[image:6.600.57.286.71.317.2]y (s)
Figure 3: Delay of voice and video applications.
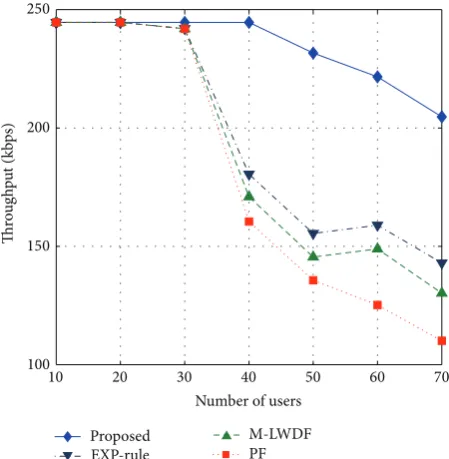
In the second scenario, all schemes show a good perfor-mance for the minimum data rate requirements (32 kbps) of the satisfied voice application, as shown inFigure 4. Further-more, referring toFigure 5, all the scheduling schemes met the video surveillance traffic requirements up to 30 users, but they dropped significantly (more than 30 users) except the proposed algorithm, which kept serving the video traffic up to 42 users (overloaded situation). In fact, the reason behind
10 20 30 40 50 60 70
Number of users
EXP-rule
PF M-LWDF
Proposed
30 30.5 31 31.5 32 32.5 33 33.5 34 34.5 35
Thr
o
u
gh
p
u
t (k
b
[image:6.600.57.286.355.607.2]ps)
Figure 4: Average throughput of voice application.
10 20 30 40 50 60 70
Number of users
EXP-rule PF
M-LWDF Proposed
Thr
o
u
gh
p
u
t (k
b
ps)
100 150 200 250
Figure 5: Average throughput for video surveillance application.
robustness of the proposed algorithm is the dynamic adjust-ment to smart grid application’s requireadjust-ments. PF showed the worst performance for video surveillance application since it is not concerned about the delay factor and it has been designed to serve non-real time applications. The average throughput for metering data flows is illustrated inFigure 6
[image:6.600.316.541.360.590.2]10 20 30 40 50 60 70
Number of users
EXP-rule PF
M-LWDF Proposed
Thr
o
u
gh
p
u
t (k
b
ps)
[image:7.600.318.540.72.314.2]250 300 350 400 450 500 550
Figure 6: Average throughput for metering data application.
10 20 30 40 50 60 70
Number of users
EXP-rule
PF M-LWDF
Proposed
Thr
o
u
gh
p
u
t (k
b
ps)
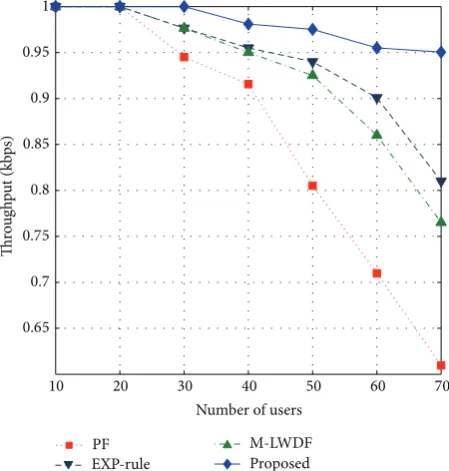
0.65 0.7 0.75 0.8 0.85 0.9 0.95 1
Figure 7: Average system fair index.
an overloaded situation since its metric is designed to serve users with high data rate and allow high tolerance in terms of delay, whereas EXP-rule shows the worst performance since it considers the end-to-end system delay regardless bandwidth requirements.
The proposed algorithm shows the highest fairness and lowest delay compared to the other schemes (Figures7and
8), in view of the fact that the proposed algorithm assigns higher weights to delay factors for real time applications, as
10 20 30 40 50 60 70
Number of users
EXP-rule
PF M-LWDF
Proposed
0 0.5 1 1.5 2 2.5 3 3.5 4 4.5 5
Sy
st
em dela
[image:7.600.59.284.72.314.2]y (s)
Figure 8: Average system delay.
mentioned earlier. In addition, all users (real and non-real time users) had a chance to be served (no starvation for non-real time applications). In contrast, PF shows the lowest fairness index and the highest delay since it is not concerned about the delay metric at all, and the probability of packet drop rate increases along with the number of users increases. As a result, PF failed to cover more than 30 users with respect to the traffics delay boundaries.
5. Conclusion
[image:7.600.58.283.357.593.2]Conflict of Interests
The authors declare that there is no conflict of interests regarding the publication of this paper.
Acknowledgments
This research work is supported by the Science Fund Grant (Grant no. SF002-2014) and University of Malaya Research Grant (UMRG) scheme (RG286-14AFR).
References
[1] A. Bari, J. Jiang, W. Saad, and A. Jaekel, “Challenges in the smart grid applications: an overview,”International Journal of Distributed Sensor Networks, vol. 2014, Article ID 974682, 11 pages, 2014.
[2] G. N. Korres and N. M. Manousakis, “State estimation and observability analysis for phasor measurement unit measured systems,”IET Generation, Transmission and Distribution, vol. 6, no. 9, pp. 902–913, 2012.
[3] Y. Xu and C. Fischione, “Real-time scheduling in LTE for smart grids,” inProceedings of the 5th International Symposium on Communications Control and Signal Processing (ISCCSP ’12), pp. 1–6, Rome, Italy, May 2012.
[4] F. Capozzi, G. Piro, L. A. Grieco, G. Boggia, and P. Camarda, “Downlink packet scheduling in LTE cellular networks: key design issues and a survey,”IEEE Communications Surveys and Tutorials, vol. 15, no. 2, pp. 678–700, 2013.
[5] S. Ali, M. Zeeshan, and A. Naveed, “A capacity and mini-mum guarantee-based service class-oriented scheduler for LTE networks,”EURASIP Journal on Wireless Communications and Networking, vol. 2013, article 67, 2013.
[6] S. Cho and S. K. Park, “Optimized scheduling technique of null subcarriers for peak power control in 3GPP LTE downlink,”The Scientific World Journal, vol. 2014, Article ID 279217, 8 pages, 2014.
[7] J.-G. Choi and S. Bahk, “Cell-throughput analysis of the pro-portional fair scheduler in the single-cell environment,”IEEE Transactions on Vehicular Technology, vol. 56, no. 2, pp. 766– 778, 2007.
[8] K. Kim, I. Koo, and S. Sung, “Multiple QoS support using M-LWDF in OFDMA adaptive resource allocation,” inProceedings of the 13th IEEE Workshop on Local and Metropolitan Area Networks (LANMAN ’04), pp. 217–222, April 2004.
[9] A. L. Stolyar and K. Ramanan, “Largest weighted delay first scheduling: large deviations and optimality,”Annals of Applied Probability, vol. 11, no. 1, pp. 1–48, 2001.
[10] R. Basukala, H. A. Mohd Ramli, and K. Sandrasegaran, “Performance analysis of EXP/PF and M-LWDF in downlink 3GPP LTE system,” in Proceedings of the 1st South Central Asian Himalayas Regional IEEE/IFIP International Conference on Internet (AH-ICI ’09), pp. 1–5, Kathmandu, Nepal, November 2009.
[11] H. Park and M. van der Schaar, “Bargaining strategies for net-worked multimedia resource management,”IEEE Transactions on Signal Processing, vol. 55, no. 7, pp. 3496–3511, 2007. [12] Z. Guan, D. Yuan, H. Zhang, and L. Ding, “Cooperative
bargaining solution for efficient and fair spectrum management in cognitive wireless networks,”International Journal of Com-munication Systems, vol. 59, no. 4, pp. 1969–1979, 2013.
[13] M. Iturralde, T. Ali Yahiya, A. Wei, and A.-L. Beylot, “Resource allocation using Shapley value in LTE networks,” inProceedings of the IEEE 22nd International Symposium on Personal, Indoor and Mobile Radio Communications (PIMRC ’11), pp. 31–35, Toronto, Canada, September 2011.
[14] M. B. Shahab, A. Hussain, and M. Shoaib, “Smart grid traf-fic modeling and scheduling using 3GPP LTE for eftraf-ficient communication with reduced RAN delays,” inProceedings of the 36th International Conference on Telecommunications and Signal Processing (TSP ’13), pp. 263–267, July 2013.
[15] N. Saputro, K. Akkaya, and S. Uludag, “A survey of routing protocols for smart grid communications,”Computer Networks, vol. 56, no. 11, pp. 2741–2771, 2012.
[16] R. Zhu, X. Tan, J. Yang et al., “An adaptive uplink resource allocation scheme for LTE in smart grid,”Journal of Commu-nications, vol. 8, no. 8, pp. 505–511, 2013.
[17] M. Iturralde, A. Wei, T. Ali-Yahiya, and A.-L. Beylot, “Resource allocation for real time services in lte networks: resource allocation using cooperative game theory and virtual token mechanism,”Wireless Personal Communications, vol. 72, no. 2, pp. 1415–1435, 2013.
[18] B. O’Neill, “A problem of rights arbitration from the Talmud,” Mathematical Social Sciences, vol. 2, no. 4, pp. 345–371, 1982. [19] L. S. Shapley, “A value for n-person games,” inContributions to
the Theory of Games, vol. 2 ofAnnals of Mathematical Studies, pp. 307–317, Princeton University Press, 1953.
[20] R. Sun, E. Ding, H. Jiang, R. Geng, and W. Chen, “Game theoretic approach in adapting QoS routing protocol for wireless multimedia sensor networks,”International Journal of Distributed Sensor Networks, vol. 2014, Article ID 745252, 5 pages, 2014.
[21] G. R. Jahanshahloo, F. H. Lotfi, and M. Izadikhah, “Extension of the TOPSIS method for decision-making problems with fuzzy data,”Applied Mathematics and Computation, vol. 181, no. 2, pp. 1544–1551, 2006.
[22] P. Rengaraju, C.-H. Lung, and A. Srinivasan, “Communica-tion requirements and analysis of distribu“Communica-tion networks using WiMAX technology for smart grids,” in Proceedings of the 8th IEEE International Wireless Communications and Mobile Computing Conference (IWCMC ’12), pp. 666–670, Limassol, Cyprus, August 2012.
[23] C. Cox, An Introduction to LTE: LTE, LTE-Advanced, SAE, VoLTE and 4G Mobile Communications, John Wiley & Sons, New York, NY, USA, 2014.
Submit your manuscripts at
http://www.hindawi.com
VLSI Design
Hindawi Publishing Corporation
http://www.hindawi.com Volume 2014
Machinery
Hindawi Publishing Corporation
http://www.hindawi.com Volume 2014 Hindawi Publishing Corporation http://www.hindawi.com
Journal of
Engineering
Volume 2014
Hindawi Publishing Corporation
http://www.hindawi.com Volume 2014
Shock and Vibration
Hindawi Publishing Corporation
http://www.hindawi.com Volume 2014 Mechanical
Engineering
Advances in
Hindawi Publishing Corporation
http://www.hindawi.com Volume 2014
Civil Engineering
Advances inAcoustics and VibrationAdvances in
Hindawi Publishing Corporation
http://www.hindawi.com Volume 2014
Hindawi Publishing Corporation
http://www.hindawi.com Volume 2014 Electrical and Computer Engineering
Journal of Hindawi Publishing Corporation
http://www.hindawi.com Volume 2014
Distributed Sensor Networks
International Journal of
The Scientific
World Journal
Hindawi Publishing Corporation
http://www.hindawi.com Volume 2014
Sensors
Journal of Hindawi Publishing Corporationhttp://www.hindawi.com Volume 2014
Modelling & Simulation in Engineering
Hindawi Publishing Corporation
http://www.hindawi.com Volume 2014
Hindawi Publishing Corporation
http://www.hindawi.com Volume 2014
Active and Passive Electronic Components Hindawi Publishing Corporation
http://www.hindawi.com Volume 2014
Chemical Engineering
International Journal of
Control Science and Engineering
Journal of
Hindawi Publishing Corporation
http://www.hindawi.com Volume 2014
Antennas and Propagation
International Journal of
Hindawi Publishing Corporation
http://www.hindawi.com Volume 2014
Hindawi Publishing Corporation
http://www.hindawi.com Volume 2014
Navigation and Observation
International Journal of
Advances in OptoElectronics
Hindawi Publishing Corporation
http://www.hindawi.com Volume 2014
Robotics
Journal ofHindawi Publishing Corporation