Separation of Plasma from Whole Blood by Use of the cobas
Plasma Separation Card: a Compelling Alternative to Dried
Blood Spots for Quantification of HIV-1 Viral Load
Sergio Carmona,
a,bBritta Seiverth,
cDieketseng Magubane,
bLucia Hans,
a,bMatthias Hoppler
caUniversity of the Witwatersrand, Faculty of Health Sciences, School of Pathology, Department of Molecular Medicine and Haematology, Johannesburg, South Africa bNational Health Laboratory Service, Johannesburg, South Africa
cRoche Diagnostics International AG, Rotkreuz, Switzerland
ABSTRACT
Plasma HIV viral load testing is the preferred means of monitoring
anti-retroviral treatment response. Dried blood spots (DBSs) hold considerable logistical
advantages over EDTA samples, but they more frequently misclassify virological
fail-ure and have higher limits of detection (LoD). Plasma separation cards (PSCs) may
overcome these limitations. Health workers collected EDTA whole blood by
veni-puncture and 140
l of finger-prick blood by capillary tube from 53 HIV-infected
adults. Capillary blood was immediately transferred to PSCs. Additionally, 432 EDTA
samples from HIV-infected adults were spotted onto PSCs and analyzed together
with the finger-prick samples. Specificity and sensitivity of PSC with paired EDTA-PSC
samples tested on a cobas 6800/8800 system with the cobas HIV-1 test (cobas HIV)
was determined. LoD (3rd HIV-1 WHO International Standard) and stability at a
range of temperatures and storage durations was determined using cobas HIV and
cobas AmpliPrep/cobas TaqMan HIV-1 test v2.0 (CAP/CTM). Of 132 specimens with
quantitative values for paired EDTA-PSC samples, the mean log
10difference between
samples was 0.05 copies/ml (95% confidence interval [CI],
⫺
0.01 to 0.11). The LoD
for cobas HIV was 790.2 copies/ml and for CAP/CTM was 737.9 copies/ml. At 1,000
copies/ml, PSC sensitivity was 97.0% (128/132) and specificity was 97.2% (343/353).
Results correlated well with those from EDTA samples (Deming
R
2⫽
0.90). PSC
re-sults were unaffected by temperature and storage conditions. PSC samples correlate
well with plasma viral load and have adequate sensitivity and specificity. The
im-proved performance may be as a result of a reduction in contribution from
cell-associated viral nucleic acids. The card provides an alternative sample collection
technology to DBSs.
KEYWORDS
HIV, viral load, cobas, dried blood spots, filter paper cards, HIV patient
monitoring, plasma, plasma separation card
P
resently, of the estimated 36.7 million people infected with HIV worldwide, about
20 million are receiving antiretroviral treatment (ART) (1). Those who are not yet
receiving ART are eligible for treatment regardless of their CD4 cell count or clinical
status, and concerted efforts are under way to ensure these patients are identified and
commence treatment. Once treatment begins, patients require careful monitoring of
their responses. Viral load is the most reliable monitoring tool and is preferred over
clinical assessment or immunological monitoring through CD4 enumeration (2). The
WHO recommends viral load testing biannually in the first year of treatment and
annually thereafter (3). Although viral load testing is increasingly becoming
avail-able, only about half of patients worldwide who are receiving ART have access to
these tests (1).
CitationCarmona S, Seiverth B, Magubane D, Hans L, Hoppler M. 2019. Separation of plasma from whole blood by use of the cobas plasma separation card: a compelling alternative to dried blood spots for quantification of HIV-1 viral load. J Clin Microbiol 57:e01336-18.
https://doi.org/10.1128/JCM.01336-18. EditorAngela M. Caliendo, Rhode Island Hospital
Copyright© 2019 Carmona et al. This is an open-access article distributed under the terms of theCreative Commons Attribution 4.0 International license.
Address correspondence to Sergio Carmona, [email protected].
Received17 August 2018
Returned for modification2 September 2018
Accepted23 January 2019
Accepted manuscript posted online6 February 2019
Published
crossm
28 March 2019
on May 17, 2020 by guest
http://jcm.asm.org/
While plasma is the preferred sample type, viral load measurement from plasma is
currently challenging in many settings. Challenges are especially marked in rural areas
due to the logistics of transporting plasma samples to centralized testing facilities and
the need for sophisticated laboratory infrastructure, qualified personnel, and stringent
storage requirements to maintain sample integrity (10). One potential alternative to
plasma samples has been the spotting of whole blood from a finger prick onto filter
paper that is allowed to dry (11–13). This “dried blood spot” (DBS) facilitates the
decentralization of specimen collection while maintaining high throughput at
central-ized laboratories where blood is eluted off the card for testing (3). The DBS is easy to
collect, does not require phlebotomy, minimizes infection risks, and can stabilize
biological material at ambient temperature during transport and storage. There are a
range of applications of DBSs within the HIV field, including testing for viral resistance
and antiretroviral drug levels (14–16), diagnosis of pediatric HIV infection, self-collection
of samples for HIV self-testing (17), and population surveillance, including for HIV
incidence and for measuring the impact of HIV treatment programs (18–20). Outside of
the HIV field, the DBS sample type is well known for enabling the measurement of
glucose (21), screening newborns for inherited metabolic disorders, and recent large
population-based surveys of infectious diseases, such as hepatitis B and C virus (22).
Although DBSs present many compelling advantages and are included in WHO
recommendations for measuring HIV-1 viral loads (3), they have several limitations (3).
Most notably, DBS samples can yield higher HIV viral load measurements than
plasma-based methods because proviral DNA and intracellular RNA found in whole blood
contribute to the HIV molecular signal (23). Viral load testing using DBS may thus
misclassify patients as having failed therapy, necessitating additional laboratory testing
and even unnecessary switching of treatment regimens. At the same time, there is a
concern that DBS samples containing only 50 to 100
l of whole blood may be
suboptimal for adequate representation of the viral population, with inadequate lower
limits of viral detection and false-negative results (5, 24).
Innovations in sample collection matrices that overcome the limitations of DBSs
could help address the large need for accurate viral load measures (25). This study
examined the performance of a novel plasma collection device, the cobas plasma
separation card (PSC), which shares many features of the DBS but which collects plasma
rather than whole blood. Using paired EDTA plasma and PSC samples, we examined the
card’s bias and misclassification at a viral load threshold of 1,000 copies/ml, as well as
its usability, limits of detection (LoD), and stability. A successful PSC approach would
retain the sample collection and transport advantages of the DBS but have improved
sensitivity, specificity, and reliability.
MATERIALS AND METHODS
The sensitivity component of the study was performed in the Development Laboratory at Roche Molecular Diagnostics International, Rotkreuz, Switzerland, from July to August 2017. All other study components were done in Johannesburg, South Africa, from May to September 2017. The Human Research Ethics Committee (Medical) of the University of the Witwatersrand (no. M160617) and the District Research Committee of Johannesburg approved the study. The health workers and laboratory technicians in the usability assessment gave written informed consent, as did patients who provided blood samples. Test results were not used for patient care. All analyses were done using SAS JMP v12.
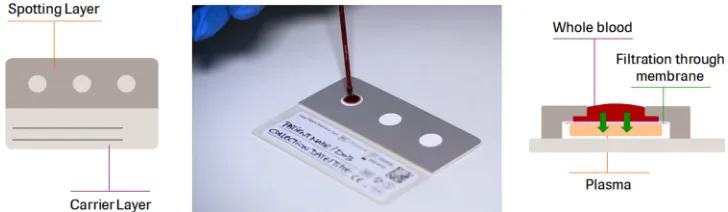
Description of the plasma separation card.The cobas plasma separation Card is a sampling device that is spotted with whole blood samples obtained from finger pricks or venous blood (140l blood per spot). A porous membrane allows only plasma to pass and to be collected on an underlying polyester fleece. The fleece is impregnated with an RNA-stabilizing reagent, which stabilizes the samples over a
on May 17, 2020 by guest
http://jcm.asm.org/
range of temperatures, humidity levels, and storage conditions. A defined area of the fleece (“the spot”) is then removed and subjected to an elution step before the obtained sample is loaded on either the cobas 6800/8800 system using the cobas HIV-1 test (cobas HIV) or the cobas AmpliPrep/cobas TaqMan HIV-1 test, v2.0 (CAP/CTM).
Usability assessment.Participants were recruited from three settings for the usability assessment, conducted per international guidelines (26, 27). First, six phlebotomists collected PSC finger-prick samples at an outpatient clinic of Charlotte Maxeke Johannesburg Academic Hospital (CMJAH), Johan-nesburg, South Africa. Thereafter, the PSC and its workflow were presented to twelve nurses and one clinic manager drawn from four primary care clinics. Finally, five technologists and medical scientists at the National Health Laboratory Service (NHLS) at CMJAH assessed the preparation and processing of the PSC prior to testing with cobas HIV. In all assessments, participants completed a Likert-type questionnaire covering usability statements for the PSC and its associated workflows.
PSC performance assessment: sample collection and preparation. A study nurse collected finger-prick blood samples using a safety lancet (MiniCollect safety lancet, with a penetration depth of 2.0 mm; Greiner Bio-One) from HIV-infected adults attending the HIV clinic at CMJAH (n⫽53). The nurse collected blood using an EDTA-coated capillary tube positioned directly beneath the puncture site, and 140l of blood was transferred onto each of three delineated areas of the card. Venous whole blood samples were then collected by venipuncture using EDTA tubes. We also prepared PSCs using leftover whole blood samples from HIV-infected patients who had recently had a CD4 cell count (n⫽185) or viral load test (n⫽241).
At the NHLS laboratory, the PSCs were placed in a single-use drying rack for a minimum of 4 h at room temperature. PSCs were then packed in separate gas-impermeable zip lock bags with a desiccant and stored at room temperature. In a laminar flow hood, the top layer of the PSC (the “spotting layer”), together with the membrane, was manually removed by pulling on a removable flap on the PSC and then discarded (Fig. 1). A single spot was removed with tweezers and transferred into a cryogenic tube (Cryo.sTM, 5 ml, PP, round bottom; Greiner Bio-One), to which 1,300l of cobas specimen preextraction reagent was added. Tubes were placed in a preheated thermomixer (Eppendorf 5355 Thermomixer R with Thermoblock for 24 cryotubes) with 1.5 ml Thermoblock and incubated for 10 min at 56°C and at 1,000 rpm. Thereafter, the tubes were uncapped and loaded into the system for testing. Whole blood in EDTA tubes was centrifuged to generate plasma.
Plasma samples (EDTA-plasma and PSC) were analyzed in single determinations using cobas HIV. Handling of systems, specimens, controls, and reagents was carried out according to procedures described in the cobas 8800 Systems User Guide, Publication version 3.0, software version 1.2. Execution of the study was performed using one cobas 8800 system. A single lot of PSC and a single lot of cobas specimen preextraction reagent were used. Assessments of the limits of detection (LoD) and sample stability were tested with both the cobas HIV and CAP/CTM assays. The cobas HIV LoD is 13.2 copies/ml, and the lower limit of quantification (LLOQ) is 20 copies/ml in plasma, using 0.5 ml of sample input volume. The CAP/CTM has an LoD of 16.5 copies/ml and an LLOQ of 20 copies/ml, using 0.85 ml of sample input volume. PSC results were not adjusted for hematocrit level.
PSC performance assessment: equivalency, sensitivity and specificity. To determine matrix (plasma type) equivalency, results from EDTA and PSC samples were compared and tested by cobas HIV. Samples with large differences between the viral load from EDTA and by PSC were also tested with CAP/CTM. We calculated the log10 viral load difference and the mean deviation between matched
samples. All valid results with a quantitative value of⬎0 copies/ml in both matrices (EDTA and PSC) were included in the equivalency calculation. A linear regression analysis using Deming regression was also conducted.
Test results generated for the matrix equivalency testing were analyzed to determine the sensitivity and specificity at a viral load threshold of 1,000 copies/ml (WHO recommended threshold for treatment failure) (3).
PSC performance assessment: limits of detection and stability assessments.Three independent dilution series of five concentration levels for HIV-1 (plus a blank control) were prepared by diluting positive spike-in panel members (HIV-1 group M subtype B from MVP899 cell culture supernatant) 1:100 in HIV-negative EDTA whole blood. The study panels were pipetted onto three different PSCs and multiple replicates tested using cobas HIV and CAP/CTM. A part of the first panel member was
FIG 1cobas plasma separation card showing the three spots (left) and how plasma is separated from whole blood in the spot (right).
on May 17, 2020 by guest
http://jcm.asm.org/
[image:3.585.39.403.71.177.2]centrifuged and titer assigned by the calibrator bracketing method using cobas HIV with the 3rd HIV-1 International Standard (WHO). Probit values were determined at the 95% hit rate, together with the lowest panel member with at least a 95% reactive rate.
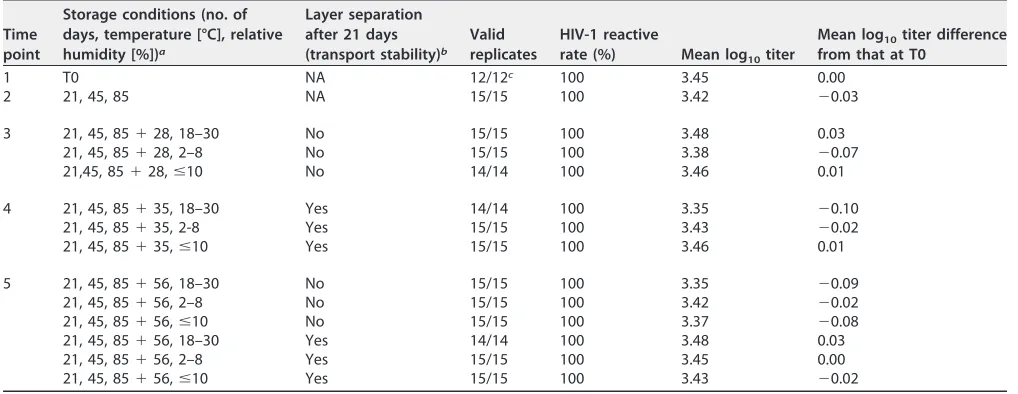
To assess stability, PSCs were prepared using HIV-negative whole blood that had been spiked with HIV-1 at approximately five times the LoD. Viral load was measured in control PSC, with the remainder evaluated after being stored for various time periods at temperatures ranging from⫺10°C or lower to 45°C and at a humidity of 85%.
RESULTS
Usability.
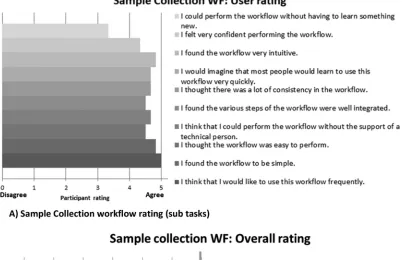
The phlebotomists rated the sample collection positively, scoring most
subtasks above 4 out of 5 (“agree”) (Figs 2A and B). The lancet, capillary tube, and
workflow were considered user friendly. However, the phlebotomists—who had not
been trained— had some difficulties obtaining sufficient samples, determining when
the capillary was adequately filled with blood, obtaining samples without air bubbles,
and applying the correct amount of blood to the PSC. Of the 51 capillaries collected, 5
clotting events occurred, due to air bubbles in the tube or delays in spotting the blood
on the PSC. Once these phlebotomists became familiar with the use of capillary tubes,
their performance improved markedly. Health care workers participating in the study
believed that the PSC would be very useful in their setting. A few health workers
believed that the sample collection workflow did not appear user friendly, mainly due
to the use of a capillary and the volume of blood to be collected.
Laboratory staff rated all the subtasks in the preanalytical workflow assessment as
above 4 (“agree”). A few errors occurred on isolation of the spot and application, in
which the filtration membrane was transferred rather than the spot. Overall, however,
across all components of the usability assessment, no critical product risks were
identified.
FIG 2Usability assessment of sample collection workflow.
on May 17, 2020 by guest
http://jcm.asm.org/
[image:4.585.50.455.78.338.2]Equivalency, sensitivity, and specificity.
A total of 535 PSCs were processed, of
which 23 yielded invalid results (4.3%), 9 were duplicates (1.7%), 6 had no paired
plasma viral load results (1.1%) and 8 had no HIV-positive status confirmed (1.5%). Of
the 521 EDTA-plasma samples processed, 19 were invalid (3.6%). A further 13 samples
were excluded; 1 was a duplicate, 4 had no paired PSC result, and 8 had no HIV-positive
status confirmed. Additionally, 4 tests on both PSC and EDTA-plasma were excluded
due to operator errors.
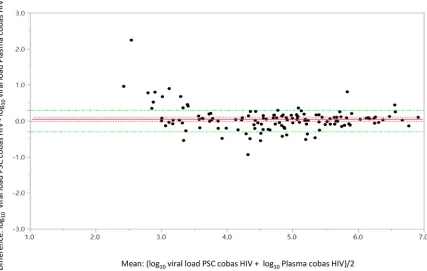
A total of 485 samples had valid paired EDTA and PSC results; of these, 132 samples
had quantifiable results for both matrices. The overall mean log
10difference in titer
between EDTA-plasma and PSC-plasma was 0.05 (95% confidence interval [CI],
⫺
0.01 to
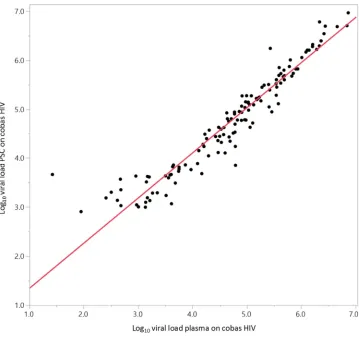
0.11; Fig. 3). The Deming regression analysis line slope was 0.92, the
y
intercept was
0.42, and
R
2was 0.90 (Fig. 4).
Analysis of all 485 paired EDTA and PSC samples at a 1,000 copies/ml threshold
using the cobas HIV yielded a sensitivity of 97.0% (128/132; 95% CI, 92.4 to 99.2%) and
specificity of 97.2% (343/353; 95% CI, 94.9 to 98.6%). In the 14 specimens with
discordant EDTA and PSC results, almost all had a viral load of around 1,000 copies/ml,
with a median log
10titer of 3.13 (interquartile range [IQR]
⫽
3.00 to 3.35). The median
log
10difference between the PSC and plasma viral load for the misclassified specimens
was 0.60 (IQR
⫽ ⫺
0.14 to 0.80). No differences in findings were noted by sample type.
Limits of detection and stability.
The viral load of 63 replicates per concentration
level were measured in the LoD assessment (Table 1). Based on probit analysis for all
PSC lots combined, the LoD was 790.2 copies/ml with cobas HIV (95% CI, 658.9 to
1,003.6 copies/ml) and 737.9 copies/ml with CAP/CTM (95% CI, 614.3 to 938.5 copies/
ml). For each of the storage conditions listed in Table 2, there was a 100% detection rate
for HIV. The mean difference between the stored specimens and the controls was
⬍
0.2
log
10copies/ml for all the stability conditions assessed.
FIG 3Bland-Altman graph for matrix (plasma type) equivalency with the cobas HIV-1 test, showing the difference in matched pairs in log10
titer PSC-log10titer plasma (mean difference, 0.05; standard error, 0.03; upper 95%, 0.11; lower 95%,⫺0.01;n⫽132. A total of 353 samples
did not have a quantifiable result on both matrices; 333 were target not detected, 13 were below the limit of detection, and 7 were above the limit of detection).
on May 17, 2020 by guest
http://jcm.asm.org/
[image:5.585.45.472.73.344.2]DISCUSSION
The PSC performed well in measures of equivalency, LoD, and sample stability. Most
importantly, the mean deviation of the log
10viral load between PSC and matched
EDTA-plasma specimens was 0.05 log10, suggesting that the card is adequate for use
[image:6.585.43.402.69.406.2]FIG 4Deming regression for matrix (plasma type) equivalency with the cobas HIV-1 test.
TABLE 1Limits of detection of the plasma separation card for cobas HIVb
Concn (copies/ml) No. of valid samplesa No. of reactive samples Detection rate (%)
1,971.1 62 62 100.0
1,925.3 63 63 100.0
1,358.1 62 62 100.0
985.5 63 62 98.4
962.6 63 62 98.4
679 63 59 93.7
657 63 59 93.7
641.8 63 57 90.5
452.7 63 52 82.5
328.5 63 47 74.6
320.9 63 46 73.0
226.3 62 49 79.0
164.3 63 36 57.1
160.4 63 35 55.6
113.2 63 38 60.3
0 63 0 0.0
0 63 0 0.0
0 63 0 0.0
aSome sample sizes were⬍63 due to an insufficient number of spots. Data for limit of detection analysis for
CAP/CTM are not shown.
bLimit of detection by probit analysis (95% hit rate), 790.2 copies/ml. 95% confidence interval (CI), 658.9 to
1,003.6 copies/ml. Lowest panel member withⱖ95% reactive rate, 962.6 copies/ml 98.4% (62/63); 95% CI⫽91.5 to 100.0%; lower one-sided 95% CI⫽92.7%.
on May 17, 2020 by guest
http://jcm.asm.org/
[image:6.585.41.370.507.694.2]in the monitoring of HIV viral load. The rate of upward misclassification of results, where
specimens are incorrectly categorized as being above 1,000 copies/ml or virological
failure, was 3%. This is considerably lower than that in many reports of DBS analyses,
where upward misclassification rates can reach 10 to 15% or higher (25, 28). The LoD
of around 750 copies/ml with cobas HIV and with CAP/CTM is considerably higher than
that with EDTA specimens on those systems (around 20 copies/ml).
Even with the introduction of point-of-care viral load devices, it is expected that DBS
and related technologies, such as the PSC, will remain relevant tools for expanding
access to viral load monitoring. This is especially true in rural settings, but also even in
some of the urban clinics visited in this study. There is clearly a need, however, for
optimizing the performance of DBS technologies. The impact of interference of
cell-associated viral nucleic acids in viral load measures is highest when plasma viral load
is low, as in patients successfully treated with ART. Indeed, most DBSs perform poorly
at thresholds of around 1,000 copies/ml (25, 29–31). Several DBS protocols have been
designed to minimize the contribution of cell-associated viral nucleic acid by selectively
purifying RNA during sample preparation or by preferentially eluting plasma-associated
virus from a DBS, with some success (32, 33). The PSC described in this paper presents
a novel, alternative strategy for overcoming this vexing problem.
[image:7.585.40.549.83.280.2]The stability of the PSC is reassuring, indicating that a specimen collected with the
PSC can be transported for at least 28 days and then stored for 56 days at a wide range
of temperatures without compromising the HIV viral load result. Although DBS
speci-mens generally have high levels of stability (34–36), some evidence suggests that
caution is still required in this regard (37). Overall, the sample collection and the
preanalytical workflow of the PSC appear to be of low complexity and user friendly,
especially once staff become familiar with the procedures. The usability findings,
however, highlighted areas that need to be foregrounded in the training and
docu-mentation that accompany the card. These mostly concern the correct use of capillary
tubes to avoid blood clots and to ensure correct spotting of the PSC. Rates of invalid
samples linked to the PSC specimens were around 4% and would likely reduce as health
workers become more proficient in sample collection. Health workers are increasingly
familiar with collecting DBS samples, and this expertise would likely be transferable to
PSC use. Having multiple spots on the PSC is a strength of the card, allowing for repeat
testing or for additional tests to be done. Collection of three samples of relatively high
volume, however, may raise the likelihood of blood clots and pose challenges for health
workers, especially with pediatric patients.
TABLE 2Clinical specimen stability results
Time point
Storage conditions (no. of days, temperature [°C], relative humidity [%])a
Layer separation after 21 days (transport stability)b
Valid replicates
HIV-1 reactive
rate (%) Mean log10titer
Mean log10titer difference from that at T0
1 T0 NA 12/12c 100 3.45 0.00
2 21, 45, 85 NA 15/15 100 3.42 ⫺0.03
3 21, 45, 85⫹28, 18–30 No 15/15 100 3.48 0.03
21, 45, 85⫹28, 2–8 No 15/15 100 3.38 ⫺0.07
21,45, 85⫹28,ⱕ10 No 14/14 100 3.46 0.01
4 21, 45, 85⫹35, 18–30 Yes 14/14 100 3.35 ⫺0.10
21, 45, 85⫹35, 2-8 Yes 15/15 100 3.43 ⫺0.02
21, 45, 85⫹35,ⱕ10 Yes 15/15 100 3.46 0.01
5 21, 45, 85⫹56, 18–30 No 15/15 100 3.35 ⫺0.09
21, 45, 85⫹56, 2–8 No 15/15 100 3.42 ⫺0.02
21, 45, 85⫹56,ⱕ10 No 15/15 100 3.37 ⫺0.08
21, 45, 85⫹56, 18–30 Yes 14/14 100 3.48 0.03
21, 45, 85⫹56, 2–8 Yes 15/15 100 3.45 0.00
21, 45, 85⫹56,ⱕ10 Yes 15/15 100 3.43 ⫺0.02
aT0, time of initial measurement. bn/a, not applicable.
cCould not repeat as no additional T0 samples were available.
on May 17, 2020 by guest
http://jcm.asm.org/
In conclusion, a technology that allows for the collection of plasma using
finger-prick specimens would retain the sample collection and transport advantages of a DBS
but produce plasma as the testing matrix; this is a major development for the field. The
findings presented here on the performance and usability of the PSC are promising.
This technology supports the efforts to scale up viral load testing, which is essential for
ART monitoring, and indeed, most importantly, for the achieving of the “third 90.”
Success of the ongoing global rollout of antiretroviral treatment depends in no small
measure on the levels of access to and quality of tests for monitoring of viral loads.
ACKNOWLEDGMENTS
We are grateful for the contributions of Zukiswa Mahlumba, Ana Carrasco Duran,
Sabrina Deuring and Suchitra Suresh Kumar. We thank Ellen Paxinos, Christian O.
Simon, and Ed Marins for critical review of the manuscript. Professional writing
assis-tance was provided by Matthew Chersich, Wits Reproductive Health and HIV Institute,
University of the Witwatersrand, South Africa. M.C.’s contribution entailed writing
assistance and technical editing. We also thank the CMJAH staff of the HIV PCR
laboratory, as well as all the study participants.
The study was partly funded through Roche Diagnostics International AG, Rotkreuz,
Switzerland.
The CMJAH laboratory unit received research support from Roche Molecular
Diag-nostics, Inc., to partly fund this study. S.C., D.M., and L.H. are full-time employees of the
National Health Laboratory Service, Johannesburg, South Africa. B.S. and M.H. are
employees of Roche Diagnostics International AG, Rotkreuz, Switzerland.
REFERENCES
1. Joint United Nations Programme on HIV/AIDS (UNAIDS). 2017. Ending AIDS: progress towards the 90-90-90 targets. UNAIDS/JC2900E. UNAIDS, Geneva, Switzerland.
2. Rutherford GW, Anglemyer A, Easterbrook PJ, Horvath T, Vitoria M, Penazzato M, Doherty MC. 2014. Predicting treatment failure in adults and children on antiretroviral therapy: a systematic review of the per-formance characteristics of the 2010 WHO immunologic and clinical criteria for virologic failure. AIDS 28:S161–S169.https://doi.org/10.1097/ QAD.0000000000000236.
3. WHO. 2017. What’s new in treatment monitoring: viral load and CD4 testing? WHO, Geneva, Switzerland.
4. Barth RE, van der Loeff MF, Schuurman R, Hoepelman AI, Wensing AM. 2010. Virological follow-up of adult patients in antiretroviral treatment programmes in sub-Saharan Africa: a systematic review. Lancet Infect Dis 10:155–166.https://doi.org/10.1016/S1473-3099(09)70328-7.
5. Phillips A, Shroufi A, Vojnov L, Cohn J, Roberts T, Ellman T, Bonner K, Rousseau C, Garnett G, Cambiano V, Nakagawa F, Ford D, Bansi-Matharu L, Miners A, Lundgren JD, Eaton JW, Parkes-Ratanshi R, Katz Z, Maman D, Ford N, Vitoria M, Doherty M, Dowdy D, Nichols B, Murtagh M, Wareham M, Palamountain KM, Chakanyuka Musanhu C, Stevens W, Katzenstein D, Ciaranello A, Barnabas R, Braithwaite RS, Bendavid E, Nathoo KJ, van de Vijver D, Wilson DP, Holmes C, Bershteyn A, Walker S, Raizes E, Jani I, Nelson LJ, Peeling R, Terris-Prestholt F, Murungu J, Mutasa-Apollo T, Hallett TB, Revill P. 2015. Sustainable HIV treatment in Africa through viral-load-informed differentiated care. Nature 528:S68 –S76.https://doi .org/10.1038/nature16046.
6. Sigaloff KC, Hamers RL, Wallis CL, Kityo C, Siwale M, Ive P, Botes ME, Mandaliya K, Wellington M, Osibogun A, Stevens WS, van Vugt M, de Wit TF. 2011. Unnecessary antiretroviral treatment switches and
accumula-tion of HIV resistance mutaaccumula-tions; two arguments for viral load monitor-ing in Africa. J Acquir Immune Defic Syndr 58:23–31.https://doi.org/10 .1097/QAI.0b013e318227fc34.
7. Rawizza HE, Chaplin B, Meloni ST, Eisen G, Rao T, Sankale JL, Dieng-Sarr A, Agbaji O, Onwujekwe DI, Gashau W, Nkado R, Ekong E, Okonkwo P, Murphy RL, Kanki PJ, APIN PEPFAR Team. 2011. Immunologic criteria are poor predictors of virologic outcome: implications for HIV treatment monitoring in resource-limited settings. Clin Infect Dis 53:1283–1290.
https://doi.org/10.1093/cid/cir729.
8. van Oosterhout JJ, Brown L, Weigel R, Kumwenda JJ, Mzinganjira D, Saukila N, Mhango B, Hartung T, Phiri S, Hosseinipour MC. 2009. Diag-nosis of antiretroviral therapy failure in Malawi: poor performance of clinical and immunological WHO criteria. Trop Med Int Health 14: 856 – 861.https://doi.org/10.1111/j.1365-3156.2009.02309.x.
9. Joint United Nations Programme on HIV/AIDS (UNAIDS). 2014. 90-90-90: an ambitious treatment target to help end the AIDS epidemic. UNAIDS/ JC2684. UNAIDS, Geneva, Switzerland.
10. Carmona S, Peter T, Berrie L. 2017. HIV viral load scale-up: multiple interventions to meet the HIV treatment cascade. Curr Opin HIV AIDS 12:157–164.https://doi.org/10.1097/COH.0000000000000352. 11. Parker SP, Cubitt WD. 1999. The use of the dried blood spot sample in
epidemiological studies. J Clin Pathol 52:633– 639. https://doi.org/10 .1136/jcp.52.9.633.
12. McAllister G, Shepherd S, Templeton K, Aitken C, Gunson R. 2015. Long term stability of HBsAg, anti-HBc and anti-HCV in dried blood spot samples and eluates. J Clin Virol 71:10 –17.https://doi.org/10.1016/j.jcv .2015.07.303.
13. Greenman J, Roberts T, Cohn J, Messac L. 2015. Dried blood spot in the genotyping, quantification and storage of HCV RNA: a systematic
on May 17, 2020 by guest
http://jcm.asm.org/
literature review. J Viral Hepat 22:353–361.https://doi.org/10.1111/ jvh.12345.
14. Singh D, Dhummakupt A, Siems L, Persaud D. 2017. Alternative sample types for HIV-1 antiretroviral drug resistance testing. J Infect Dis 216: S834 –S837.https://doi.org/10.1093/infdis/jix386.
15. Waitt C, Diliiy Penchala S, Olagunju A, Amara A, Else L, Lamorde M, Khoo S. 2017. Development, validation and clinical application of a method for the simultaneous quantification of lamivudine, emtricitabine and teno-fovir in dried blood and dried breast milk spots using LC-MS/MS. J Chromatogr B Analyt Technol Biomed Life Sci 1060:300 –307.https://doi .org/10.1016/j.jchromb.2017.06.012.
16. Calcagno A, Motta I, Milia MG, Rostagno R, Simiele M, Libanore V, Fontana S, D’Avolio A, Ghisetti V, Di Perri G, Bonora S. 2015. Dried plasma/blood spots for monitoring antiretroviral treatment efficacy and pharmacokinetics: a cross-sectional study in rural Burundi. Br J Clin Pharmacol 79:801– 808.https://doi.org/10.1111/bcp.12544.
17. van Loo IHM, Dukers-Muijrers N, Heuts R, van der Sande MAB, Hoebe C. 2017. Screening for HIV, hepatitis B and syphilis on dried blood spots: a promising method to better reach hidden high-risk populations with self-collected sampling. PLoS One 12:e0186722.https://doi.org/10.1371/ journal.pone.0186722.
18. Schlusser KE, Pilcher C, Kallas EG, Santos BR, Deeks SG, Facente S, Keating SM, Busch MP, Murphy G, Welte A, Quinn T, Eshleman SH, Laeyendecker O. 2017. Comparison of cross-sectional HIV incidence assay results from dried blood spots and plasma. PLoS One 12:e0172283.
https://doi.org/10.1371/journal.pone.0172283.
19. Sinunu MA, Schouten EJ, Wadonda-Kabondo N, Kajawo E, Eliya M, Moyo K, Chimbwandira F, Strunin L, Kellerman SE. 2014. Evaluating the impact of prevention of mother-to-child transmission of HIV in Malawi through immunization clinic-based surveillance. PLoS One 9:e100741.https://doi .org/10.1371/journal.pone.0100741.
20. Rutstein SE, Hosseinipour MC, Kamwendo D, Soko A, Mkandawire M, Biddle AK, Miller WC, Weinberger M, Wheeler SB, Sarr A, Gupta S, Chimbwandira F, Mwenda R, Kamiza S, Hoffman I, Mataya R. 2015. Dried blood spots for viral load monitoring in Malawi: feasible and effective. PLoS One 10:e0124748.https://doi.org/10.1371/journal.pone.0124748. 21. Hannon WH, Therell BL, Jr. 2014. Overview of the history and
applica-tions of dried blood spot samples, p. 3–15.InLi W, Lee MS (ed), Dried blood spots: applications and techniques. Wiley, Hoboken, NJ. 22. Parr JB, Lodge EK, Holzmayer V, Pepin J, Frost EH, Fried MW, McGivern
DR, Lemon SM, Keeler C, Emch M, Mwandagalirwa K, Tshefu A, Fwamba F, Muwonga J, Meshnick SR, Cloherty G. 2017. An efficient, large-scale survey of hepatitis C viremia in the Democratic Republic of the Congo using dried blood spots. Clin Infect Dis 66:254 –260.https://doi.org/10 .1093/cid/cix771.
23. Zida S, Tuaillon E, Barro M, Kwimatouo Lekpa Franchard A, Kagone T, Nacro B, Ouedraogo AS, Bollore K, Sanosyan A, Plantier JC, Meda N, Sangare L, Rouzioux C, Rouet F, Kania D. 2016. Estimation of HIV-1 DNA level interfering with reliability of HIV-1 RNA quantification performed on dried blood spots collected from successfully treated patients. J Clin Microbiol 54:1641–1643.https://doi.org/10.1128/JCM.03372-15. 24. Parkin NT. 2014. Measurement of HIV-1 viral load for drug resistance
surveillance using dried blood spots: literature review and modeling of contribution of DNA and RNA. AIDS Rev 16:160 –171.
25. Guichet E, Serrano L, Laurent C, Eymard-Duvernay S, Kuaban C, Vidal L, Delaporte E, Ngole EM, Ayouba A, Peeters M. 2018. Comparison of different nucleic acid preparation methods to improve specific HIV-1 RNA isolation for viral load testing on dried blood spots. J Virol Methods 251:75–79.https://doi.org/10.1016/j.jviromet.2017.10.014.
26. U.S. Department of Health and Human Services, Food and Drug Admin-istration, Center for Devices and Radiological Health, Office of Device
Evaluation. 2016. Applying human factors and usability engineering to medical devices. Guidance for industry and Food and Drug Administra-tion staff. FDA-2011-D-0469. U.S. FDA, Silver Spring, MD.
27. International Organization for Standardization. 2015. Medical devices – part 1: application of usability engineering to medical devices. IEC 62366-1:2015. International Organization for Standardization, Geneva, Switzerland.
28. Smit PW, Sollis KA, Fiscus S, Ford N, Vitoria M, Essajee S, Barnett D, Cheng B, Crowe SM, Denny T, Landay A, Stevens W, Habiyambere V, Perriens JH, Peeling RW. 2014. Systematic review of the use of dried blood spots for monitoring HIV viral load and for early infant diagnosis. PLoS One 9:e86461.https://doi.org/10.1371/journal.pone.0086461.
29. Schmitz ME, Agolory S, Junghae M, Broyles LN, Kimeu M, Ombayo J, Umuro M, Mukui I, Alwenya K, Baraza M, Ndiege K, Mwalili S, Rivadeneira E, Ng’ang’a L, Yang C, Zeh C. 2017. Field evaluation of dried blood spots for HIV-1 viral load monitoring in adults and children receiving antiret-roviral treatment in Kenya: implications for scale-up in resource-limited settings. J Acquir Immune Defic Syndr 74:399 – 406.https://doi.org/10 .1097/QAI.0000000000001275.
30. Chang J, de Sousa A, Sabatier J, Assane M, Zhang G, Bila D, Vaz P, Alfredo C, Cossa L, Bhatt N, Koumans EH, Yang C, Rivadeneira E, Jani I, Houston JC. 2017. Performance characteristics of finger-stick dried blood spots (DBS) on the determination of human immunodeficiency virus (HIV) treatment failure in a pediatric population in Mozambique. PLoS One 12:e0181054.https://doi.org/10.1371/journal.pone.0181054.
31. Sawadogo S, Shiningavamwe A, Chang J, Maher AD, Zhang G, Yang C, Gaeb E, Kaura H, Ellenberger D, Lowrance DW. 2014. Limited utility of dried-blood- and plasma spot-based screening for antiretroviral treat-ment failure with Cobas Ampliprep/TaqMan HIV-1 version 2.0. J Clin Microbiol 52:3878 –3883.https://doi.org/10.1128/JCM.02063-14. 32. Wu X, Crask M, Ramirez H, Landas T, Do TD, Honisch C, Will S, Baum PD.
2015. A simple method to elute cell-free HIV from dried blood spots improves their usefulness for monitoring therapy. J Clin Virol 65:38 – 40.
https://doi.org/10.1016/j.jcv.2015.01.022.
33. Makadzange AT, Boyd FK, Chimukangara B, Masimirembwa C, Katzen-stein D, Ndhlovu CE. 2017. A simple phosphate-buffered-saline-based extraction method improves specificity of HIV viral load monitoring using dried blood spots. J Clin Microbiol 55:2172–2179.https://doi.org/ 10.1128/JCM.00176-17.
34. Monleau M, Aghokeng AF, Eymard-Duvernay S, Dagnra A, Kania D, Ngo-Giang-Huong N, Toure-Kane C, Truong LXT, Chaix M-L, Delaporte E, Ayouba A, Peeters M, Tang Y-W. 2014. Field evaluation of dried blood spots for routine HIV-1 viral load and drug resistance monitoring in patients receiving antiretroviral therapy in Africa and Asia. J Clin Micro-biol 52:578 –586.https://doi.org/10.1128/JCM.02860-13.
35. Monleau M, Butel C, Delaporte E, Boillot F, Peeters M. 2010. Effect of storage conditions of dried plasma and blood spots on HIV-1 RNA quantification and PCR amplification for drug resistance genotyping. J Antimicrob Chemother 65:1562–1566.https://doi.org/10.1093/jac/ dkq205.
36. Wu G, Zaman MH. 2012. Low-cost tools for diagnosing and monitoring HIV infection in low-resource settings. Bull World Health Organ 90: 914 –920.https://doi.org/10.2471/BLT.12.102780.
37. Aitken SC, Wallis CL, Stevens W, de Wit TR, Schuurman R. 2015. Stability of HIV-1 nucleic acids in dried blood spot samples for HIV-1 drug resistance genotyping. PLoS One 10:e0131541.https://doi.org/10.1371/ journal.pone.0131541.
38. WHO. 2016. Consolidated guidelines on the use of antiretroviral drugs for treating and preventing HIV infection: recommendations for a public health approach, 2nd ed. WHO, Geneva, Switzerland.