R E S E A R C H
Open Access
Sequence-based ultra-dense genetic and
physical maps reveal structural variations of
allopolyploid cotton genomes
Sen Wang
†, Jiedan Chen
†, Wenpan Zhang, Yan Hu, Lijing Chang, Lei Fang, Qiong Wang, Fenni Lv, Huaitong Wu,
Zhanfeng Si, Shuqi Chen, Caiping Cai, Xiefei Zhu, Baoliang Zhou, Wangzhen Guo
*and Tianzhen Zhang
*Abstract
Background:SNPs are the most abundant polymorphism type, and have been explored in many crop genomic studies, including rice and maize. SNP discovery in allotetraploid cotton genomes has lagged behind that of other crops due to their complexity and polyploidy. In this study, genome-wide SNPs are detected systematically using next-generation sequencing and efficient SNP genotyping methods, and used to construct a linkage map and characterize the structural variations in polyploid cotton genomes.
Results:We construct an ultra-dense inter-specific genetic map comprising 4,999,048 SNP loci distributed unevenly in 26 allotetraploid cotton linkage groups and covering 4,042 cM. The map is used to order tetraploid cotton genome scaffolds for accurate assembly ofG. hirsutumacc. TM-1. Recombination rates and hotspots are identified across the cotton genome by comparing the assembled draft sequence and the genetic map. Using this map, genome rearrangements and centromeric regions are identified in tetraploid cotton by combining information from the publicly-availableG. raimondiigenome with fluorescentin situhybridization analysis.
Conclusions:We report the genotype-by-sequencing method used to identify millions of SNPs betweenG. hirsutum andG. barbadense. We construct and use an ultra-dense SNP map to correct sequence mis-assemblies, merge scaffolds into pseudomolecules corresponding to chromosomes, detect genome rearrangements, and identify centromeric regions in allotetraploid cottons. We find that the centromeric retro-element sequence of tetraploid cotton derived from the D subgenome progenitor might have invaded the A subgenome centromeres after allotetrapolyploid formation. This study serves as a valuable genomic resource for genetic research and breeding of cotton.
Background
Single nucleotide polymorphisms (SNPs) are the most abundant and universal sequence variation across whole genomes, making them attractive markers for the gen-etic analysis of plants. It is estimated that one SNP oc-curs every 100 to 300 bp in any genome [1], showing a frequency one magnitude higher than that of simple se-quence repeats (SSRs) and other molecular markers [2]. Thus SNP markers are ideal molecular markers for the construction of saturated genetic maps, cloning genes, and quantitative trait loci (QTLs) that control important
agronomical traits, marker-assisted crop breeding [3–6], investigating genetic diversity and population structure [7], genome-wide association studies (GWAS) [8], and even to serve as a robust framework for genome assem-bly [9]. SNP detection was revolutionized by the rapid development of high-throughput next-generation se-quencing (NGS) technologies, which generate millions of high quality sequences rapidly and cost-effectively. Through large-scale genome sequencing, high-density haplotype maps containing millions of SNPs have been constructed for rice [10] and maize [11]. However, genome-wide SNP discovery in polyploidy crops is still challenging owing to their large, highly repetitive se-quence and three or more subgenomes nature. The large genome size increases the whole genome sequencing cost, and the polyploidization makes the identification of * Correspondence:[email protected];[email protected]
†Equal contributors
State Key Laboratory of Crop Genetics and Germplasm Enhancement, Cotton Hybrid R & D Engineering Center (the Ministry of Education), Nanjing Agricultural University, Nanjing 210095, China
© 2015 Wang et al. This is an Open Access article distributed under the terms of the Creative Commons Attribution License (http://creativecommons.org/licenses/by/4.0), which permits unrestricted use, distribution, and reproduction in any medium, provided the original work is properly credited. The Creative Commons Public Domain Dedication waiver (http:// creativecommons.org/publicdomain/zero/1.0/) applies to the data made available in this article, unless otherwise stated.
Wanget al. Genome Biology (2015) 16:108
SNPs more complicated, since a large number of homo-eologous and paralogous sequences in genomes results in the discovery of many non-allelic SNPs, which are of no use in genetic studies. In order to discover SNPs at a genome-wide level and to reduce the complexity of plant genomes, several techniques, such as complexity reduction of polymorphic sequences (CRoPS) [12], re-striction site associated DNA (RAD) [13], genotyping-by-sequencing (GBS) [14], and sequence-based genotyping (SBG) [15], have been used in SNP discovery. Additionally, SNPs within genes can be explored via transcriptome se-quencing [5], which has been successfully applied to SNP detection in many species including maize [16], wheat [17], and rape [18]. Nevertheless, these techniques are tar-geted and based on small areas of genomes, such that the information gained on SNPs cannot cover sequence vari-ation across the whole genome.
In most eukaryotes, the centromere is an essential chromosomal region and usually contains high-copy-number retrotransposons and satellite repeats, which are highly diverse and difficult to map, clone, and sequence. The precise position of the centromere determines the relative positions and linkage relationship between markers in or near the centromere region. Even though the identification of centromeres on genetic maps has been difficult due to highly repetitive sequence and low recombination rate in centromeric region [19, 20], cen-tromeres have been localized to genetic maps in several plants, such as rice [21], maize [22], Arabidopsis [23], andG. raimondii[24].
Cotton is an important textile and oil crop throughout the world. The cotton species include two commercially important cultivated allotetraploid species, G. hirsutum
L. and G. barbadense L., which have a genome size of 2.5 Gb and large numbers of repetitive sequences derived from an allopolyploidization event betweenG. herbaceum
L. (A1) andG. raimondii(D5) Ulbrich approximately 1 to
2 million years ago (MYA) [25]. Due to its complexity, studies on the structure of the cotton genome have lagged behind those of other important crops such as rice and maize. Interspecific crosses between G. hirsutum and G. barbadense have been widely used to develop inter-specific maps because of the lack of polymorphisms be-tween the intra-species [26–33]. However, these maps are
not dense enough to support high-resolution mapping and genetic association studies. It is therefore important to build a well-saturated genetic map to allow deeper gen-etic research and breeding of this important fiber crop. SNP discovery in cotton was only initiated in recent years, and only a small number of SNP markers have been identi-fied in the cotton genome, therefore few SNP markers were available in existing genetic maps constructed [34–36].
Here, we constructed an ultra-dense genetic map of al-lotetraploid cotton consisting of nearly 5 million SNPs (Additional file 1) with the largest amount of sequence variation identified in two cultivated allotetraploid cottons to date. This genetic map was used to improve the Upland cotton reference genome assembly, to detect genome rear-rangements, and to identify centromeric regions of allote-traploid cotton. Ultimately, this precision and high-resolution genetic linkage map will serve as a valuable genomic resource for enhancing our understanding of polyploid genome structure and evolution, and for tagging genome-wide linkage disequilibrium and association stud-ies that target genes to specific functions or traits.
Results and discussion
Sequencing and mining of potential SNPs in tetraploid cotton
A total of 59 interspecific F2individuals (THF2) were
[image:2.595.57.540.647.716.2]de-veloped from a cross between two cultivated tetraploid cotton species; G. hirsutum acc. TM-1 and G. barba-dense cv. Hai7124. For SNP discovery, two parents were sequenced at relatively high coverage using the Illumina sequencing approach. In total, 154.7 Gb of high quality short read sequences (61.9-fold genome coverage) were generated for TM-1, and 97.9 Gb (39.1-fold genome coverage) for Hai7124 (Table 1). First, an initial draft of the TM-1 genome was obtained from the TM-1 assem-bly project, which consisted of 17,188 scaffolds (>10 kb, accounting for 92.0 % of all sequence scaffolds). The size of the assembly was 2.2 Gb, with a scaffold N50 size of 210 kb. Further, all high quality reads from TM-1 and Hai7124 were aligned to the scaffolds of TM-1 to allow the detection of putative SNPs using BWA [37] and Samtools [38] softwares. The alignment results showed that 72.5 % and 38.7 % of the short reads (MQ >20) from TM-1 and Hai7124, respectively, were uniquely
Table 1Summary of sequencing data from two parents and the mapping population in tetraploid cotton
Sample Insert size (bp) Read length (bp)
Raw data (Gbp) HQ data (Gbp)
Total data (Gbp) Valid sequence depth (×) Total data (Gbp) Valid sequence depth (×)
TM-1 180 and 300 2 × 100 185.0 74.0 154.7 61.9
Hai7124 300 2 × 100 111.8 44.7 97.9 39.1
THF2a 300 2 × 100 938.0 375.2 784.0 313.6
a
aligned to the reference genome (Additional file 2), and these locus-specific and high-quality reads were used to detect the interspecific SNPs between TM-1 and Hai7124. Finally, we identified 6,476,899 putative interspecific SNPs, including 5,054,468 simple SNPs, 1,421,857 hemi-SNPs, and 574 complex SNPs, classified as de-scribed by Trick [18]. These simple SNPs accounted for nearly 78 % of the total polymorphic SNPs and are potential markers for genotyping of the mapping population.
A total genome sequence of 784 Gb was generated for 59 F2individuals; 13.3 Gb for each individual on average,
equivalent to 5.3× coverage of the cotton genome (Table 1, Additional file 3). Reads of the 59 F2individuals were
mapped against the primary genome sequence and the uniquely mapped reads of high mapping quality (MQ >20) were retained for genotyping. Accurate genotyping of allo-polyploid genomes based on short reads with low genome coverage was difficult due to two major obstacles: First, sequencing error and heterozygous regions in the genome led to inaccurate genotyping at given SNP sites, and second, excessive missing genotypes existed due to low genome coverage. To overcome these challenges, we per-formed a two-step genome-wide genotyping process. First, SNP positions were identified in the initial genotype of 59 F2individuals using a minimum read depth of four and
minimum read per allele of one as thresholds. A similarity score was calculated between SNP sites in each scaffold based on the initial genotype, and the SNP sites with high similarity scores were classified into a block in order to avoid mis-assembly in further analysis. Then, a sliding window approach was used to evaluate a group of con-secutive SNPs in the same block for genotyping. The minimum read depth in a window containing adjacent SNP sites was 40 to avoid genotyping errors with a single allele at low genome coverage. The genotype of each slid-ing window was determined based on Bayesian theory (see Materials and Methods). First step screening showed that the missing genotype rate of SNP sites within the ini-tial genotype was 43.95 % and the accuracy of genotype calling at SNP sites for the F2 population was 80.07 %
(9.87 % A-H miss calls and 10.06 % B-H miss calls; A for homozygous TM-1 genotype, B for homozygous Hai7124 genotype, and H for heterozygous genotype), while in the second step screening, the missing genotype rate of SNP sites was reduced to 5.21 % when the sliding window ap-proach was used and the accuracy of genotype calling at SNP sites was improved to 99.28 %. It is obvious that the accuracy and efficiency of the sequence-based genotyping of the mapping population were greatly improved through the use of the two-step method. As a result, 4,999,048 of 5,054,468 simple SNPs involved in 4,049 recombination bins were genotyped successfully, where a recombination bin represents a class of SNP loci without a recombination
node and missing genotype detected. In our study, hemi and complex SNPs detected between two parents were not used for map construction because of their intricate nature that likely represents a mixture of two homoeolo-gous or paralohomoeolo-gous sequences due to the sequencing depth of the F2 individuals. Modern breeding has
en-hanced gene flow and post-domestication introgressions through deliberate hybridization between these two spe-cies. For example, the reciprocal introgressions between
G. hirsutum and G. barbadensecultivars have developed Acala and Pima cultivar families. Therefore, many of these interspecific SNPs can be used in such introgressions in future cotton breeding.
Construction of sequence-based ultra-dense genetic and physical maps
To effectively order the linkage groups, 441 framework SSR markers that were able to amplify 519 discrete poly-morphic loci and were distributed evenly on 26 chromo-somes were selected, with 10 cM intervals between the markers based on our microsatellite-based, gene-rich linkage map [33]. The ultra-dense genetic map was con-structed based on data from 59 F2individuals and
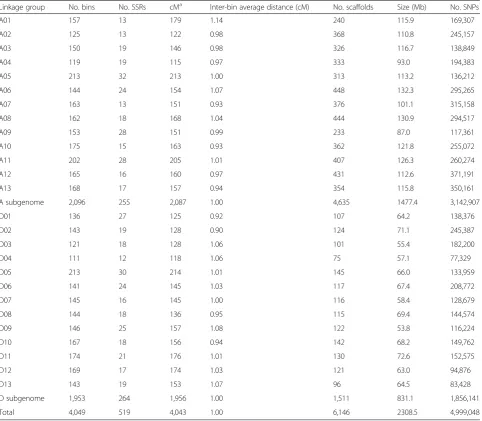
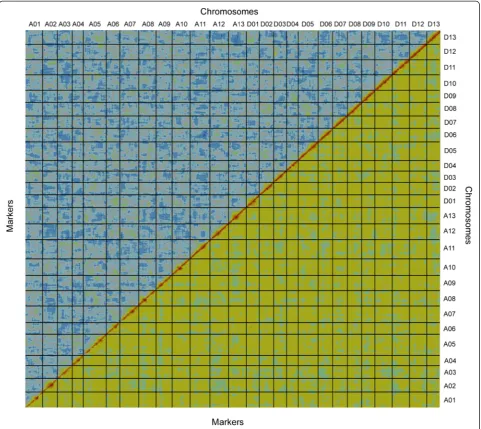
ori-ented by integrating the reference framework SSRs using Joinmap 3.0 [39]. The map consists of 4,049 re-combination bins that include 519 framework SSR loci and 4,999,048 SNP loci, and covers 4,042 cM with an average inter-bin genetic distance of 1.0 cM (Table 2, Additional file 4). Analysis of the SNP calling accuracy and mapping quality using CheckMatrix [10] indicated that all markers in the composite map were assigned to correct linkages in the correct order (Fig. 1). Overall, this SNP array and high-density linkage map is the sole genetic map with the maximum number of SNPs in al-lotetraploid cotton constructed so far. It will be useful for genomic studies and molecular breeding in cotton.
The inter-specific map was further compared to a high density intra-specific map which was developed to tag QTLs in Upland cotton using RAD sequencing technology [40]. We identified 21,109 SNPs between Upland cotton cultivars, Prema and 86–1, and used these for the geno-typing of 161 recombinant inbred lines. Prema is an Acala cultivar which has introgressed segments fromG. thurberi
and G. barbadense. Finally, the highest density intra-specific linkage map comprising 4,153 loci over 3500-cM has been developed to date in Upland cotton [40]. The SNP alignments revealed their high consistency in marker order between these two maps (Additional file 5), suggest-ing the high degree of collinearity between these two culti-vated tetraploid cottons.
Assessing and validating the genomes of tetraploid cottons
Although the emergence of NGS technologies provides a rapid and inexpensive method for genome-wide assembly,
the assembly of complex and polyploid genomes such as cotton is still challenging. It is difficult to distinguish homoeologous genomic segments with a high degree of sequence similarity, large gene families, and extensive seg-mental duplications such as multiple ‘paralogs’. In the present research, the ultra-dense SNP map was further used to validate the initial assembly of the TM-1 genome (scaffold N50: 210 kb) based on the Illumina short reads. We detected 90 instances of mis-assemblies of the scaf-folds, which covered 36.0 Mb and accounted for 1.6 % of the entire assembled genome (Additional file 6).
The population size is relatively small for use in resolv-ing smaller scaffolds. Therefore, in addition to the paired-end (PE) reads of 2, 5, and 10 kb libraries used to generate the assembly, the longer scaffolds were enhanced by as-sembling 174,454 pairs of Sanger-sequenced bacterial
[image:4.595.58.541.100.521.2]artificial chromosome (BAC)-end sequences comprising 116.5 megabases (Mb) [41]. After the BAC-end se-quences were merged into the validated assembly, we generated an updated version, V1.0, in which the length of the scaffolds was increased (N50: 1.9 Mb). In the V1.0 assembly, 128 misassembled scaffolds (406.2 Mb, accounting for 16.2 % of the assembly) were detec-ted (Additional file 6). Through comparing the mis-assembled types in the different assembly versions, we found that about half of the scaffold mis-assemblies re-sulted from homoeologous chromosomes (46.9 % to 52.1 %). More interchromosomal mis-assemblies were detected in the A subgenome chromosomes (21.9 % to 29.1 %) than in the D subgenome, most likely due to the greater number of repetitive sequences in the A subgenome.
Table 2Characteristics of the 26 linkage groups in allotetraploid cotton
Linkage group No. bins No. SSRs cMa Inter-bin average distance (cM) No. scaffolds Size (Mb) No. SNPs
A01 157 13 179 1.14 240 115.9 169,307
A02 125 13 122 0.98 368 110.8 245,157
A03 150 19 146 0.98 326 116.7 138,849
A04 119 19 115 0.97 333 93.0 194,383
A05 213 32 213 1.00 313 113.2 136,212
A06 144 24 154 1.07 448 132.3 295,265
A07 163 13 151 0.93 376 101.1 315,158
A08 162 18 168 1.04 444 130.9 294,517
A09 153 28 151 0.99 233 87.0 117,361
A10 175 15 163 0.93 362 121.8 255,072
A11 202 28 205 1.01 407 126.3 260,274
A12 165 16 160 0.97 431 112.6 371,191
A13 168 17 157 0.94 354 115.8 350,161
A subgenome 2,096 255 2,087 1.00 4,635 1477.4 3,142,907
D01 136 27 125 0.92 107 64.2 138,376
D02 143 19 128 0.90 124 71.1 245,387
D03 121 18 128 1.06 101 55.4 182,200
D04 111 12 118 1.06 75 57.1 77,329
D05 213 30 214 1.01 145 66.0 133,959
D06 141 24 145 1.03 117 67.4 208,772
D07 145 16 145 1.00 116 58.4 128,679
D08 144 18 136 0.95 115 69.4 144,574
D09 146 25 157 1.08 122 53.8 116,224
D10 167 18 156 0.94 142 68.2 149,762
D11 174 21 176 1.01 130 72.6 152,575
D12 169 17 174 1.03 121 63.0 94,876
D13 143 19 153 1.07 96 64.5 83,428
D subgenome 1,953 264 1,956 1.00 1,511 831.1 1,856,141
Total 4,049 519 4,043 1.00 6,146 2308.5 4,999,048
a
After these false mis-assemblies were broken, the final assembly of the TM-1 genome was produced (V1.1, PRJNA248163) [41]. According to the ultra-dense SNP map, which contains 4,999,048 SNP loci, the scaffolds that were >500 kb in length were anchored, and the per-centage of anchored scaffolds gradually decreased as the length of the scaffold decreased. Finally, 6,146 scaffolds (covering 2.3 Gb) were anchored and concatenated into 26 pseudo-chromosomes, accounting for 94.9 % (2.4 Gb) of the assembled sequence; 1,477 Mb (4,635 scaffolds) in the A subgenome and 831 Mb (1,511 scaffolds) in the D subgenome. The size of the 26 pseudo-chromosomes varied from 55.4 Mb (D03) to 132.3 Mb (A06) [41].
Allopolyploid plants often undergo major changes in genome structure and function induced by the combin-ation of divergent genomes from two or more related parental species [42]. Many studies have revealed that inter-genomic chromosomal rearrangements, differential gene loss (loss of some duplicates but not others), gene conversion, divergence, and functional diversification of duplicated genes often arise with the onset of polyploidi-zation [43]. Therefore, several assistant strategies such as genetic mapping [3], physical mapping, fluorescent in situ hybridization (FISH) [44], and flow-sorting [45] technology, have been employed to aid in whole genome assembly. For example, a chromosome-based draft sequence
Fig. 1Graphical representation of the high-quality linkage map of tetraploid cotton. Alignment of 4,049 bins along the 26 chromosomes reveals a pairwise BIT score (top-left diagonal) and REC score (low-right diagonal) in all pairs of marker bins, plotted here using CheckMatrix [82]. Red represents tight linkage; yellow represents weak linkage; and blue represents no linkage. The red along the diagonal and the lack of red off the diagonal indicate the high quality and strong statistical support of the map
[image:5.595.58.540.89.518.2]of the hexaploid bread wheat (Triticum aestivum) genome has been produced by sequencing isolated chromosome arms through flow-sorting technology [45]. However, for most polyploidy species with small chromosomes that are difficult to classify and isolate using flow cytometry and sorting, this method is impracticable. In our method, an ultra-dense genetic linkage map is tremendously beneficial in the assembly of large and complex polyploidy genomes; as emphasized by Lewin,‘every genome sequence needs a good map’ [46]. In fact, the production of high-quality genome assemblies in many species has benefited appre-ciably from good maps.
Structural variations in allotetraploid cotton genomes
Generally, ancestors of the A genome species, G. herba-ceumorG. arboreum, and the D genome species,G. rai-mondii, contributed the constituent A and D subgenomes of tetraploid cotton, respectively [25]. Using two se-quenced diploid genomes,G. arboreum(A2) [47] andG.
raimondii (D5) [48], two extant progenitor relatives of
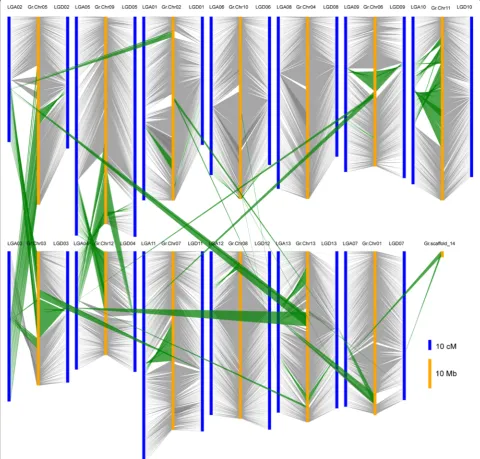
tetraploid cotton, the integration of the molecular genetic map with the physical map can be realized. However, this collinearity was not obvious within the A-progenitor genome [47], partly due to numerous examples of mis-assemblies, and partly becauseG. arboreumis an import-ant cultivated diploid species and may have undergone some of its own chromosomal rearrangements during its evolution and improvement. When the ultra-dense tetra-ploid genetic map was aligned with theG. raimondii gen-ome [48], we found a high degree of collinearity, especially in the D subgenome (Fig. 2). Therefore, only theG. rai-mondii genome was used for comparative genomic analysis.
Although the comparative genomic results showed a high degree of collinearity between the genetic map and the physical map, some instances of chromosomal re-arrangement were detected between the A, D subgenome and the D genome. Two postpolyploidization reciprocal translocations were displayed between A02 and A03, and between A04 and A05, in the At subgenome (Fig. 2),which broke the chromosomes as follows; A02/A03 (61.90-122.31 cM), corresponding to pseudo molecule Chr03 in G. raimondii (GrChr03) at 33736–28298512 bp
(28.26 Mb, accounting for 61.75 % of GrChr03), and A03/A02 (66.75-146.42 cM) corresponding to GrChr05 at 17656841–64067579 bp (46.41 Mb, accounting for 72.36 % of GrChr05); A04/A05 (0–54.66 cM) correspond-ing to GrChr09 at 43817852–70655127 bp (26.84 Mb, accounting for 37.96 % of GrChr09), and A05/A04 (160.43-213.26 cM) corresponding to GrChr12 at 591184– 15299554 bp (14.71 Mb, accounting for 41.51 % of GrChr12) (Additional file 7). Furthermore, we identified 15 simple translocations between the A or D subge-nome and the D gesubge-nome, for example, D11 had a simple
translocation of 2.75 Mb from GrChr03 (accounting for 6.01 % of GrChr03 at 13111322–15861215 bp). The A and D subgenomes displayed 19 possible inversions that were slightly different from those found by Wanget al.
[32] and Ronget al.[27]. These 19 inversions, with sizes in the range of 0.05 Mb to 37.57 Mb, were found in 16 chromosomes, accounting for 0.09 % to 59.93 % of the corresponding chromosomes. Detailed information on these chromosomal rearrangement events with their lo-cations on both the genetic map and the physical map ofG. raimondiiare presented in Additional file 7. From our comparison of the genetic and physical maps of the D genome sequence, we detected some structural varia-tions not only in the A subgenome, but also in the D subgenome. However, we were unable to determine whether these structural changes occurred in the tetra-ploid after polytetra-ploidization and domestication or in the diploids in the last 1 to 2 million years, since the exact donor species that led to the formation of the tetraploid cotton species 1 to 2 MYA no longer exist.
Two reciprocal translocations revealed in the present study are in agreement with the results from prior stud-ies [27, 32]. Three of 19 possible inversions were almost in agreement with the results of Wanget al.[32] and 15 simple translocations are first reported in the study, al-though we cannot exclude the possibility that some of the newly observed chromosomal structural rearrange-ments resulted from misassemblies in the G. raimondii
reference genome sequence. Furthermore, the complex chromosomal rearrangements (inversions and simple translocations) observed here need to be accounted for in the‘translation’of information from the D genome in
G. raimondii to allotetraploid cotton genomes. Genome variations such as inversions and translocations are con-sidered important factors in species evolution. In the process of evolution from diploid to tetraploid cotton, these chromosomal structural rearrangements may have caused a series of changes in phenotype. These struc-tural variations in the genome may help to elucidate the relationships between the phenotype and genotype of important agronomic traits in tetraploid cotton.
Comparison of the genetic and physical maps of allotetraploid cotton
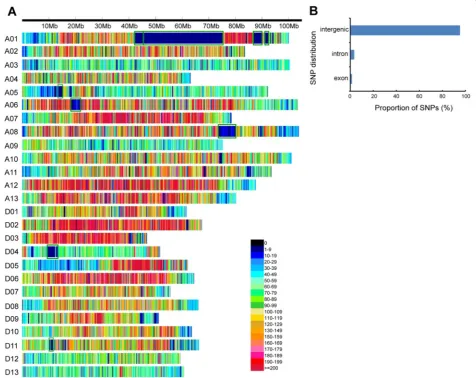
low SNP frequency) comprising a total of 54.0 Mb and accounting for 2.3 % of the whole genome were detected on chromosomes A01, A05, A06, A08, D04, and D11 (Additional file 8). The SNP-poor regions may have been due to historical introgression betweenG. hirsutumand
G. barbadense. In chromosome A01, for example, some QTLs related to fiber quality from interspecific hybrid populations have been mapped to the SNP-poor region [49–51]. Several investigators have also postulated that an introgression event was responsible for the creation of the Sea Island germplasm [52, 53] in which the
introgressed segments play a role in conferring beneficial traits such as high fiber quality or photoperiod neutrality [54]. Furthermore, modern breeding has enhanced gene flow and post-domestication introgressions through de-liberate hybridization of these two species. For example, the reciprocal introgressions between G. hirsutumand
G. barbadense cultivars have developed the Acala and Pima cultivar families [55]. Moreover, the vast majority of the mapped SNPs (95.2 %) were located in inter-genic regions, and smaller portions were found in in-tron, followed by exon, regions (Fig. 3b). This suggests
Fig. 2Comparison of the genetic map of tetraploid cotton and the corresponding physical locations on the pseudo molecules of the D genome sequence ofG. raimondii. TM-1 scaffolds in the 26 linkage groups (blue) were aligned to the D genome sequence ofG. raimondii(yellow). Genome variations (green blocks) were identified
[image:7.595.57.538.92.551.2]that SNP discovery via transcriptome sequencing is limited.
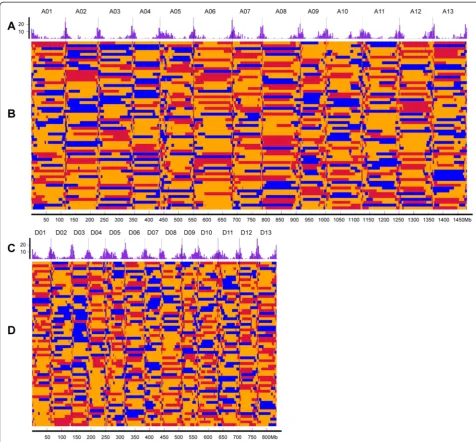
To facilitate genetic analysis, we converted the SNP linkage map into a skeleton bin map (Fig. 4). The two subgenomes had similar numbers of recombination bins in the skeleton bin map: 2,096 in the A subgenome and 1,953 in the D subgenome, making a total of 4,049. The average physical length of the recombination bins was 570 kb. The genetic and physical distances were not dir-ectly proportional, as shown in Fig. 5, where the plots of recombination bin placements on the 26 chromosomes are compared.
Recombination can generate genetic variation and induce genetic diversity. By comparing genetic and physical distances between adjacent markers, we further exam-ined the relative changes in recombination rate along each chromosome. Consistently high recombination at chromosome ends and recombination suppression were
clearly observed in different linkage groups. We found 26 recombination suppression regions in the 26 linkage groups (Fig. 5), which might be related to the heterochro-matic regions [56]. These covered the repeat-rich centro-meric or pericentrocentro-meric regions on each chromosome. We found that the recombination rates in hotspot regions were in the range of 1.4 to 5.7 cM/Mb, while in the sup-pression regions, recombination rates were in the range of 0 to 0.5 cM/Mb. Previous reports have revealed even more extreme variation in wheat [57, 58], where 1 Mb corre-sponds to a range of 0.05 to 8.47 cM, and in chromosome 4 ofArabidopsis[59], where 1 Mb corresponds to a range of 0 cM near the centromere to 20 cM on the short arm of the chromosome. Each chromosome was approximately subdivided into recombination hotspots rich) and recombination suppression (recombination-poor) regions. The average ratio of genetic-to-physical distance was 1.75 cM/Mb for the whole genome of G.
[image:8.595.60.537.91.469.2]hirsutum. Genome-wide patterns of recombination have been described previously for some species, including
Arabidopsis [59, 60] and rice [61]. This ratio is similar to those for watermelon (2.3 cM/Mb) [6], sorghum (1.43 cM/Mb) [62], and cucumber (3.2 cM/Mb) [63], but is lower than that for maize (5.5 cM/Mb) [64].
Genetic mapping of centromeric regions in allotetraploid cotton chromosomes
Little is known of the dynamics of centromeric DNA in polyploidy plants. Centromeres usually contain
high-copy-number retrotransposons and satellite repeats, which are difficult to map, clone, and sequence. Few studies have focused on centromeres in cotton [24, 65]. In our previous study, we found that BAC 97G20 hybridized to the centromeric regions of all 52 chromosomes in domes-ticated Upland cotton [66]. Sequence analysis of BAC 97G20 showed that there were four long terminal re-peat (LTR) retrotransposons, named GhCR1-4, with a strong similarity to the centromeric retrotransposons reported in other plants [24]. Of them, GhCR1 and GhCR3 had 93.6 % and 94.4 % similarity to centromere
Fig. 4Recombination and bin map for 59 scored F2individuals.a, cFrequency distribution of recombination nodes (RNs) per 2 Mb. The vertical
scale indicates the number of recombination nodes (RNs);b, dBin maps for the 59 scored F2individual lines. Colored tracks represent the 59
individual lines of the THF2population that were used for linkage map construction: red, alleles inherited from maternal parent (TM-1); blue,
alleles inherited from paternal parent (Hai7124); yellow, alleles inherited from heterozygous genotype (TM-1 × Hai7124)F1. The horizontal scale
indicates physical distance
[image:9.595.57.534.88.530.2]retroelements in Gossypium (CRG), CRG1 and CRG2, respectively. CRG1 and CRG2 were recently identified by co-localization immunostaining with antiserum to the centromere-specific histone CENH3 in cotton [65], indi-cating that GhCR1 and GhCR3 may belong to the same class as the CRGs.
Whole-genome sequence screening for four GhCR LTR homologies in G. hirsutum acc. TM-1 [41] identi-fied 3,515 LTR homologies (about 270 for each chromo-some on average) in the D subgenome; a much higher number than the 430 (about 33 for each chromosome
on average) in the A subgenome (T-test:Pvalue = 6.81e-07) (Additional file 9). This observation is consistent with the results of our FISH hybridization, which revealed that four of these retrotransposons were hybridized specifically to the centromere region in all of the chromosomes of G. hirsutum; however, much weaker signals were observed in the A subgenome than in the D subgenome. Of these ret-rotransposons, GhCR1 and GhCR3 LTRs had 1,857 and 1,375 homologous sequences, respectively; much higher than the 146 and 137 found in GhCR2 and GhCR4, re-spectively, in the TM-1 genome (Additional file 9). The
[image:10.595.57.542.88.528.2]putative centromeric regions in allotetraploid Upland cot-ton chromosomes are illustrated in Fig. 6. In the D subge-nome, the centromeric regions were highly overlapped by GhCR1-5’LTR and GhCR3-5’LTR. With the exception of the predicted centromeric regions, which covered more than 4 Mb in D04 and D13, there were less than 2 Mb of centromeric regions in all other chromosomes (Fig. 6 and Additional file 10). In the A subgenome, however, no pu-tative centromeric region was detected in A02, A07, A08, A11, or A13, with GhCRs absent in these chromosomes. In the other eight chromosomes, there was an extremely low level of homology with the predicted centromeric re-gion sequences and a relatively large physical distance, ranging from 4.8 to 23.7 Mb, was detected; implying that there are large centromeric regions in the A subgenome (Fig. 6 and Additional file 10). In other plant species, the size of centromeric regions ranges from 9 Mb, in chromo-some 1 ofArabidopsis, to 124 kb, in chromosome 4 of rice [67–70]. Although the sequences of centromeric regions show baffling diversification and species-specificity, the present report implies that the cotton centromeric regions span several hundred kilobases to several megabases. The centromeric regions identified in the study will serve as
useful landmarks for fine-tuning the structure of the cot-ton genome.
In recent years, the study of centromeres has pro-gressed rapidly in cotton [24, 65]. FISH analysis revealed that CRGs [65] and GhCRs [24] are both found in all 52 chromosomes in allotetraploid cottons and in D genome diploid cotton species, but not in A genome diploid spe-cies, such as G. arboreum and G. herbaceum. Whole-genome screening of theG. arboreum genome sequence [47] found only 17 homologies of CRGs (sequence iden-tity >80 %) [65] and 119 GhCR LTRs in the A genome. Furthermore, the number of CRG homologies [65] and GhCR LTRs are much higher in the D subgenome than in the A subgenome in allotetraploid cotton. No reverse transcriptase (RT) domain from GhCRs LTR retrotrans-poson was found in the diploid A genome. However, one RT domain of GhCRs LRT was found in the A subgenome of TM-1. Phylogenetic analysis was performed using the Neighbor-joining (NJ) method in the MEGA 5.10 program [71] and showed that this RT domain could be derived from the D genome/D subgenome (Fig. 7). Together, these results revealed that these centromeric retrotransposons may have been derived from the D subgenome progenitor,
Fig. 6Schematic diagrams of centromeric regions ofG. hirsutumacc. TM-1.aCentromeric regions of the A subgenome were identified by GhCRs-5’LTR (green) and CRG1-5’LTR (orange).bCentromeric regions of the D subgenome were identified by GhCR1-5’LTR (red), GhCR3-5’LTR (blue), and CRG1-5’LTR (orange)
[image:11.595.57.540.386.695.2]invaded the A subgenome centromeres in allotetraploid cotton during allopolyploid formation, and were amplified during its evolutionary history. Extensive retrotransposon amplification must have occurred through the genome and, in particular, in the pericentromeric regions. Trans-poson activation following hybridization or polyploidy formation has been detected in some plants [65, 72, 73]. To limit genomic damage, plant hosts have evolved
RNA interference-meditated mechanisms to tame their endogenous retroelements [74].
Conclusions
In this study, we constructed the first ultra-dense genetic map composed of approximately 5 million NGS sequence-derived SNP markers in allotetraploid cotton. This map has played an important role in genome assembly, the detection
[image:12.595.58.540.90.564.2]of genome rearrangements, and the identification of centro-meric regions of polyploid cotton. The methodology used in this study can be applied to whole genome sequencing and the assembly of many other polyploid crops with large and complex genomes. Further, this complete and high resolution composite map is of practical importance for novel QTL discovery, gene mapping, map-based clon-ing, and marker assisted selection in cotton.
Materials and methods
Plant materials, DNA extraction, PCR amplification, and electrophoresis
The plant materials used consisted of G. hirsutum acc TM-1 andG. barbadense cv. Hai7124, two highly homo-zygous parents, as well as 59 F2individuals derived from a
cross between TM-1 as the recipient and Hai7124 as the donor parent. TM-1 is a genetic standard line ofG. hirsu-tumdeveloped through single plant selection.barbadense
cv. Hai7124, grown extensively in China, was also a single plant selection offspring before it was used as a parent in the construction of the linkage map [75]. Genomic DNA were extracted from young leaf tissues following the methods described by Patersonet al.[76], with increased RNase A and proteinase K treatment to prevent RNA and protein contamination, before the extracts were subjected to Illumina sequencing technology and SSR-PCR amplification.
We selected 441 framework SSR markers from a complete linkage map [33], including 3,147 markers with 10-cM intervals between markers on 26 chromosomes, to anchor our framework map. Four hundred and forty-one SSR markers were employed to survey the 59 individ-uals in the F2mapping population. SSR-PCR amplification
and electrophoresis followed the methods described by Zhanget al.[75].
Library construction and sequencing
Genomic libraries were prepared following the manufac-turer’s standard instructions for high-throughput DNA sequencing for subsequent cluster generation, and were sequenced on the Illumina HiSeq 2000 platform (Illumina, San Diego, CA, USA). To construct paired-end libraries, DNA was fragmented by sonication, and DNA ends were blunted before adding an A base to each 3′ end. DNA adaptors with a single T-base 3′end overhang were ligated to the above products. Ligation products were purified on 2 % agarose gels that each targeted a specific range of insert sizes. Quantification and quality assessment were carried out by running 1μL of library on an Agi-lent DNA 1000 LabChip analyzer (AgiAgi-lent Technology 2100 Bioanalyzer). We constructedG. hirsutumgenome sequencing libraries with insert sizes of 180 bp and 300 bp,G. barbadensewith 300 bp inserts, and each F2
individual with 300 bp inserts.
Data Set extraction
Base-calling files were obtained from raw fluorescent images from the Illumina HiSeq 2000 platform using CASAVA 1.8 software in FASTQ format [77]. Illumina reads were filtered using NGSQCTookit v2.3 [78] (param-eters of -cutOffReadLen4HQ 70,−cutOffQualScore 20).
Sequence alignment to the temporary reference genome, SNP discovery, and genotyping
Alignment of the sequences to the TM-1 reference gen-ome [41] was performed with BWA [37] using only se-quences aligning to the reference genome with less than two mismatches based on a high quality sequence. Only sequences with a mapping score of at least 20 were used for SNP discovery.
For each parental sample, putative SNPs with respect to the TM-1 reference sequences were first called using samtools [38] and an in-house Perl script under the fol-lowing conditions: minimum read depth at a given pos-ition was 10, minimum supporting reads for an allele was 3, and the allele represented at least 20 % of all the alleles observed. The interspecific SNPs (allelic polymor-phisms), which can be broadly classified as simple SNPs, hemi-SNPs, and complex SNPs, were obtained from the two parental‘putative SNPs’lists using an in-house Perl script. Simple SNP types represent instances of either the reference sequence being genome-specific or se-quence divergence of one subgenome so as to prevent alignment of one homoeolog to the reference sequence. Hemi-SNP types represent instances of reads from both subgenomes aligned to reference sequences with an allelic variation being present in one. Complex SNP types repre-sent instances of an allelic variation having occurred at the site of an inter-homoeolog variation between the sub-genomes. The plain-text format‘pileup’files encapsulating the alignment maps generated by samtools were inspected sequentially for each population sample over each of the SNP positions present in the SNP superset.
Using the mapping population, the initial genotypes of individuals were detected and classified into blocks based on similarity scores. The similarity score was cal-culated at SNP sites independently according to the following formula:
Sz ¼ Σ
n
i ¼ 1 s GizGij
= n
whereGijandGizis the genotype of individualsiat thej-th
SNP and at thez-th SNP, respectively, ands(GizGij) /nis
the score of individualsibetween the genotype at thez-th SNP and the genotype at the j-th SNP.n represents the number of individuals without the missing genotype at the
j and z-th SNP. The similarity score is the sum of the scores of n individuals at the z-th SNP except for those with missing genotypes. The score of individuali at thej
andz-th SNPs are:s =1 if the genotypes ofGizandGijGij
are identical (A vs. A, B vs. B, H vs. H);s =0.5 if the geno-types ofGizandGijare different and one is‘H’(A vs. H, B
vs. H); ands =0 if the genotypes ofGizandGijare
differ-ent and neither is‘H’ (A vs. B). The minimum similarity score used for classifying similar SNP sites into a block was 0.7. There were two reasons that a minimum similar-ity score of 0.7 was used: (1) Markers with a high propor-tion of matches (>27/37, 72.97 %) were classified into a block in a similar study [5]; and (2) the accuracy of initial genotype calling at SNP sites for the F2 population was
80.07 %.
For SNP sites in the same scaffold and block, an ap-proach combining the sliding window apap-proach [79] and Bayesian inference [80] based on reads in the window was used to determine the genotypes of individuals that could reduce the error rate and the number of missing genotypes. For a genotype at a givenwwindow, assume there arenreads at the SNP sites in the window. The error rate of parent 1 and parent 2 areE1(0.058) andE2(0.02),
respectively. Under the condition of the allele from parent 1 (P1P1) or parent 2 (P2P2) or two parents (P1P2), the
prob-ability of observing n1reads of parent 1 at the SNP sites in
the window would follow a binominal distribution:
P n1ð j P1P1Þ ¼ n1n ð1 − E1Þn1 E2n−n1
P n1ð j P2P2Þ ¼ n ‐ n1
n
E1n1ð1 − E2Þn−n1
P n1ð j P1P2Þ ¼ n1n ð1 − E1 þ E2Þn1
ð1 þ E1 − E2Þn − n1
LetP(P1P1|n1),P(P2P2|n1),P(P1P2|n1), be the
pos-terior probabilities that the allele comes from parent 1, parent 2, or two parents given the observed n1reads of
parent 1 at the SNP sites in the window. These probabil-ities were calculated as:
P P1P1ð j n1Þ ¼ P n1ð j P1P1ÞP P1P1ð Þ P n1ð Þ
P P2P2ð j n1Þ ¼ P n1ð j P2P2ÞP P2P2ð Þ P n1ð Þ
P P1P2ð j n1Þ ¼ P n1ð j P1P2ÞP P1P2ð Þ P n1ð Þ
The genotype of the allele was determined based on the highest posterior probability at the SNP sites in the window:
max fP P1P1ð j n1Þ; P P2P2ð j n1Þ; P P1P2ð j n1Þg
The prior probabilities for genotypes P1P1, P2P2 and
P1P2 used for the Bayesian probability calculation were
estimated based on the theoretical probabilities for an F2
population, that is,P1P1:P2P2:P1P2= 0.25 : 0.25 : 0.5.
To evaluate the accuracy of the genotypes of the 59 in-dividuals, the genotypes of 26 random SSR markers that can be uniquely mapped to scaffolds by the size of their PCR product were identified in each individual. We as-sumed that the SNP genotypes of the 59 individuals in 10 kb flank intervals of 26 SSR markers’ physical loca-tions were consistent with the genotypes of the corre-sponding SSR markers.
Genetic mapping and validation
After the imputed genotype was visually scored by a slid-ing window, unambiguous SNP sites were used for the construction of a genetic linkage map. Using SNP sites, an ultra-dense genetic linkage map based on the imputed genotype of allotetraploid cotton was constructed by the following procedure. The co-segregating SNP sites were clustered as a recombination bin, defined as a class of SNP sites that had identical genotypes across the 59 indi-viduals with no recombination existing between each pair of SNP sites. The resulting 4,049 recombination bins com-bining SSR genotypes were used for the construction of the genetic linkage map using JoinMap Version 3.0 [39] with a recombination frequency <0.4 and minimum loga-rithm of odds (LOD) scores of 6. Recombination fre-quency was converted to linkage distances (centimorgan, cM) using the Kosambi mapping function. The resulting linkage groups constituted the genetic linkage map and were assigned the standard nomenclature for cotton (A01 to A13, D01 to D13) on the basis of the incorporation of a framework of SSR markers from the existing linkage map [33] and previously published chromosome naming sys-tems [81]. To validate the linkage map, an independent program, CheckMatrix using PyMap BIT and REC scores, as described by Kozik [82], was utilized. The recombin-ation bin map was used to anchor scaffolds and calculate recombination rates.
Correcting the genome mis-assembly
Each scaffold within the SNP linkage map was divided into 201 bp segments based on the SNP positions. SNP segments were mapped to the assembled genome using BWA software [37]. The stable SNP segments were used to detect mis-assembly scaffolds and anchor scaffolds, which were identified if the following conditions were met: (1) the minimum match base was 201 bp for the TM-1 genome; (2) there was a unique alignment on the genome sequence; and (3) there were at least 10 con-secutive SNP segments with the same genetic position.
Integration of the newly generated genetic linkage map and the physical map of theG. raimondiigenome
software, version 3.23 [83], and the best hit was chosen in the case of multiple matches.
Estimation of recombination rates
The estimated recombination rate (cM/Mb) was calcu-lated using in-house Perl scripts, which divided the gen-etic length of the segment in cM by the physical length of the segment in Mb. We defined recombination sup-pression regions as those where the recombination rate was less than 1.0 cM/Mb, and recombination hot re-gions as those where the recombination rate was greater than 1.0 cM/Mb [6].
Linkage mapping of cotton centromeric regions
Four LTR retrotransposons were identified from the centromere-specific BAC clone, 97G20 [84], which is closely associated with the centromere of cotton. The retrotransposons were designated as GhCR1, GhCR2, GhCR3, and GhCR4, and more generally as GhCRs. By high-resolution mapping, the GhCRs were located in the centromeric regions of all 52 chromosomes in the tetra-ploid cotton, G. hirsutum acc TM-1. To search the centromeric regions of each chromosome in TM-1, a se-quence alignment method was applied. According to the structure of the retrotransposons, relatively con-served 5’LTR regions, designated as GhCR1-5’LTR, GhCR2-5’LTR, GhCR3-5’LTR, and GhCR4-5’LTR, were selected as query sequences to align with the TM-1 gen-ome database. All the alignments were obtained by BLASTn analysis with its parameters set to the default values. Subsequently, GhCRs-5’LTR were screened for sequence similarity and e-value, with≥80 % and≤1e-20 set as the threshold values, respectively. To identify the centromeric regions of the A subgenome, the screened alignments of 13 chromosomes from GhCRs-5’LTR were mingled. They were then used to calculate the me-dian size of the 95 % confidence interval for the meme-dian, which was defined as the centromeric region for each chromosome. To identify the centromeric regions of the D subgenome, the screened alignments of 13 chromo-somes from GhCR1-5’LTR and GhCR3-5’LTR were used to analyze the centromeric regions. For further analyses, we used a multiple alignment consensus sequence that contained the GhCRs LTR retrotransposon RT domain. Phylogenetic analysis was performed using the NJ method in the MEGA 5.10 program [71]. Statistical sup-port for the NJ tree was evaluated by bootstrapping, where the number of replications was 1,000.
Data access
The sequences have been deposited in DDBJ/EMBL/ GenBank under the accessions (PRJNA274882). The SNP data between G. hirsutum acc TM-1 and G. barbadense
cv. Hai7124 are available at http://mascotton.njau.edu.cn/.
The F3 descended from F2 population will be available for mapping the QTL/genes related to important traits for predictive breeding in the near future.
Additional files
Additional file 1:Processing workflow for assigning, ordering and orienting scaffolds and validating misassembled scaffolds.First, sequencing the two parents (TM-1 and Hai7124) and an interspecific F2
population (THF2) derived from a cross between the two parents; second,
tentatively assembling the WGS sequences of TM-1 using SOAPdenovo package [85]; third, SNP calling between two parents, genotyping, and constructing a high resolution SNP linkage map; fourth, validating the structural correctness of primarily assembled scaffolds of the TM-1 genome by the linkage map; fifth, further assembling the sequence scaffolds by integrating paired BAC-end sequences (BES) with default and stringent parameters, respectively; sixth, validating, anchoring and orienting of assembled scaffolds; finally, coupling construction of the ultra-dense genetic map for assembling and validating.
Additional file 2:Information on reads mapped to the TM-1 reference sequence.
Additional file 3:Distribution of HQ data in 59 individuals of (TM-1 × Hai7124)F2.To construct an ultra-dense linkage map in tetraploid cotton, population sequencing by low-depth (approximately 5× coverage of the genome) whole genome sequencing (WGS) of 59 F2
individuals was performed. The x axis indicates the 59 individuals of (TM-1 × Hai7124)F2. The y axis indicates the number of the high quality
sequence reads (Gb).
Additional file 4:Marker details for the ultra-dense SNP genetic linkage map and the corresponding framework SSRs linkage map.
Table listing the position of SSR markers in corresponding chromosomes, SSR marker name, and the genotypes of 59 F2individuals for the
framework SSRs linkage map, the position of the marker or scaffold in the corresponding chromosome, the ID of recombination bin, the region ID of the scaffold, the scaffold name, the length of the scaffold, the number of SNPs, the genotypes of the 59 F2individuals, and the number of SNPs
per recombination bin for the ultra-dense genetic linkage map. Alleles: A/A (red) = homozygous TM-1 genotype (maternal parent); B/B (blue) = homozygous Hai7124 genotype (paternal parent); H/H (yellow) = heterozygous genotype (TM-1 × Hai7124)F1; C = not genotype A
(dominant B-allele); D = not genotype B (dominant A-allele); Missing data (genotype unknown) are noted as“—”.
Additional file 5:Comparison of two genetic maps of inter-specific SNPs and intra-specific SNPs.Intra-specific SNP tags in 104 linkage groups (purple) were aligned to TM-1 scaffolds in the 26 linkage groups based on inter-specific SNPs (blue).
Additional file 6: Tables S1 and S2. Coordinates for splitting of the TM-1 genome assembly scaffolds. Tables S1 and S2, listing the misas-sembled scaffold name, the position of the misasmisas-sembled scaffold mapped in different chromosomes, the breakout region of the misas-sembled scaffold, and the types of mis-assembly for the TM-1 genome initial assembly and version 1.0, respectively.
Additional file 7:Genome variations identified via comparative mapping against D genome pseudomolecules.
Additional file 8:SNP-poor regions between TM-1 and Hai7124. Additional file 9:AlignedG. hirsutumTM-1 genome with four sequences of GhCRs-5’LTR and CRG1-5’LTR.
Additional file 10: Tables S1 and S2. Centromere mapping in the physical map of the TM-1 genome. Tables S1 and S2 listing centromere mapping in the physical map of the TM-1 A and D subgenomes, respectively.
Abbreviations
BAC:Bacterial artificial chromosomes; bp: Base pair; BWA: Burrows-wheeler aligner; Chr: Chromosome; cM: centimorgan; CR: Centromeric
retrotransposon; FISH: Fluorescentin situhybridization; Gb: Gigabase;
GBS: Genotyping-by-sequencing; kb: kilobase; LOD: Logarithms of odds; LTR: Long terminal repeat; Mb: Megabase; MQ: Mapping quality; NGS: Next-generation sequencing; PCR: Polymerase chain reaction; QTL: Quantitative trait loci; RAD: Restriction site-associated genomic DNA; SBG: Sequence-based genotyping; SNP: Single nucleotide polymorphism; SSR: Simple sequence repeats; WGS: Whole genome shotgun.
Competing interests
The authors declare that they have no competing interests.
Authors’contributions
TZZ conceptualized the research program and coordinated the project. SW, JDC, WPZ, YH, LJC, LF, QW, FNL, HTW, ZFS, SQC, CPC, XFZ, and BLZ conducted laboratory experiments and were involved in data analysis. SW and JDC performed bioinformatics analyses. TZZ, WZG, SW, JDC, CPC, XFZ, and BLZ supervised data generation and analysis. SW and JDC drafted the manuscript. TZZ and WZG revised the manuscript. All authors read and approved the final manuscript.
Acknowledgements
This work was financially supported in part by grants from the Major State Basic Research Development Program of China (973 Program)
(2011CB109300), National Key Technology Support Program of China (2015BAD02B00), The Fundamental Research Funds by the Central Universities, the Priority Academic Program Development of Jiangsu Higher Education Institutions, the 111 project (B08025), and JCIC-MCP project.
Received: 13 February 2015 Accepted: 18 May 2015
References
1. Gupta PK, Roy JK, Prasad M. Single nucleotide polymorphisms: A new paradigm for molecular marker technology and DNA polymorphism detection with emphasis on their use in plants. Curr Sci. 2001;80:524–35. 2. Ganal MW, Altmann T, Roder MS. SNP identification in crop plants. Curr
Opin Plant Biol. 2009;12:211–7.
3. Hyten DL, Cannon SB, Song Q, Weeks N, Fickus EW, Shoemaker RC, et al. High-throughput SNP discovery through deep resequencing of a reduced representation library to anchor and orient scaffolds in the soybean whole genome sequence. BMC Genomics. 2010;11:38.
4. Huo N, Garvin DF, You FM, McMahon S, Luo MC, Gu YQ, et al. Comparison of a high-density genetic linkage map to genome features in the model grassBrachypodium distachyon. Theor Appl Genet. 2011;123:455–64. 5. Bancroft I, Morgan C, Fraser F, Higgins J, Wells R, Clissold L, et al. Dissecting
the genome of the polyploid crop oilseed rape by transcriptome sequencing. Nat Biotechnol. 2011;29:762–6.
6. Ren Y, Zhao H, Kou Q, Jiang J, Guo S, Zhang H, et al. A high resolution genetic map anchoring scaffolds of the sequenced watermelon genome. PLoS One. 2012;7:e29453.
7. Esteras C, Formisano G, Roig C, Diaz A, Blanca J, Garcia-Mas J, et al. SNP genotyping in melons: genetic variation, population structure, and linkage disequilibrium. Theor Appl Genet. 2013;126:1285–303.
8. Atwell S, Huang YS, Vilhjalmsson BJ, Willems G, Horton M, Li Y, et al. Genome-wide association study of 107 phenotypes inArabidopsis thaliana
inbred lines. Nature. 2010;465:627–31.
9. Deokar AA, Ramsay L, Sharpe AG, Diapari M, Sindhu A, Bett K, et al. Genome wide SNP identification in chickpea for use in development of a high density genetic map and improvement of chickpea reference genome assembly. BMC Genomics. 2014;15:708.
10. Rice Database Project. http://www.ncgr.ac.cn/RiceHapMap.
11. Lai JS, Li RQ, Xu X, Jin WW, Xu ML, Zhao HN, et al. Genome-wide patterns of genetic variation among elite maize inbred lines. Nat Genet. 2010;42:1027–U1158.
12. Altshuler D, Pollara VJ, Cowles CR, Van Etten WJ, Baldwin J, Linton L, et al. An SNP map of the human genome generated by reduced representation shotgun sequencing. Nature. 2000;407:513–6.
13. Baird NA, Etter PD, Atwood TS, Currey MC, Shiver AL, Lewis ZA, et al. Rapid SNP discovery and genetic mapping using sequenced RAD markers. PLoS One. 2008;3:e3376.
14. Elshire RJ, Glaubitz JC, Sun Q, Poland JA, Kawamoto K, Buckler ES, et al. A robust, simple genotyping-by-sequencing (GBS) approach for high diversity species. PLoS One. 2011;6:e19379.
15. van Poecke RM, Maccaferri M, Tang J, Truong HT, Janssen A, van Orsouw NJ, et al. Sequence-based SNP genotyping in durum wheat. Plant Biotechnol J. 2013;11:809–17.
16. Barbazuk WB, Emrich SJ, Chen HD, Li L, Schnable PS. SNP discovery via 454 transcriptome sequencing. Plant J. 2007;51:910–8.
17. Krasileva KV, Buffalo V, Bailey P, Pearce S, Ayling S, Tabbita F, et al. Separating homeologs by phasing in the tetraploid wheat transcriptome. Genome Biol. 2013;14:R66.
18. Trick M, Long Y, Meng J, Bancroft I. Single nucleotide polymorphism (SNP) discovery in the polyploidBrassica napususing Solexa transcriptome sequencing. Plant Biotechnol J. 2009;7:334–46.
19. Round EK, Flowers SK, Richards EJ.Arabidopsis thalianacentromere regions: genetic map positions and repetitive DNA structure. Genome Res. 1997;7:1045–53.
20. Wang S, Wang J, Jiang J, Zhang Q. Mapping of centromeric regions on the molecular linkage map of rice (Oryza sativaL.) using centromere-associated sequences. Mol Gen Genet. 2000;263:165–72.
21. Singh K, Ishii T, Parco A, Huang N, Brar DS, Khush GS. Centromere mapping and orientation of the molecular linkage map of rice (Oryza sativaL.). Proc Natl Acad Sci U S A. 1996;93:6163–8.
22. Wolfgruber TK, Sharma A, Schneider KL, Albert PS, Koo DH, Shi J, et al. Maize centromere structure and evolution: sequence analysis of centromeres 2 and 5 reveals dynamic Loci shaped primarily by retrotransposons. PLoS Genet. 2009;5:e1000743.
23. Copenhaver GP, Nickel K, Kuromori T, Benito MI, Kaul S, Lin X, et al. Genetic definition and sequence analysis ofArabidopsiscentromeres. Science. 1999;286:2468–74.
24. Zhang W, Cao Y, Wang K, Zhao T, Chen J, Pan M, et al. Identification of centromeric regions on the linkage map of cotton using centromere-related repeats. Genomics. 2014;104:587–93.
25. Brubaker C, Paterson A, Wendel J. Comparative genetic mapping of allotetraploid cotton and its diploid progenitors. Genome. 1999;42:184–203.
26. Lacape JM, Nguyen TB, Thibivilliers S, Bojinov B, Courtois B, Cantrell RG, et al. A combined RFLP-SSR-AFLP map of tetraploid cotton based on a
Gossypium hirsutum×Gossypium barbadensebackcross population. Genome. 2003;46:612–26.
27. Rong J, Abbey C, Bowers JE, Brubaker CL, Chang C, Chee PW, et al. A 3347-locus genetic recombination map of sequence-tagged sites reveals features of genome organization, transmission and evolution of cotton (Gossypium). Genetics. 2004;166:389–417.
28. Yu J, Kohel RJ, Smith CW. The construction of a tetraploid cotton genome wide comprehensive reference map. Genomics. 2010;95:230–40.
29. Yu Y, Yuan D, Liang S, Li X, Wang X, Lin Z, et al. Genome structure of cotton revealed by a genome-wide SSR genetic map constructed from a BC1 population betweenGossypium hirsutumandG. barbadense. BMC Genomics. 2011;12:15.
30. Yu JZ, Kohel RJ, Fang DD, Cho J, Van Deynze A, Ulloa M, et al. A high-density simple sequence repeat and single nucleotide polymorphism genetic map of the tetraploid cotton genome. G3 (Bethesda). 2012;2:43–58.
31. Blenda A, Fang DD, Rami JF, Garsmeur O, Luo F, Lacape JM. A high density consensus genetic map of tetraploid cotton that integrates multiple component maps through molecular marker redundancy check. PLoS One. 2012;7:e45739.
32. Wang Z, Zhang D, Wang X, Tan X, Guo H, Paterson AH. A whole-genome DNA marker map for cotton based on the D-genome sequence of
Gossypium raimondiiL. G3 (Bethesda). 2013;3:1759–67.
33. Zhao L, Yuanda L, Caiping C, Xiangchao T, Xiangdong C, Wei Z, et al. Toward allotetraploid cotton genome assembly: integration of a high-density molecular genetic linkage map with DNA sequence information. BMC Genomics. 2012;13:539.
34. Byers RL, Harker DB, Yourstone SM, Maughan PJ, Udall JA. Development and mapping of SNP assays in allotetraploid cotton. Theor Appl Genet. 2012;124:1201–14.
36. Li X, Gao W, Guo H, Zhang X, Fang DD, Lin Z. Development of EST-based SNP and InDel markers and their utilization in tetraploid cotton genetic mapping. BMC Genomics. 2014;15:1046.
37. Li H, Durbin R. Fast and accurate short read alignment with Burrows-Wheeler transform. Bioinformatics. 2009;25:1754–60.
38. Li H, Handsaker B, Wysoker A, Fennell T, Ruan J, Homer N, et al. The sequence alignment/map format and SAMtools. Bioinformatics. 2009;25:2078–9.
39. Van Ooijen JW, Voorrips R. JoinMap: version 3.0: software for the calculation of genetic linkage maps. Wageningen, the Netherlands: Plant Research International; 2001.
40. Wang YK, Ning ZY, Hu Y, Chen JD, Zhao R, Chen H, et al. Molecular mapping of restriction-site associated DNA markers in allotetraploid Upland cotton. PLoS One. 2015;10:e0124781.
41. Zhang TZ, Hu Y, Jiang WK, Fang L, Guan XY, Chen JD, et al. Sequencing of allotetraploid cotton (Gossypium hirsutum L. acc. TM-1) provides a resource for fibre improvement. Nat Biotechnol. 2015;33:531–7.
42. Chen ZJ. Genetic and epigenetic mechanisms for gene expression and phenotypic variation in plant polyploids. Annu Rev Plant Biol. 2007;58:377–406.
43. Adams KL, Wendel JF. Polyploidy and genome evolution in plants. Curr Opin Plant Biol. 2005;8:135–41.
44. Chester M, Leitch AR, Soltis PS, Soltis DE. Review of the application of modern cytogenetic methods (FISH/GISH) to the study of reticulation (polyploidy/hybridisation). Genes. 2010;1:166–92.
45. International Wheat Genome Sequencing C. A chromosome-based draft sequence of the hexaploid bread wheat (Triticum aestivum) genome. Science. 2014;345:1251788.
46. Lewin HA, Larkin DM, Pontius J, O’Brien SJ. Every genome sequence needs a good map. Genome Res. 2009;19:1925–8.
47. Li F, Fan G, Wang K, Sun F, Yuan Y, Song G, et al. Genome sequence of the cultivated cottonGossypium arboreum. Nat Genet.
2014;46:567–72.
48. Paterson AH, Wendel JF, Gundlach H, Guo H, Jenkins J, Jin D, et al. Repeated polyploidization ofGossypiumgenomes and the evolution of spinnable cotton fibres. Nature. 2012;492:423–7.
49. Park YH, Alabady MS, Ulloa M, Sickler B, Wilkins TA, Yu J, et al. Genetic mapping of new cotton fiber loci using EST-derived microsatellites in an interspecific recombinant inbred line cotton population. Mol Genet Genomics. 2005;274:428–41.
50. Lacape JM, Llewellyn D, Jacobs J, Arioli T, Becker D, Calhoun S, et al. Meta-analysis of cotton fiber quality QTLs across diverse environments in a
Gossypium hirsutum×G. barbadenseRIL population. BMC Plant Biology. 2010;10:132.
51. Chen X, Guo W, Liu B, Zhang Y, Song X, Cheng Y, et al. Molecular mechanisms of fiber differential development between G. barbadense and G. hirsutum revealed by genetical genomics. PLoS One. 2012;7:e30056.
52. Stephens SG. The origin of Sea Island cotton. Agric Hist. 1975;50:391–9. 53. Stephens SG. Some observations on photoperiodism and the
development of annual forms of domesticated cottons. Econ Bot. 1976;30:409–18.
54. Wang GL, Dong JM, Paterson AH. The distribution ofGossypium hirsutum
chromatin inG. barbadensegerm plasm: molecular analysis of introgressive plant breeding. Theor Appl Genet. 1995;91:1153–61.
55. Lubbers EL, Chee PW. The worldwide gene pool ofG. hirsutumand its improvement. In: Paterson AH, editor. Genetics and Genomics of Cotton. New York: Springer; 2009. p. 23–52.
56. Cheng Z, Presting GG, Buell CR, Wing RA, Jiang J. High-resolution pachytene chromosome mapping of bacterial artificial chromosomes anchored by genetic markers reveals the centromere location and the distribution of genetic recombination along chromosome 10 of rice. Genetics. 2001;157:1749–57.
57. Gill KS, Gill BS, Endo TR, Taylor T. Identification and high-density mapping of gene-rich regions in chromosome group 1 of wheat. Genetics.
1996;144:1883–91.
58. Gill KS, Gill BS, Endo TR, Boyko EV. Identification and high-density mapping of gene-rich regions in chromosome group 5 of wheat. Genetics. 1996;143:1001–12.
59. Drouaud J, Camilleri C, Bourguignon PY, Canaguier A, Berard A, Vezon D, et al. Variation in crossing-over rates across chromosome 4 of Arabidopsis
thaliana reveals the presence of meiotic recombination“hot spots”. Genome Res. 2006;16:106–14.
60. Wright SI, Agrawal N, Bureau TE. Effects of recombination rate and gene density on transposable element distributions inArabidopsis thaliana. Genome Res. 2003;13:1897–903.
61. Wu J, Mizuno H, Hayashi-Tsugane M, Ito Y, Chiden Y, Fujisawa M, et al. Physical maps and recombination frequency of six rice chromosomes. Plant J. 2003;36:720–30.
62. Paterson AH, Bowers JE, Bruggmann R, Dubchak I, Grimwood J, Gundlach H, et al. TheSorghum bicolorgenome and the diversification of grasses. Nature. 2009;457:551–6.
63. Huang S, Li R, Zhang Z, Li L, Gu X, Fan W, et al. The genome of the cucumber,Cucumis sativusL. Nat Genet. 2009;41:1275–81.
64. Wei F, Coe E, Nelson W, Bharti AK, Engler F, Butler E, et al. Physical and genetic structure of the maize genome reflects its complex evolutionary history. PLoS Genet. 2007;3:e123.
65. Luo S, Mach J, Abramson B, Ramirez R, Schurr R, Barone P, et al. The cotton centromere contains a Ty3-gypsy-like LTR retroelement. PLoS One. 2012;7:e35261.
66. Wang K, Guo W, Yang Z, Hu Y, Zhang W, Zhou B, et al. Structure and size variations between 12A and 12D homoeologous chromosomes based on high-resolution cytogenetic map in allotetraploid cotton. Chromosoma. 2010;119:255–66.
67. Hosouchi T, Kumekawa N, Tsuruoka H, Kotani H. Physical map-based sizes of the centromeric regions ofArabidopsis thalianachromosomes 1, 2, and 3. DNA Res. 2002;9:117–21.
68. Zhang Y, Huang Y, Zhang L, Li Y, Lu T, Lu Y, et al. Structural features of the rice chromosome 4 centromere. Nucl Acids Res. 2004;32:2023–30. 69. Nagaki K, Cheng Z, Ouyang S, Talbert PB, Kim M, Jones KM, et al.
Sequencing of a rice centromere uncovers active genes. Nat Genet. 2004;36:138–45.
70. Gong Z, Wu Y, Koblizkova A, Torres GA, Wang K, Iovene M, et al. Repeatless and repeat-based centromeres in potato: implications for centromere evolution. Plant Cell. 2012;24:3559–74.
71. Tamura K, Peterson D, Peterson N, Stecher G, Nei M, Kumar S. MEGA5: molecular evolutionary genetics analysis using maximum likelihood, evolutionary distance, and maximum parsimony methods. Mol Biol Evo. 2011;28:2731–9.
72. Petit M, Guidat C, Daniel J, Denis E, Montoriol E, Bui QT, et al. Mobilization of retrotransposons in synthetic allotetraploid tobacco. New Phytol. 2010;186:135–47.
73. Liu B, Wendel JF. Retrotransposon activation followed by rapid repression in introgressed rice plants. Genome. 2000;43:874–80.
74. Dooner HK, Weil CF. Give-and-take: interactions between DNA transposons and their host plant genomes. Curr Opin Genet Dev. 2007;17:486–92.
75. Zhang J, Guo W, Zhang T. Molecular linkage map of allotetraploid cotton (Gossypium hirsutumL. ×Gossypium barbadenseL.) with a haploid population. Theor Appl Genet. 2002;105:1166–74.
76. Paterson AH, Brubaker CL, Wendel JF. A rapid method for extraction of cotton (Gossypiumspp.) genomic DNA suitable for RFLP or PCR analysis. Plant Mol Biol Rep. 1993;11:122–7.
77. Pomraning KR, Smith KM, Bredeweg EL, Connolly LR, Phatale PA, Freitag M. Library preparation and data analysis packages for rapid genome sequencing. Methods Mol Biol. 2012;944:1–22.
78. Patel RK, Jain M. NGS QC toolkit: a toolkit for quality control of next generation sequencing data. PLoS One. 2012;7:e30619.
79. Huang X, Feng Q, Qian Q, Zhao Q, Wang L, Wang A, et al. High-throughput genotyping by whole-genome resequencing. Genome Res. 2009;19:1068–76.
80. Li H. A statistical framework for SNP calling, mutation discovery, association mapping and population genetical parameter estimation from sequencing data. Bioinformatics. 2011;27:2987–93.
81. Wang K, Song X, Han Z, Guo W, Yu JZ, Sun J, et al. Complete assignment of the chromosomes ofGossypium hirsutumL. by translocation and fluorescencein situhybridization mapping. Theor Appl Genet. 2006;113:73–80.
82. CheckMatrix. http://www.atgc.org/XLinkage/
83. Kurtz S, Phillippy A, Delcher AL, Smoot M, Shumway M, Antonescu C, et al. Versatile and open software for comparing large genomes. Genome Biol. 2004;5:R12.
84. Wang K, Zhang W, Cao Y, Zhang Z, Zheng D, Zhou B, et al. Localization of high level of sequence conservation and divergence regions in cotton. Theor Appl Genet. 2012;124:1173–82.
85. Li R, Zhu H, Ruan J, Qian W, Fang X, Shi Z, et al. De novo assembly of human genomes with massively parallel short read sequencing. Genome Res. 2010;20:265–72.
Submit your next manuscript to BioMed Central and take full advantage of:
• Convenient online submission
• Thorough peer review
• No space constraints or color figure charges
• Immediate publication on acceptance
• Inclusion in PubMed, CAS, Scopus and Google Scholar
• Research which is freely available for redistribution