http://dx.doi.org/10.4236/jbbs.2014.42009
The Effect of Masseter Activity Patterns during Chewing
on Suprahyoid Activity in Subsequent Chewing Cycles
Yozo Miyaoka1*, Ichiro Ashida1, Hajime Iwamori1, Yuko Tamaki2, Shin-ya Kawakami1, Takako Yamazaki1, Naoko Ito1
1
Department of Health and Nutrition, Niigata University of Health and Welfare, Niigata, Japan
2
Department of Health and Nutrition, University of Niigata Prefecture, Niigata, Japan Email: *[email protected]
Received December 26, 2013; revised January 5, 2014; accepted January 14, 2014
Copyright © 2014 Yozo Miyaoka et al. This is an open access article distributed under the Creative Commons Attribution License, which permits unrestricted use, distribution, and reproduction in any medium, provided the original work is properly cited. In accor-dance of the Creative Commons Attribution License all Copyrights © 2014 are reserved for SCIRP and the owner of the intellectual property Yozo Miyaoka et al. All Copyright © 2014 are guarded by law and by SCIRP as a guardian.
ABSTRACT
Few studies have evaluated the effects of activity patterns of the jaw closing muscles assessed by specific para-meters on jaw opening in subsequent cycles during the chewing of food. The objective of this study was to quan-titatively analyze the effect of the masseter (jaw closer) activity patterns on suprahyoid (jaw opener) activity during subsequent cycles. The assessments were performed while participants naturally chewed six test foods that differed in size dimensions and textural properties. Surface electromyograms of the masseter (on the habi-tual working side) and suprahyoid muscles were recorded in ten healthy young adults, each of whom randomly received one of the six test foods. The activity patterns were assessed using three parameters specifically devel-oped for their quantification. Changes in suprahyoid activity during each of the subsequent chewing cycles were examined by three amplitudinal (minimum, maximum, and net values of the integrated suprahyoid electromyo-gram) parameters and one durational (active duration) parameter. The main finding was that two of the three activity pattern parameters had a statistically significant effect only on the three amplitudinal parameters in three of the six test foods. These results suggest that masseter activity patterns partially affect suprahyoid activi-ty during subsequent chewing cycles and that the effect is food dependent. A possible neural mechanism respon-sible for this effect is presented.
KEYWORDS
Masseter; Activity Pattern; Suprahyoid; Textural Property; Chewing; Adult
1. Introduction
Cyclical jaw opening and closing form the basis of the rhythmic chewing movement noted in mammalian spe- cies. The lateral pterygoid and suprahyoid (SH; anterior belly of the digastric, geniohyoid and mylohyoid) mus- cles constitute the jaw opening muscles (or jaw openers), while the temporalis, masseter (Mass) and medial ptery- goid muscles serve as the jaw closing muscles (or jaw closers). Chewing movements, which usually begin with jaw opening and are followed by jaw closing, have been noted among many mammalian species, including hu- mans [1-3].
Two groups of nuclei, the paragigantocellular and gi-
gantocellular reticular nuclei, and the medial bulbar reti- cular formation, located in the region of the medulla ob- longata, are believed to play essential roles in the central pattern generator that controls the basic chewing rhythm [1-3]. Neurons of either or both nucleus groups send ac- tion potentials, via the parvocellular reticular nucleus, to the jaw opening and closing motoneurons, innervating the muscles responsible for chewing movement [4].
stretch reflex then contracts the muscles; conversely, closing of the jaw muscles during chewing is unlikely to affect jaw opening muscle activity [12], partly due to the lack of muscle spindles in the jaw opening muscles. Pre- vious studies have exclusively considered the influence of jaw closing muscle activity on amplitudinal and/or durational parameters of jaw opening muscle activity, either in experimental animals [5-8] or in humans [9-11]. Few studies have examined the influence of jaw closing muscle activity patterns using specific parameters for as- sessment as opposed to visual observation.
The present study was designed to examine the func- tional relationships between the jaw closing and opening muscles using the following steps: first, quantitatively assessing Mass activity patterns using the TP technique [13,14]; second, evaluating SH activity changes in am- plitudes and active (or burst) durations during subsequent chewing cycles; and finally, examining the statistical and functional relationships between jaw closing and opening muscle activity patterns using a linear model (LM) anal- ysis.
2. Materials and Methods
2.1. Participants
Ten healthy young adults (seven men and three women; 19 - 21 years old) participated in the present experiment after providing informed consent. The experiments were approved by the Ethics Committee of the Niigata Uni- versity of Health and Welfare.
2.2. Test Foods
The shape and textural data of the six test foods used in this study have been detailed previously [15]: 1) cheese (processed); 2) gummy candy; 3) marshmallow; 4) prune (dried); 5) rice cracker; and 6) sponge cake. The food
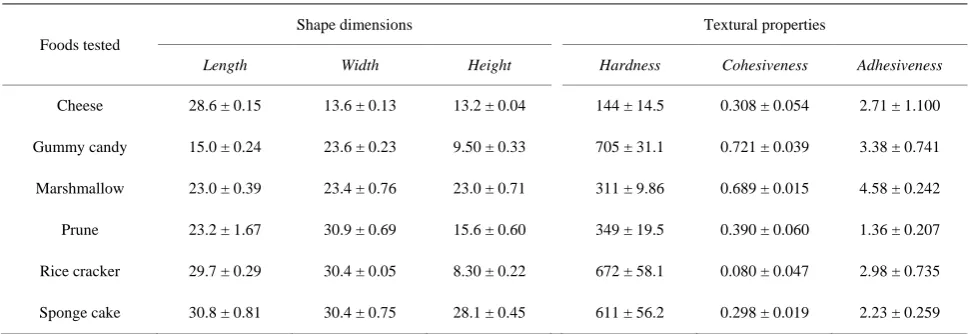
shapes (Table 1; see Table 1 in [15] for details) differed from one another because the test foods were commer- cial products; most were not processed further in an ef- fort to standardize their shapes and because such processing might have changed their properties. Only the cheese was processed further by cutting the contents of one package into two homomorphic pieces. Their dimen- sions, namely, length, width and height, were determined based on how each food was positioned in the mouth be- fore chewing. For example, height was defined as the distance between the molars gripping the food. Three textural properties (hardness, cohesiveness and adhesive- ness) of the test foods were measured (Table 2 in [15]) using a Texture Profile Unit (TPU-2S, Yamaden Inc., Tokyo, Japan) attached to a cylinder-shaped plunger, with a diameter of 8 mm at a room temperature of ap- proximately 25˚C. Each sample was compressed twice (speed 2.5 mm/s; clearance, 2.0 mm) and was measured four to seven times repeatedly.
2.3. Electrophysiological Recordings
[image:2.595.55.540.548.715.2]Two surface electromyograms (EMGs) were recorded according to our previous report [16]: i.e., one pair of adhesive electrodes (Ambu Inc., Blue Sensor, Baltorp- bakken, Denmark) was attached to the skin just above the SH muscles, and the other pair was attached above the Mass muscle on the participant’s habitual working side. The EMG signals were amplified, filtered (15 - 5000 Hz), fully rectified and integrated (τ = 0.06 s) using the Power Lab system (AD Instruments Pty Ltd., Power Lab/8 sp, Bella Vista, Australia). An accelerometer (Takei Scientif- ic Instruments Co. Ltd., Tokyo, Japan) was attached to the skin of the chin to record the trajectory of jaw move- ment and to determine the jaw opening and closing phas- es of the chewing cycles. In addition to the EMG and accelerometer recordings, two video cameras (Logicool®,
Table 1. Shape and textural data of the six foods analyzed in this study.
Foods tested
Shape dimensions Textural properties
Length Width Height Hardness Cohesiveness Adhesiveness
Cheese 28.6 ± 0.15 13.6 ± 0.13 13.2 ± 0.04 144 ± 14.5 0.308 ± 0.054 2.71 ± 1.100
Gummy candy 15.0 ± 0.24 23.6 ± 0.23 9.50 ± 0.33 705 ± 31.1 0.721 ± 0.039 3.38 ± 0.741
Marshmallow 23.0 ± 0.39 23.4 ± 0.76 23.0 ± 0.71 311 ± 9.86 0.689 ± 0.015 4.58 ± 0.242
Prune 23.2 ± 1.67 30.9 ± 0.69 15.6 ± 0.60 349 ± 19.5 0.390 ± 0.060 1.36 ± 0.207
Rice cracker 29.7 ± 0.29 30.4 ± 0.05 8.30 ± 0.22 672 ± 58.1 0.080 ± 0.047 2.98 ± 0.735
Sponge cake 30.8 ± 0.81 30.4 ± 0.75 28.1 ± 0.45 611 ± 56.2 0.298 ± 0.019 2.23 ± 0.259
Qcam Communicate STX, Tokyo, Japan) were used to monitor the movement of the body, neck and head of each participant from the frontal and lateral sides.
2.4. Procedures
Each participant was seated on a chair in an electrically shielded room at ambient temperature. The participant was provided with instructions regarding the chewing tasks from a computer display placed on a desk in front of him or her. One of the six test foods was delivered randomly to the participant, and he or she was asked to chew it using a natural rhythm. The participant was not restricted with regard to the chewing side, although the electrodes for the Mass EMG were attached to the habi- tual chewing side. The participant was also asked to swallow when he or she felt that the food had been chewed fully. The participant was allowed to drink room temperature green tea (Ohi-ocha, Ito-en, Tokyo, Japan) after swallowing the test food. The trials were separated by one-minute intervals, and each experimental session with a particular participant consisted of seven to 12 tri- als. Each participant ingested all of the six test foods at least once. In total, each of the ten participants underwent 77 trials: ten trials with cheese; 12 trials each with gum- my candy and prune; 14 trials each with marshmallow and sponge cake; and 15 trials with rice cracker.
2.5. Data Analysis
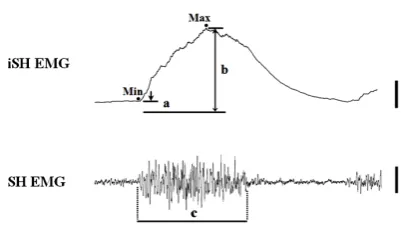
In each chewing sequence, the initial five full cycles after chewing commenced were analyzed. The first SH EMG of each chewing sequence was not counted because the major purpose of this study was to examine the effects of Mass activity patterns on SH parameters during subse- quent chewing cycles. The beginning and end of the Mass EMG were defined as the appearance and disap- pearance of the bursts and as the corresponding jaw movement trajectories. One chewing cycle was defined as the interval between the beginning of a Mass EMG burst and that of the next. In this study, the duration of the SH EMG was calculated by subtracting the duration of the Mass EMG from the duration of the corresponding chewing cycle, as the beginning and end of the SH EMGs usually overlapped with the end and beginning of the Mass EMG. The calculation was especially useful when the appearance and disappearance of the SH EMG bursts were unclear and when the durations were identic- al to those of the SH EMG bursts if the appearance and disappearance were clear, as seen in Figure 1. The fol- lowing four parameters were measured from the raw and integrated SH (inteSH) EMG data: 1) the “minimum” inteSH amplitude (“a” in Figure 1); 2) the “maximum” inteSH amplitude (“b”); 3) the “net” (“maximum” − “minimum”) inteSH amplitude; and 4) the active dura-
Figure 1. Data analysis. SH EMG and iSH EMG, raw and integrated electromyograms of the suprahyoid muscles, re- spectively. Vertical bars on the right indicate 3 mV∙s (for iSH EMG) and 0.2 mV (for SH EMG and Mass EMG); a horizontal bar indicates 0.5 s. A longer horizontal line be- low the iSH EMG indicates the value at baseline (i.e., 0 mV∙s), and the two shorter lines on iSH EMG indicate the minimum (Min, “a”) and maximum (Max, “b”) iSH EMG values, respectively. The active duration of the SH EMG (“c”) was measured as the interval from the beginning to the end of the SH EMG. See the text for details.
tion (“c”). The “minimum” and “maximum” inteSH am- plitudes were defined as the distances between the values at baseline (i.e., 0 mV∙s) and the values at the start of the
elevation (indicated by “Min” in Figure 1) and those at the peak (indicated by “Max”) of the inteSH EMG, re- spectively. A chewing cycle was defined as the time in- terval between the start of the Mass EMG and the next one.
Three TP values (T25, T50 and T75) were calculated us- ing the TP technique [13,14] to quantify the activity pat- terns of the EMG; the technique was applied to the Mass EMG during the initial five cycles in each chewing se- quence by taking the importance of the initial chewing cycles in motor control of jaw movement into considera- tion [17,18]. The outline of the TP technique is as follows: an EMG is cumulated from the beginning to the end of the burst; the cumulated EMG is divided into four equal sections; the duration from the beginning to the end of the burst is standardized as 1.000; the four sectioned values are serially projected onto the standardized time scale; and three TP values are designated as the projected values. According to the definition of the TP technique, T0 and T100 are always equal to 0.000 and 1.000, respec- tively, and each TP value designates a relative location of the EMG on a standardized time scale. Consequently, the TP technique enables direct comparison of one activity pattern with another with different amplitudes and dura- tions (see [13] for details).
2.6. Statistical Analysis
[image:3.595.323.528.81.200.2]jective parameters). Each of the three TP values was used as a covariate in the LM analysis. An average chewing cycle was calculated by dividing the time for the five chewing cycles by five (i.e., the number of cycles). The three amplitudinal SH parameters and a durational SH parameter were used as explanatory parameters. Thus, a total of 24 (six test foods x four explanatory parameters) combinations were considered for ANOVA. The data for the LM analysis were initially corrected to account for the average number of “participants” because this factor was the only one expected to have a general effect on the results.
Because Bartlett’s test detected some heterogeneity of variances in the data, two non-parametric tests, namely, the Kruskal-Wallis and Steel-Dwass tests, were used. First, the Kruskal-Wallis test was used to determine whether the six foods differed significantly in terms of the four parameters (i.e., “T25 values, T50 values, T75 val-ues”, and “chewing cycles”). Second, if the Kruskal- Wallis test found a significant difference, the Steel- Dwass test was used to determine whether particular pairs of foods exhibited specific differences. Differences were considered to be statistically significant if P < 0.05.
[image:4.595.308.538.116.238.2]3. Results
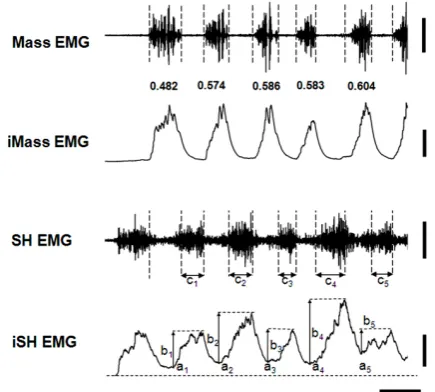
Figure 2 shows sample data of the two EMGs collected from the beginning to the 5th cycle during the chewing of a prune in a male participant. The sample data suggest that the initial part of these Mass bursts diminished rela-tively from the 1st to the 5th chewing cycle. The T50 val-ues calculated reflect that suggestion: i.e., 0.482 for the 1st cycle; 0.586 for the 3rd cycle; and 0.604 for the 5th cycle. In accordance with the relative diminution of the T50 values, the bottom of the inte SH rose, and the mini-mum inte SH amplitude (a1 to a5 in Figure 2) gradually increased.
The LM analysis revealed that four TP values (three T50 and one T75) had significant effects on the three am-plitudinal parameters in three of the six test foods (Table 2): i.e., “minimum inteSH amplitude” during the chew-ing of a prune (T50 and T75 values, Ps < 0.01); “maximum” inteSH amplitude with sponge cake (T50, P < 0.05), and “net inte SH amplitude” with cheese (T50, P < 0.05). The LM analysis also revealed that the “chewing cycles” fac-tor was significant in four of the six test foods (Table 2):
i.e., “minimum” inteSH amplitude during the chewing of rice cracker (P < 0.01), cheese, marshmallow, and prune (P < 0.05); “maximum” and “net” inteSH amplitudes with cheese (Ps < 0.01), and “SH duration” with cheese (P < 0.05).
4. Discussion
The results indicated that Mass activity patterns affected
Table 2. Statistical significances detected in the individual test foods used in this study.
Parameters Cheese Gummy
candy Marshmallow Prune Rice Cracker
Sponge Cake
Min SH ampli C
* C* T50**, T75**, C*
C**
Max SH ampli C
**
T50*
Net SH ampli T50*, C**
SH duration C*
Min, minimum; Max, maximum; SH, suprahyoid; ampli, amplitude of the integrated SH EMG; T50, T50 value; T75, T75 value; C, chewing cycle. **P < 0.01, *P < 0.05.
Figure 2. Sample data of masseter and suprahyoid muscle activities during the chewing of a prune. Mass EMG and iMass EMG, raw and integrated electromyograms of the masseter muscle, respectively; SH EMG and iSH EMG, raw and integrated electromyograms of the suprahyoid muscles, respectively. Numbers from 0.482 to 0.604 between the Mass and iMass EMGs indicate the T50 values calculated by
the TP technique. Vertical dotted lines indicate the begin-
ning and end of the Mass EMG. See Figure 1 for “ai”, “bi”
and “ci” (i = 1 to 5) in SH and iSH EMGs. Note that the first
SH EMG was not counted in this study. See the text for details. Vertical bars on the right indicate 1.0 mV and 5 mV∙s (for Mass and iMass EMGs) and 0.4 mV and 2 mV∙s (for SH and iSH EMGs), respectively; a horizontal bar in-dicates 0.5 s.
[image:4.595.315.533.280.476.2]parameters for assessing activity patterns. Consequently, it is challenging to compare our results to those of other investigators. We developed TP values that were specific to the assessment [13,14,18] and adopted the parameters (T25, T50 and T75 values) for the analysis in this study. As a result, we found only four significant effects of masse- ter TP values on the amplitudinal parameters of the SH muscles (Table 2). This finding suggests that masseter activity patterns can affect SH muscle amplitude during subsequent chewing cycles, but the effect is limited. Our results also suggest that the effect might be food depen- dent (Table 2).
A previous study in awake rabbits [8] recorded 12 tri- geminal muscle activities during chewing, and the au- thors extracted three principal components related to the amplitude from the recorded data: the jaw closers, jaw openers and posterior deep masseter. The authors sug- gested that there was independent control over the jaw opening and closing muscles, and also between the am- plitude and timing of the masticatory muscles during chewing. In healthy humans, a series of studies have been conducted that have simulated chewing experiments [9-11], in which the participants unexpectedly received changes in the simulated force used to mimic food resis- tance during natural jaw opening and jaw closing; the authors observed additional muscle activity in the jaw closers but not in the jaw openers. The findings from these studies [9-11] appear inconsistent with our results, which may in part be due to the largely experimental situations between the studies, i.e., the previous studies analyzed the influences of force changes on jaw opener activity concomitant with jaw closer, and not in subse- quent cycles; these studies only stated that the additional muscle activity evoked no coactivation of the jaw open- ers.
As shown in Table 2, we also found that the “chewing cycles” factor had effects on all of the four explanatory parameters in four (cheese, marshmallow, prune and rice cracker) of the six test foods. The present study analyzed the initial five cycles of each chewing sequence; thus, we do not know whether the effects were sustained through- out the chewing sequence. In addition, the small samples of both significant and non-significant test foods made it difficult to infer the reason for the difference between the two groups of test foods, at least based on food parame- ters (Table 1). A previous study, using four visco-elastic model foods with different hardness, analyzed mastica- tory muscle parameters collected during chewing of the model foods and demonstrated chewing cycle-dependent changes in the muscle parameters. This finding high- lights the importance of the initial five chewing cycles when evaluating the effects of food hardness on physio- logical parameters [18]. Consistent with our results, these studies suggest that food hardness can affect not only jaw
closing muscle activity during the initial five chewing cycles, but also jaw opening muscle activity, which is followed by jaw closing muscle activity.
5. Conclusion
TP values quantitatively assessed masseter activity pat- terns during the chewing of six test foods by ten healthy young adults. The masseter activity patterns partially af- fected the suprahyoid amplitude during subsequent chewing cycles in only two of the test foods. The chew- ing cycles also affected suprahyoid activity during sub- sequent chewing cycles.
Acknowledgements
This study was supported in part by Grants-in-Aid for Scientific Research from the Ministry of Education, Science and Culture of Japan (No. 195000667 and No. 22500740 to YM, No. 23700889 to TY and No. 2050072 to IA).
REFERENCES
[1] Y. Nakamura and N. Katakura, “Generation of Mastica- tory Rhythm in the Brainstem,” Neuroscience Research, Vol. 23, No. 1, 1995, pp. 1-19.
[2] S. Nozaki, A. Iriki and Y. Nakamura, “Role of Cortico- bulbar Projection Neurons in Cortically Induced Rhyth-mical Masticatory Jaw-Opening Movement in the Guinea Pig,” Journal of Neurophysiology, Vol. 55, No. 4, 1986, pp. 826-845.
[3] S. Nozaki, A. Iriki and Y. Nakamura, “Localization of Central Rhythm Generator Involved in Cortically Induced Rhythmical Masticatory Jaw-Opening Movement in the Guinea Pig,” Journal of Neurophysiology, Vol. 55, No. 4, 1986, pp. 806-825.
[4] Y. Yamada, K. Yamamura and M. Inoue, “Coordination of Cranial Motoneurons during Mastication,” Respiratory Physiology & Neurobiology, Vol. 147, No. 2-3, 2005, pp. 177-189. http://dx.doi.org/10.1016/j.resp.2005.02.017
[5] T. Inoue, T. Kato, Y. Masuda, T. Nakamura, Y. Kawa-mura and T. Morimoto, “Modifications of Masticatory Behavior after Trigeminal Deafferentation in the Rabbit,”
Experimental Brain Research, Vol. 74, No. 3, 1989, pp. 579-591. http://dx.doi.org/10.1007/BF00247360
[6] O. Hidaka, T. Morimoto, Y. Masuda, T. Kato, R. Matsuo, T. Inoue, M. Kobayashi and K. Takada, “Regulation of Masticatory Force during Cortically Induced Rhythmic Jaw Movements in the Anesthetized Rabbit,” Journal of Neurophysiology, Vol. 77, No. 6, 1997, pp. 3168-3179. [7] Z. J. Liu, K. Ikeda, S. Harada, Y. Kasahara and G. Ito,
“Functional Properties of Jaw and Tongue Muscles in Rats Fed a Liquid Diet after Being Weaned,” Journal of Dental Research, Vol. 77, No. 2, 1998, pp. 366-376. http://dx.doi.org/10.1177/00220345980770020501
Principal Components Analysis of Electromyographic Variation,” Experimental Brain Research, Vol. 127, No. 3, 1999, pp. 233-243.
http://dx.doi.org/10.1007/s002210050793
[9] F. A. Ottenhoff, A. van der Bilt, H. W. van der Glas and F. Bosman, “Peripherally Induced and Anticipating Ele-vator Muscle Activity during Simulated Chewing in Hu-mans,” Journal of Neurophysiology, Vol. 67, No. 1, 1992, pp. 75-83.
[10] F. A. Ottenhoff, A. van der Bilt, H. W. van der Glas and F. Bosman, “Control of Human Jaw Elevator Muscle Ac-tivity during Simulated Chewing with Varying Bolus Size,” Experimental Brain Research, Vol. 96, No. 3, 1993, pp. 501-512. http://dx.doi.org/10.1007/BF00234118
[11] A. van der Bilt, F. G. Weijnen, F. A. Ottenhoff, H. W. van der Glas and F. Bosman, “The Role of Sensory In-formation in the Control of Rhythmic Open-Close Move- ments in Humans,” Journal of Dental Research, Vol. 74, No. 10, 1995, pp. 1658-1664.
http://dx.doi.org/10.1177/00220345950740100601
[12] J. D. van Willigen, P. J. Juch, C. M. Ballintijn and M. L. Broekhuijsen, “A Hierarchy of Neural Control of Masti-cation in the Rat,” Neuroscience, Vol. 19, No. 2, 1986, pp. 447-455.
http://dx.doi.org/10.1016/0306-4522(86)90273-3
[13] I. Ashida, S. Kawakami and Y. Miyaoka, “A New Me-thod of Simulating Surface Electromyograms Using Pro- bability Density Functions,” Computers in Biology and Medicine, Vol. 38, No. 7, 2008, pp. 837-844.
http://dx.doi.org/10.1016/j.compbiomed.2008.05.001
[14] Y. Miyaoka, I. Ashida, D. Inagaki and S. Kawakami, “Differentiation of Activity Patterns in the Suprahyoid Muscles during Swallowing of Foods with Five Taste Qualities,” Journal of Sensory Studies, Vol. 20, No. 6, 2005, pp. 473-483.
http://dx.doi.org/10.1111/j.1745-459X.2005.00041.x
[15] Y. Miyaoka, I. Ashida, Y. Tamaki, S. Y. Kawakami, H. Iwamori, T. Yamazaki and N. Ito, “Sequential Analysis of Masseter Activity Patterns during Chewing in Healthy Males,” Journal of Medical Engineering & Technology, Vol. 37, No. 2, 2013, pp. 91-95.
http://dx.doi.org/10.3109/03091902.2012.747007
[16] I. Ashida, H. Iwamori, S. Kawakami, Y. Miyaoka and A. Murayama, “Analysis of Physiological Parameters of Masseter Muscle Activity during Chewing of Agars in Healthy Young Males,” Journal of Texture Studies, Vol. 38, No. 1, 2007, pp. 87-99.
http://dx.doi.org/10.1111/j.1745-4603.2007.00087.x
[17] C. Lassauzay, M. A. Peyron, E. Albuisson, E. Dransfield and A. Woda, “Variability of the Masticatory Process during Chewing of Elastic Model Foods,” European Jour- nal of Oral Sciences, Vol. 108, No. 6, 2000, pp. 484-492. http://dx.doi.org/10.1034/j.1600-0722.2000.00866.x