Smart Object, not Smart Environment:
Cooperative Augmentation of Smart Objects
Using Projector-Camera Systems
David Molyneaux
April 2008
Lancaster University
Abstract
Smart objects research explores embedding sensing and computing into everyday objects - augmenting objects to be a source of information on their identity, state, and context in the physical world. A major challenge for the design of smart objects is to preserve their original appearance, purpose and function. Consequently, many research projects have focussed on adding input capabilities to objects, while neglecting the requirement for an output capability which would provide a balanced interface.
This thesis presents a new approach to add output capability by smart objects cooperating with projector-camera systems. The concept of Cooperative Augmentation enables the knowledge required for visual detection, tracking and projection on smart objects to be embedded within the object itself. This allows projector-camera systems to provide generic display services, enabling spontaneous use by any smart object to achieve non-invasive and interactive projected displays on their surfaces. Smart objects cooperate to achieve this by describing their appearance directly to the projector-camera systems and use embedded sensing to constrain the visual detection process.
We investigate natural appearance vision-based detection methods and perform an experimental study specifically analysing the increase in detection performance achieved with movement sensing in the target object. We find that detection performance significantly increases with sensing, indicating the combination of different sensing modalities is important, and that different objects require different appearance representations and detection methods.
These studies inform the design and implementation of a system architecture which serves as the basis for three applications demonstrating the aspects of visual detection, integration of sensing, projection, interaction with displays and knowledge updating.
Preface
This dissertation has not been submitted in support of an application for another degree at this or any other university. It is the result of my own work and includes nothing which is the outcome of work done in collaboration except where specifically indicated.
Excerpts of this thesis have been published in conference and workshop manuscripts, most notably:
Acknowledgments
This work would not have been possible without the support and facilities offered by my supervisors Prof. Hans Gellersen and Dr. Gerd Kortuem. I thank them both for their never-ending encouragement, inspiration and guidance throughout my time as a PhD student. I consider myself lucky to have been given the opportunity to work in such an interesting field and honoured to have been part of the exceptional research group they have created at Lancaster. The unique lab environment with the large international crowd of people makes it a special place, and one that I will cherish forever.
I wish to thank all those other colleagues in the Ubicomp group at Lancaster who, either through direct assistance, or in discussions have helped this work in some way:
Henoc Agbota, Mohammed Alloulah, Bashar Al Takrouri, Urs Bischoff, Florian Block, Carl Fischer, Roswitha Gostner, Andrew Greaves, Yukang Guo, Robert Hardy, Mike Hazas, Henrik Jernström, Serko Katsikian, Chris Kray, Kristof van Laerhoeven, Rene Mayrhofer, Matthew Oppenheim, Faizul Abdul Ridzab, Enrico Rukzio, Dominik Schmidt, Jennifer Sheridan, Martin Strohbach, Vasughi Sundramoorthy, Nic Villar, Jamie Ward and Martyn Welsh.
Plus all the visitors and other alumni: Aras Bilgen, Martin Berchtold, Andreas Bulling, Clara Fernández de Castro, Manuel García-Herranz del Olmo (especially for all the boiled eggs), Alina Hang, Pablo Haya, Paul Holleis, Matthew Jervis, Russell Johnson, Yasue Kishino, Matthias Kranz, Masood Masoodian, Christoph März, Michael Müller, Kavitha Muthukrishnan, Albrecht Schmidt, Sara Streng, Tsutomu Terada and all those other people I have encountered at Lancaster during my time here.
Special thanks go to some of the most important people at Lancaster - the secretaries and support staff who have helped me during my time here Aimee, Ben, Cath, Chris, Gillian, Helen, Ian, Jess, Liz, Sarah, Steve and Trish. Also thanks to Gordon for being a superb head of department and to CAKES for interesting presentations and away-days.
Others outside of Lancaster have also helped greatly with this work, most notably Bernt Schiele in Darmstadt – without his support and guidance much of this work would not have been possible. I am greatly indebted to him. Thanks also to everyone from Multimodal Interactive Systems in Darmstadt for the great visits: Krystian Mikolajczyk, Bastion Leibe, Gyuri Dorko, Edgar Seemann, Mario Fritz, Andreas Zinnen, Nicky Kern, Tam Huynh, Ulrich Steinhoff, Niko Majer and Ursula Paeckel.
The FLUIDUM project and specifically Andreas Butz and Mira Spassova deserve a big mention, as that is where it all started. Without your initial support, Java code and spark of enthusiasm for the steerable projector work I would never have travelled as far as I did during my PhD journey. Thanks also to those whose code was incorporated in some form in the demos, most notably Mark Pupilli from Bristol for the basic Particle Filter and Rob Hess for the SIFT implementation I modified for my work.
Thanks to both my examiners – Mike Hazas and Andrew Calway from the University of Bristol for the interesting discussions and insights during the viva that have enhanced this thesis greatly beyond its initial submission.
Augmentation in the last two years than she would otherwise want to... Thank you for being there for me Rose, I hope I can do the same for you.
Finally, I would like to thank the projects and organisations that funded this work, namely the EPSRC, the Ministry of Economic Affairs of the Netherlands through the BSIK project Smart Surroundings under contract no. 03060 and Lancaster University through the e-Campus grant.
David Molyneaux
CONTENTS
Contents
CHAPTER 1 INTRODUCTION ... 1
1.1 SMART OBJECT OUTPUT ... 1
1.2 COOPERATIVE AUGMENTATION ... 2
1.3 CHALLENGES ... 3
1.4 CONTRIBUTIONS ... 4
1.5 THESIS STRUCTURE ... 5
CHAPTER 2 RELATED WORK ... 6
2.1 INTRODUCTION ... 6
2.2 UBIQUITOUS COMPUTING ... 8
2.2.1 Sensor Nodes ... 9
2.2.2 Smart Objects ... 10
2.2.3 Tangible User Interfaces ... 12
2.2.4 Input-Output Imbalance ... 14
2.3 PROJECTOR-BASED AUGMENTED REALITY ... 14
2.3.1 Projector-Camera Systems ... 16
2.3.2 Mobile, Handheld and Wearable Projector-Camera Systems ... 17
2.3.3 Multi-Projector Display Systems ... 18
2.3.4 Steerable Projector-Camera Systems ... 19
2.3.5 Interaction with Projector-Camera System Displays ... 22
2.3.6 Projected Display Geometrical Calibration ... 26
2.3.7 Projection Photometric and Colorimetric Calibration ... 31
2.3.8 Issues with Projector-based Augmented Reality ... 33
2.3.9 Mobile Objects ... 36
2.4 DETECTION AND TRACKING OF OBJECTS ... 37
2.5 FIDUCIAL MARKER DETECTION AND TRACKING ... 37
2.6 NATURAL APPEARANCE DETECTION AND TRACKING ... 40
2.6.1 Tracking ... 40
2.6.2 Detection ... 42
2.6.3 Multi-Cue Detection and Tracking ... 45
2.6.4 Camera Model ... 46
2.6.5 Pose calculation ... 48
2.6.6 Hybrid Detection ... 50
2.7 VISION-BASED DETECTION WITH PHYSICAL SENSING ... 50
2.7.1 Sensing for Pose and Object Motion Prediction ... 51
2.7.2 Structured Light Sensing for Location and Pose ... 51
2.8 SUMMARY ... 53
CHAPTER 3 COOPERATIVE AUGMENTATION CONCEPTUAL FRAMEWORK ... 54
3.1 COOPERATIVE AUGMENTATION ENVIRONMENT ... 55
3.2 THE OBJECT MODEL ... 55
CONTENTS
3.4 COOPERATIVE AUGMENTATION PROCESS ... 57
3.4.1 Detection ... 59
3.4.2 Projection ... 60
3.5 CONCLUSION ... 61
CHAPTER 4 VISION-BASED OBJECT DETECTION ... 62
4.1 NATURAL APPEARANCE DETECTION ... 62
4.2 OBJECT DETECTION METHODS ... 63
4.3 EVALUATION DATASET ... 64
4.3.1 Object Appearance Library ... 64
4.4 SCALE AND ROTATION EXPERIMENTS ... 65
4.4.1 Design ... 66
4.4.2 Procedure ... 67
4.4.3 Apparatus ... 69
4.4.4 Results ... 69
4.5 DISCUSSION ... 74
4.6 CONCLUSION ... 76
CHAPTER 5 COOPERATIVE DETECTION ... 77
5.1 VIDEO TEST LIBRARY ... 77
5.2 COOPERATIVE DETECTION EXPERIMENTS ... 78
5.2.1 Design ... 78
5.2.2 Training ... 79
5.2.3 Procedure ... 79
5.2.4 Results ... 80
5.3 DISCUSSION ... 85
5.3.1 Single Cue Detection ... 86
5.3.2 Multi-Cue Combination ... 88
5.3.3 Limitation of Movement Sensing ... 89
5.3.4 Use of Sensing in smart objects for Pose Calculation ... 89
5.4 CONCLUSION ... 90
CHAPTER 6 SYSTEM ARCHITECTURE ... 92
6.1 ARCHITECTURE DESIGN OVERVIEW ... 92
6.1.1 Architecture Novelty ... 94
6.2 ARCHITECTURE COMPONENTS ... 95
6.2.1 Detection and Tracking ... 95
6.2.2 Projection ... 98
6.2.3 Pan & Tilt Tracking Component ... 99
6.2.4 Smart Objects ... 102
6.2.5 Object Proxy... 105
6.2.6 Database Server ... 105
6.2.7 Knowledge Updating ... 107
6.3 IMPLEMENTATION ... 108
6.3.1 Detection and Tracking ... 109
6.3.2 Projection ... 114
6.3.3 Pan and Tilt Control ... 117
6.3.4 Object Proxy... 118
6.3.5 Database Server ... 119
6.3.6 Networking Protocol Implementation ... 119
6.4 PROJECTOR-CAMERA SYSTEM CALIBRATION ... 122
6.5 DISCUSSION ... 124
6.6 DETECTION METHOD MEMORY EXPERIMENTS ... 125
6.6.1 Design ... 126
6.6.2 Results ... 126
6.6.3 Discussion ... 127
6.7 POSE CALCULATION,POSE JITTER AND PROJECTION ACCURACY EXPERIMENTS ... 128
6.7.1 Design ... 128
6.7.2 Procedure ... 129
CONTENTS
6.7.4 Results ... 130
6.7.5 Discussion ... 133
6.8 CONCLUSION ... 134
CHAPTER 7 DEMONSTRATION APPLICATIONS ... 136
7.1 SMART COOPERATIVE CHEMICAL CONTAINERS ... 136
7.1.1 Object Model ... 136
7.1.2 Registration ... 137
7.1.3 Detection ... 137
7.1.4 Projection ... 138
7.1.5 Manipulating the Object ... 138
7.1.6 Knowledge Updating ... 140
7.1.7 Objects Departing the Environment ... 140
7.1.8 Discussion ... 141
7.2 SMART PHOTOGRAPH ALBUM ... 142
7.2.1 Object Model ... 143
7.2.2 Registration and Detection ... 144
7.2.3 Projection and Manipulation... 144
7.2.4 Discussion ... 144
7.3 SMART COOKING ... 148
7.3.1 Hard-Boiled Egg Recipe ... 148
7.3.2 Object Model ... 149
7.3.3 Task Procedure ... 149
7.3.4 Discussion ... 152
7.4 CONCLUSION ... 155
CHAPTER 8 CONCLUSION ... 156
8.1 CONTRIBUTIONS AND CONCLUSIONS ... 156
8.2 BENEFITS OF OUR APPROACH ... 158
8.3 LIMITATIONS ... 159
8.4 FUTURE WORK ... 160
BIBLIOGRAPHY ... 162
APPENDIX A STEERABLE PROJECTOR-CAMERA SYSTEM CONSTRUCTION .... 176
A.1 STEERABLE PROJECTOR-CAMERA SYSTEM DESIGN ... 176
A.2 STEERING MECHANISM ... 176
A.2.1 Steering Mechanism Characteristics ... 177
A.2.2 Moving Mirror and Moving Head comparison ... 180
A.3 VIDEO PROJECTOR ... 181
A.4 CAMERA ... 184
A.5 COMMERCIAL STEERABLE PROJECTORS ... 187
A.6 CONSTRUCTION OF STEERABLE PROJECTOR SYSTEMS ... 188
A.7 STEERABLE PROJECTOR HARDWARE ... 189
A.7.1 Projector Selection ... 189
A.7.2 Steering Mechanism Selection ... 190
A.7.3 Camera Selection ... 190
A.8 MOVING HEAD STEERABLE PROJECTOR CONSTRUCTION ... 191
A.8.1 Moving Head Control ... 193
A.9 MOVING MIRROR STEERABLE PROJECTOR CONSTRUCTION ... 194
A.10 CHARACTERISATION OF MOVING HEAD MECHANISM ... 195
A.10.1 Design ... 195
A.10.2 Procedure ... 196
A.10.3 Results ... 197
A.10.4 Discussion ... 197
A.11 CHARACTERISATION OF PROJECTOR ... 198
A.12 STEERABLE PROJECTOR SYSTEM COMPARISON ... 200
A.13 CONCLUSION ... 202
APPENDIX B SMART OBJECT PROGRAMMING EXAMPLES ... 204
CONTENTS
B.2 SMART BOOK ... 205 B.3 SMART FURNITURE ASSEMBLY ... 206
LIST OF FIGURES
List of Figures
Figure 1.1 Cooperative Augmentation of smart objects with Projector-Camera Systems 3 Figure 2.1 This work draws from 4 main areas of computing: Ubiquitous Computing,
Augmented Reality, Computer Vision and Tangible User Interfaces (TUI) ... 6 Figure 2.2 The "Weiser Continuum" of ubiquitous computing [Weiser 1996] to
monolithic computing, taken from [Newman, Bornik et al. 2007] ... 6 Figure 2.3 The Milgram and Kishino “Virtuality” Continuum of Reality to Virtual
Reality [Milgram and Kishino 1994], taken from [Newman, Bornik et al. 2007] .... 7 Figure 2.4 The Milgram-Weiser Continuum [Newman, Bornik et al. 2007] ... 8 Figure 2.5 (left) Smart-Its design (centre) Particle Smart-Its Device main board, (right) Add-on sensor boards [Decker, Krohn et al. 2005] ... 9 Figure 2.6 (left) Crossbow Technology Motes (right) Motive Corporation (now Sentilla Corporation) Telos Mote [Inc 2007] ... 10 Figure 2.7 (left) Mediacup Object [Gellersen, Beigl et al. 1999], (centre) Cooperative
Chemical Containers, (right) Hazard warning display using 3 LEDs [Strohbach, Gellersen et al. 2004] ... 11 Figure 2.8 (left) Proactive Furniture Assembly [Antifakos, Michahelles et al. 2004],
(centre) Display Cube Object [Terrenghi, Kranz et al. 2006], (right) Tuister Object [Butz, Groß et al. 2004] ... 11 Figure 2.9 Using a sensor enabled Cubicle for interaction [Block, Schmidt et al. 2004]
... 13 Figure 2.10 (left) Prototype mock-up display cube using static front-projection, (centre)
The current LED-matrix display Z-agon interactive cube, (right) The envisioned fully interactive cube with colour displays [Matsumoto, Horiguchi et al. 2006] .... 13 Figure 2.11 (left) A chessboard with memory (centre) Interactive optics-design, (right)
A prototype I/O bulb projector-camera system in the Luminous Room [Underkoffler, Ullmer et al. 1999] ... 15 Figure 2.12 Spatially Augmented Reality (SAR) [Raskar, Welch et al. 1999] ... 16 Figure 2.13 The Projector-Camera system family decomposed by mobility and display size, compared to traditional desktop monitors ... 17 Figure 2.14 (left and centre) The iLamps Project developed a handheld
LIST OF FIGURES
Figure 2.15 SONY’s Handheld spotlight projector [Rapp, Michelitsch et al. 2004], (centre left) Multi-user interaction using handheld projectors [Cao, Forlines et al. 2007], (right) Wearable Projector-camera system [Karitsuka and Sato 2003] ... 18 Figure 2.16 (left) The PixelFlex reconfigurable multi-projector display [Yang, Gotz et
al. 2001], (right) Ad-hoc projector clustering and geometric correction for seamless display with iLamps [Raskar, VanBaar et al. 2005] ... 19 Figure 2.17 IBM’s Everywhere Display demonstration at SIGGRAPH [Pinhanez 2001]
... 19 Figure 2.18 (left) Messaging notification, (centre) dynamic navigation signage, (right)
augmented filing cabinet object [Pinhanez 2001] ... 20 Figure 2.19 (left and centre) Portable Projected Display Screen [Borkowski 2006],
(right) Personal Interaction Panel [Ehnes, Hirota et al. 2004] ... 20 Figure 2.20 IBM’s Steerable Interface EDML Framework ... 21 Figure 2.21 The IBM Steerable Interfaces Characterisation [Pingali, Pinhanez et al.
2003] ... 22 Figure 2.22 Interaction Techniques for Projected Displays ... 22 Figure 2.23 Fingertip matching in (a) Camera image, (b) Motion mask, (c) Finger tip
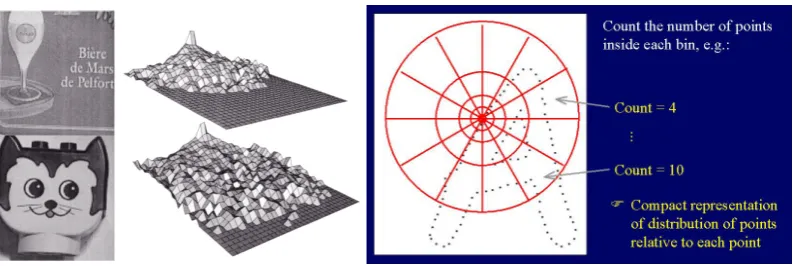
template match [Pinhanez, Kjeldsen et al. 2001] ... 25 Figure 2.24 (far left) Polar Motion Map, (left) the corresponding segments unrolled to a rectangle, (right) PMM in use [Kjeldsen 2005] ... 25 Figure 2.25 (left) Using a red paper slider widget [Kjeldsen 2005], (right) Increasing
camera exposure to compensate for projector light [Letessier and Bérard 2004] .. 26 Figure 2.26 (left) On-axis projection gives a rectangular image, (right) Geometric
distortion due to horizontal projector rotation when projecting onto a planar screen ... 26 Figure 2.27 Classification of projector-camera system geometrical calibration methods,
based on [Borkowski, Riff et al. 2003] ... 27 Figure 2.28 Model-based distortion correction based on known surface geometry and
pose relative to the projector [Pinhanez 2001] ... 28 Figure 2.29 Projecting dots onto a planar screen to recover the projector-camera
homography ... 28 Figure 2.30 (left) Creating the projector-camera homography, (right) Using the
combined projector-screen transformation to project an undistorted image [Sukthankar, Stockton et al. 2001] ... 29 Figure 2.31 (left) Gray-code structured light patterns (centre) Geometrically corrected
multi-projector display on curved display [Raskar, VanBaar et al. 2005], (right) Automatic Projector Display Surface Estimation Using Every-Day Imagery [Yang and Welch 2001] ... 30 Figure 2.32 (left) Colour correction to project on any surface [Bimber, Emmerling et al. 2005], (right) Real-time adaptation for mobile objects [Fujii, Grossberg et al. 2005] ... 32 Figure 2.33 (left and centre) Uneven illumination on a non-planar surface, (right)
uncompensated and intensity compensated image [Park, Lee et al. 2006] ... 33 Figure 2.34 VRP used to overcome occluding light shadows [Summet, Flagg et al.
LIST OF FIGURES
Figure 2.35 (left) Interactive buttons projected on a variety of everyday surfaces, (right) Dynamic Shader Lamps projecting on mobile tracked object [Bandyopadhyay,
Raskar et al. 2001] ... 35
Figure 2.36 (left) Examples of different Fiducial Marker systems [Fiala 2005], (right) Using ARToolkit Markers with a HMD to view a virtual character [Kato and Billinghurst 1999] ... 38
Figure 2.37 ARToolkit Recognition and Overlay method [Kato and Billinghurst 1999] ... 38
Figure 2.38 (left and centre) Occlusion of ARToolkit marker prevents tracking, (right) Occlusion of ARTag marker [Fiala 2005] ... 39
Figure 2.39 (left) AR Toolkit fails to detect markers under different illumination conditions in the same frame [Fiala 2005], (right) Ehnes et al. track ARToolkit markers with a steerable projector and project on modelled surfaces in the marker area [Ehnes, Hirota et al. 2004] ... 40
Figure 2.40 (left) Drummond and Cipolla’s RAPiD-like algorithm, (right) robustness to partial occlusion [Drummond and Cipolla 2002] ... 41
Figure 2.41 (left) Two dissimilar objects and their Mag-Lap histograms corresponding to a particular viewpoint, image plane rotation and scale. [Schiele and Crowley 2000], (right) Shape Context 2D log-polar histogram based on relative point locations [Belongie, Malik et al. 2002] ... 43
Figure 2.42 (left) SIFT local feature based AR method, (right, top) SIFT Features detected on a mug, (right, bottom) AR teapot added to camera display [Gordon and Lowe 2004] ... 45
Figure 2.43 (left) Pinhole Perspective Camera Model, (right) Checkerboard pattern for camera calibration with overlaid pattern coordinate system ... 47
Figure 2.44 (left) Projection on mobile planar surfaces with single light sensor [Summet and Sukthankar 2005], (right) Projection onto surfaces with sensors at each corner for rotation information [Lee, Hudson et al. 2005] ... 52
Figure 3.1 Detection Sequence Diagram ... 58
Figure 3.2 Projection Sequence Diagram ... 58
Figure 3.3 Knowledge flow in the detection process ... 59
Figure 4.1 Experiment Objects (left to right, top to bottom): a football, a chemical container barrel, a book, a product box, a smart cube, a chair, a cup, a notepad, a cereal box and a toaster. ... 64
Figure 4.2 (left) Box Object Scale images at 1m, 3m, 6m from camera, (right) Notepad object rotation images at -40°, 0°, +40° ... 64
Figure 4.3 Different numbers of corner features (yellow dots) are detected and in different locations on the Cereal box object at 1m, 3m and 6m distance with the single-scale Harris algorithm [Harris and Stephens 1988] ... 65
Figure 4.4 Camera and Object Detection Coordinate System Transformations ... 65
Figure 4.5 (left) Number of features detected on Mediacube object by Harris-based algorithms, (right) Harris-based algorithm detector repeatability when trained at 4m ... 70
LIST OF FIGURES
Figure 4.7 (left) SIFT Descriptor matching percentages with 2D rotation, (right) Number of features detected with 3D rotation ... 71 Figure 4.8 (left) Detector repeatability for 3D rotation, (right) Descriptor matching
percentages for 3D rotation ... 72 Figure 4.9 (left) Detection performance over all objects for SIFT local features at 1m,
2m and 6m training distances, (right) Detection performance over all objects for Shape Context at 1m, 3m and 6m training distances. ... 73 Figure 4.10 (left) Detection performance over all objects for Texture (Mag-Lap)
Multidimensional Histograms at 1m, 2m and 6m training distances, (right) Detection performance over all objects for LAB Colour Histograms at 1m, 3m and 6m training distances. ... 73 Figure 4.11 (left) Detection percentage repeatability of SIFT (DoG) over all objects
when varying 3D rotation angle, (right) Detection performance over all objects when varying 3D rotation angle, for Texture, Colour and Shape, at 3m training and test distances. ... 74 Figure 5.1 Video Test library images of chemical container (top) and cereal box
(bottom). ... 77 Figure 5.2 Graph of detection algorithm results without sensing (orange) and with
movement sensing (blue), averaged over all objects. Error bars show 95% Confidence level (Cl) of mean. ... 80 Figure 5.3 (left) SIFT Local Feature Detection Performance with and without sensing for each object in test library, (right) Mag-Lap Texture Detection Performance with and without sensing for each object in test library ... 82 Figure 5.4 (left) Lab Colour Detection Performance with and without sensing for each
object in test library, (right) Shape Context Detection Performance with and without sensing for each object in test library ... 82 Figure 5.5 Detection Performance improvement using multiple cues, No Sensing ... 85 Figure 5.6 Detection Performance improvement using multiple cues and Movement
Sensing ... 85 Figure 6.1 Distributed System Architecture Overview ... 93 Figure 6.2 Detection method selection based on smart object knowledge ... 96 Figure 6.3 The 4 coordinate systems: Camera, Projector and smart object Local
Coordinate Systems, and the arbitrary World Coordinate System ... 97 Figure 6.4 Search Methods: (left) Creeping Line Search over the whole Pan and Tilt
Field Of View, (right) Expanding-Box search from previous object location ... 100 Figure 6.5 Two views of a Lab Environment: (left) South-West Elevation, (right)
North-East Elevation ... 108 Figure 6.6 The moving-head steerable projector-camera system ... 109 Figure 6.7 View down into a background model re-projected into a hemisphere,
captured by rotating a moving head steerable projector through a 360x90º FOV. ... 111 Figure 6.8 (left) Image of detected of Book object with overlaid 3D model and object
LIST OF FIGURES
Figure 6.9 (left) 3 surface projection on box object, (right) Sensed temperature projected on the non-planar smart mug surface - the blue wire at the right is the antenna of
the Smart-Its device ... 116
Figure 6.10 Architecture Message Protocol and Routing. ... 120
Figure 6.11 (left) Composite image of ARToolkit marker aligned with 5 far calibration locations and handheld for one of the near calibration locations, (right) Projector Calibration using projected pattern on planar surface [Park, Lee et al. 2006] ... 124
Figure 6.12 The location accuracy and jitter experiment object grid locations, orthoganal to the camera. Object test locations are the green circles. ... 129
Figure 6.13 Error in Z-axis location for objects at a large distance from the camera causes smaller error in the X,Y location error of the projection ... 134
Figure 7.1 (left) New objects arrives in environment, (centre) An employee walks with containers, (right) The employee places one object on the floor ... 137
Figure 7.2 (left) Detected container with green wireframe 3D Model superimposed on the camera view using calculated pose, (right) A warning message projection on two chemical containers ... 138
Figure 7.3 Partial Object Model representation of Chemical Container Demonstrator 139 Figure 7.4 (left) Scale and rotation invariant local features detected on chemical containers, (right) A container leaves the environment with the employee ... 140
Figure 7.5 Photograph Album smart object with Projection (left) front cover, button state 10 (centre) being opened, (right) inside, button state 5 ... 143
Figure 7.6 Partial Object Model representation of Photo Album Demonstrator ... 146
Figure 7.7 Photograph Album Content to Project ... 147
Figure 7.8 (left) Recipe State 0, (right) Add Egg Projection inside pan ... 150
Figure 7.9 Recipe State 8 ... 151
Figure 7.10 (left) Example salt 3D model, (right) 3D model with added base projection area ... 153
Figure A.1 (left) Moving mirror display light, (right) Moving head display light [SteinigkeShowtechnicGmbH 2005] ... 177
Figure A.2 (left) The IBM Everywhere Display Steerable Projector Design, (right) Everywhere Display Projection Cone [Pinhanez 2001] ... 178
Figure A.3 (left) Single chip DLP projector optics [TexasInstruments 2005], (right) Mitsubishi Pocket Projector [MitsubishiElectricCorporation 2008] ... 183
Figure A.4 (left) A Co-axial projector-camera system [Fujii, Grossberg et al. 2005] (centre) Camera Resolution Test Chart [Geoffrion 2005], (right) Bayer Pattern Colour Filter Array [Geoffrion 2005] ... 185
Figure A.5 (left) Futurelight PHS150 Single arm Yoke, (right) Compulite “Luna” dual fork Yoke ... 190
Figure A.6 The pan and tilt yoke uncovered ... 191
Figure A.7 Steerable Projector Cabling Layout ... 192
LIST OF FIGURES
Figure A.9 (left) The operational moving head steerable projector system, (centre) The tripod-mounted moving mirror steerable projector system, (right) Close-up of
operational moving mirror yoke and pan-tilt camera ... 194
Figure A.10 Moving Mirror Steerable Projector Cabling ... 195
Figure A.11 (left) Image Size versus Distance at Zoom 0, (right) Image Size versus Distance at Zoom 20 (mid-zoom) ... 199
Figure A.12 (left) Display resolution versus distance to projection surface at Zoom 0, (right) Display resolution versus distance to projection surface at Zoom 20 ... 199
Figure A.13 (left) Focus steps versus distance to display surface at Zoom 0, (right) Focus steps versus distance to display surface at Zoom 20 ... 200
Figure B.1 State Machine Program for Detecting Rough Handling of a smart object . 205 Figure B.2 State Machine Program for Articulated Smart Book with Force Sensors on Each Page ... 206
Figure B.3 Smart Furniture Assembly Program for 3 Individual Pieces ... 207
Figure B.4 Hard-Boiled Egg Recipe States 0-2 ... 208
Figure B.5 Hard-Boiled Egg Recipe States 3-5 ... 209
Figure B.6 Hard-Boiled Egg Recipe States 6-8 ... 210
Figure B.7 Hard-Boiled Egg Recipe States 8-10 ... 211
LIST OF TABLES
List of Tables
Table 5.1 Mean algorithm runtime per frame, averaged over 200 frames ... 81
Table 5.2 Mean time to detection from first entry to the environment ... 81
Table 5.3 Ranking of Cues by Detection Results for Each Object, No Movement Sensing ... 84
Table 5.4 Ranking of Cues by Detection Results for Each Object, with Movement Sensing ... 84
Table 5.5 Guidance for which method to use, based on object appearance type ... 87
Table 6.1 Appearance knowledge levels and detection methods with associated processing cost ... 95
Table 6.2 Geometric correction methods for projection based on object geometry [Bimber and Raskar 2005] ... 98
Table 6.3 Memory requirements for Appearance Knowledge and the total Object Model with single viewpoint (minimum) and full viewing sphere (maximum) ... 127
Table 6.4 Median Rotation Error results for each object, over -70° to +70° Out-of-plane and 10° to 350° in-plane. ... 131
Table 6.5 Median Location Calculation Error in X,Y,Z Camera Coordinate System for each object, averaged over all grid locations ... 131
Table 6.6 Median Projection Location Error on the Object X,Y front surface plane for each object, averaged over all grid locations. ... 131
Table 6.7 Median 3D Object Location Jitter from Median Location for each object, averaged over all grid locations. ... 132
Table 6.8 Median Projection Location Jitter from Median Location on the Object front surface plane for each object, averaged over all grid locations. ... 132
Table A.1 Four commercial steerable projectors ... 187
Table A.2 Projector Specifications ... 189
Table A.3 Yoke Selection Specifications ... 190
Table A.4 Moving Head Steerable Projector Characterisation ... 197
Table A.5 Steerable Projector Steering Mechanism Comparison ... 201
Table A.6 Steerable Projector Video Projector Comparison ... 201
1.1 SMART OBJECT OUTPUT
Chapter 1
Introduction
One of the central visions of Ubiquitous Computing is that the environment itself becomes the user interface [Ishii and Ullmer 1997]. Interaction will be significantly different than with traditional computing – physical objects, surfaces and spaces themselves will allow us to perform our tasks, while the technology itself becomes transparent, disappearing into the background [DisappearingComputer 2002]. Interaction will no longer be device centric, but information centric, allowing both implicit and explicit interaction with the information represented and sensed by physical objects [Schmidt, Kranz et al. 2005].
Smart objects research explores embedding sensing and computing into everyday objects - augmenting objects to be a source of information on their identity, state, and context in the physical world. While many research projects have focussed on adding input capabilities to objects, less attention has been paid to adding output, creating an imbalance in the interface. Giving an object output capability allows users to address tasks in physical space with direct feedback on the objects themselves. This thesis investigates how we can support physical objects simultaneously as input and output medium, redressing the imbalance in the interface.
The first chapter presents a short motivation for the work, a section on the specific problems we identified, describes our approach and the contributions we make.
1.1
Smart Object Output
As the interest in creating smart objects grows they are expected to bridge the gap between the physical and digital world, becoming part of out lives in economically important areas such as retail, supply chain or asset management [Lampe and Strassner 2003; Siegemund and Flörkemeier 2003; Decker, Beigl et al. 2004] and health and safety monitoring in work places [Strohbach, Gellersen et al. 2004; Kortuem, Alford et al. 2007]. A major challenge for the design of smart objects is to preserve their original appearance, purpose and function, thus exploiting natural interaction and a user’s familiarity with the object [Schmidt, Strohbach et al. 2002].
1.2 COOPERATIVE AUGMENTATION
One approach is to routinely embed displays in objects. For example, thin, flexible displays such as e-paper are expected to become common in a few years time. However, this approach is expensive, especially if the object is disposable, and inflexible, as the product designer must choose at design-time which surfaces are to be augmented. An additional problem is that embedded displays change an object’s appearance and can change the way an object is used. For example, consider that adding a display to a smart cup would prevent it being put in the dishwasher unless the display was removable. Either way, we have changed the object’s natural appearance and function.
Another way we could visualise this information is by using Augmented Reality display devices, such as head mounted displays (HMD), tablet PCs, PDAs or mobile phones. However, carrying special purpose devices is encumbering for a user and limits interaction to a single person, whereas there are many times when it would be beneficial for a group of users to see the same display simultaneously.
In contrast, the recent availability of small, cheap and bright video projectors makes them practical for augmenting objects with non-invasive projected displays. By adding a camera and using computer vision techniques, a projector-camera system can also dynamically detect and track objects [Borkowski, Riff et al. 2003; Ehnes, Hirota et al. 2004], correct for object surface geometry [Pinhanez 2001; Borkowski, Riff et al. 2003; Ehnes, Hirota et al. 2004; Bimber and Raskar 2005], varying surface colour and texture [Fujii, Grossberg et al. 2005] and allow the user to interact directly with the projected image [Kjeldsen, Pinhanez et al. 2002]. The use of a projector-camera system does not rely on adding to or modifying the hardware of the object itself, instead creating temporary displays on objects in the environment without permanently changing their appearance or function.
The traditional way of augmenting objects with projector-camera systems (such as that taken by Pinhanez [Pinhanez 2001] and Raskar et al. [Bandyopadhyay, Raskar et al. 2001; Raskar, Beardsley et al. 2006]) is to store all information about the object in the projector system itself. Usually such systems are installed as infrastructure in the environment, creating a smart environment. This approach reduces flexibility, as it requires a-priori knowledge about all possible objects which can enter the environment. This results in large databases of objects and consequently higher possibility of inter-object confusion during detection.
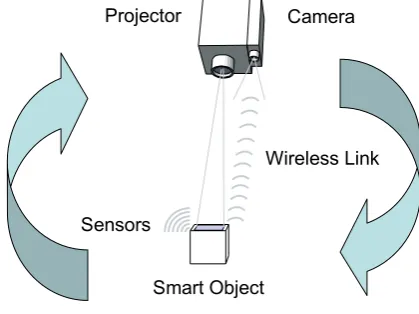
1.2 Cooperative
Augmentation
The core contribution of this thesis is the development of a new approach called Cooperative Augmentation to support physical objects simultaneously as input and output medium, as illustrated in Figure 1.1.
Instead of storing knowledge about objects in a smart environment, the Cooperative Augmentation concept distributes knowledge into smart objects. Hence, the intelligence becomes embodied in the smart objects inhabiting a space, not the space itself.
By moving the knowledge and intelligence from the environment to the smart object a projector-camera system no longer needs a-priori knowledge of all objects. This allows us to make projector-camera systems ubiquitous, as they merely offer a generic display service to all smart objects.
1.3 CHALLENGES
use of projection for output capability by requesting use of the projector-camera display service. Continued cooperation allows smart objects to describe information to the projector-camera system vital to the visual-detection and projection process, such as knowledge of their appearance. This knowledge is used to dynamically tailor the projector-camera services to each object.
Many objects possess embedded sensors designed for specific purposes. In the Cooperative Augmentation approach sensor information from the object can be serendipitously integrated in the detection and tracking process. The additional information from sensing allows projector-camera systems to dynamically constrain the detection process and increase visual detection performance.
After detection the smart object controls the interaction with projector-camera systems. The smart object issues projection requests to the projector-camera system, controlling how the projected output on its surfaces changes and allowing direct visual feedback to interaction.
Smart Object
Projector Camera
Sensors
[image:19.595.210.420.275.432.2]Wireless Link
Figure 1.1 Cooperative Augmentation of smart objects with Projector-Camera Systems
1.3 Challenges
The key concepts of Cooperative Augmentation discussed above raise questions which we address in this thesis.
The initial question is how we can model the object and projector-camera system so that objects can cooperate by describing relevant aspects of their knowledge. This modelling must allow applications using the Cooperative Augmentation approach to be written independent of a particular system, but adapt themselves to it.
A central problem to achieving displays on everyday objects (smart or not) is also their detection and tracking. Only when an object is detected can the projector-camera system align its projection so the image is registered with the object’s surfaces. In this thesis we use vision-based detection as it does not require adding dedicated location system hardware to every object to enable detection.
1.4 CONTRIBUTIONS
blue cover. Similarly, one book could be open and one closed. Here the book objects are fundamentally identical in concept and use, but vary in both appearance and form.
Another challenge is that objects can appear at any distance and orientation with respect to a tracking camera. For example, we can see detail on a book cover when it is close to the camera, but this detail disappears when it is far away. Similarly, when we change our viewpoint from looking at the cover of the book to looking at its side we now see white pages instead of a colourful cover. To understand how best to detect and track smart objects using natural appearance detection methods we must therefore study the impact of scale and rotation.
One of the limitations of vision-based detection is that it has many failure modes. Some common reasons for detection failure include changes in object appearance, changing illumination, occlusion of the object, distractions in the image and fast movement of the camera or object. The Cooperative Augmentation approach enables integration of sensor information in the detection process, but to best understand how to integrate this information we must study how this sensing can be best exploited to increase detection performance.
1.4 Contributions
Giving an object output capability is valuable as it allows users to address tasks in physical space and receive direct feedback on the objects themselves, where it belongs in the real world. However, adding output capability to smart objects while preserving their original appearance and functions is challenging.
To address this challenge we present the Cooperative Augmentation approach, contributing the following to the area of ubiquitous computing:
1. The novel concept of Cooperative Augmentation, which enables: a. Generic projection services in the environment.
b. Spontaneous use of projection capability by smart objects. c. Detection and tracking of mobile objects in the environment. d. Non-invasive output capability on smart objects.
e. Use of smart object as input and output interface simultaneously. 2. Validation of the Cooperative Augmentation concept through:
a. A system architecture specifying the different cooperating components. b. Implementation of the system architecture.
c. Three demonstration applications.
3. An investigation of natural appearance vision based detection, providing:
a. A study to understand the impact of object scale and rotation on different natural appearance detection methods.
b. Insight into training requirements of different detection approaches.
4. An investigation of the integration of embedded sensing in the detection process, providing:
a. A study to analyse the increase in detection performance achieved with movement sensing in the target object.
1.5 THESIS STRUCTURE
1.5 Thesis
Structure
This thesis explores the cooperative augmentation of smart objects with displays using projector-camera systems:
Chapter 2 provides an overview of related work relevant for understanding the thesis in the four areas of Ubiquitous Computing, Augmented Reality, Computer Vision and Tangible User Interfaces. Here we aim to place our work relative to other research and explain some of the reasoning behind our approach.
Chapter 3 presents the Cooperative Augmentation conceptual framework in more detail, specifically the Object Model, the projector-camera system model and the cooperation process to achieve interactive displays on smart object surfaces.
Chapter 4 investigates four natural appearance computer vision object detection approaches and presents an experimental study exploring the issues of scale and rotation to enable detection of objects at any distance from the camera and in any pose. We also create an object appearance library for use in our studies.
Chapter 5 presents an experimental study exploring cooperative detection between the vision detection system and smart object, specifically analyzing the increase in detection performance achieved with basic movement sensing in the target object. We also create a video test library for use in our studies.
Chapter 6 presents the architectural design and implementation of the conceptual framework developed in Chapter 3, and evaluates the implementation as a whole.
Chapter 7 presents three demonstration applications created using the architecture. These applications are developed to demonstrate three different areas of the architecture, specifically scenarios presenting the whole system from an object entry to exit; interaction methods and a scenario with multiple-projectors and multiple-objects.
Finally, Chapter 8 presents a summary of the thesis, the limitations of our approach and implementation, our conclusions and our future work plans.
Appendix A additionally describes the design and assembly of two steerable projector-camera systems, constructed for our experimental studies and demonstration applications. We identify characteristics of typical systems and present recommendations for building similar equipment. We characterise our system and compare the performance with other related research projects.
2.1 INTRODUCTION
Chapter 2
Related Work
This chapter does not provide an exhaustive list of related research projects; instead it aims to cover the most relevant related work for understanding the thesis and to outline this thesis’ contribution in terms of other projects and similar research.
2.1 Introduction
As shown in Figure 2.1, this work draws on four areas of computing: Ubiquitous Computing, Augmented Reality, Computer Vision and Tangible User Interfaces (TUI). The main area is Ubiquitous Computing, as seen on the far left in Figure 2.2, which was defined by Mark Weiser as the third wave of computing after monolithic and personal computing. This third wave involves the technology receding into the background and many computing devices being unobtrusively embedded in the environment to enrich our lives [Weiser 1996].
[image:22.595.205.377.430.578.2]Figure 2.1 This work draws from 4 main areas of computing: Ubiquitous Computing, Augmented Reality, Computer Vision and Tangible User Interfaces (TUI)
2.1 INTRODUCTION
The second area is augmented reality, which is a type of the Mixed-Reality (MR) visual display. Milgram and Kishino describe MR as a general set of technologies which involve the merging of real and virtual worlds [Milgram and Kishino 1994]. These technologies can be decomposed with respect to the amount of reality present in the interface to create the “virtuality” continuum, as shown in Figure 2.3. The continuum ranges from a zero virtuality interface in the real world (such as a pen and paper interface) to fully virtual environments where a user is immersed in surrounding virtual world (such as CAVEs).
In contrast, Augmented Reality (AR) refers to cases where either a display of the real environment, or objects in the real world themselves are augmented by means of virtual objects, using computer graphics [Milgram and Kishino 1994]. This allows a shift in focus for human-computer interaction from a static interaction with a user sat at a desktop display, to one where the surrounding environment and physical objects in this environment become the interface. Typical applications for AR include navigation, visualisation and annotation for medical, assembly, maintenance and repair tasks, entertainment, education, mediated reality, collaboration of distributed users and simulation. In this thesis we concentrate on projector-based AR, however, a good general introduction to all aspects of AR can be found in [Azuma 1997; Azuma, Baillot et al. 2001].
Figure 2.3 The Milgram and Kishino “Virtuality” Continuum of Reality to Virtual Reality [Milgram and Kishino 1994], taken from [Newman, Bornik et al. 2007]
To achieve an AR display so it appears correct for a user requires that the registration between the real and virtual world is exact. Consequently, for mobile users or dynamic environments the relative positions of the real and virtual must be continuously determined. This can be accomplished either by detecting and tracking objects, users, or both, depending on the scenario. Different approaches to tracking are possible, including using dedicated hardware such as mechanical, electro-magnetic and optical tracking systems [Rolland, Baillot et al. 2001]. In contrast, vision-based tracking using cameras allows a relatively low-cost and non-invasive approach, either using fiducial markers or markerless computer vision techniques [Lepetit and Fua 2005].
2.2 UBIQUITOUS COMPUTING
Figure 2.4 The Milgram-Weiser Continuum [Newman, Bornik et al. 2007]
Although Weiser believed ubiquitous computing to be the opposite of Virtual Reality (VR), Newman et al. point out that VR is merely at one extreme of the Milgram continuum, and propose merging the two continuums to create the Milgram-Weiser Continuum (as shown in Figure 2.4).
In this thesis we use projection to augment objects with interactive interfaces. The objects themselves are smart and cooperate with projector-camera systems to help with their detection and projection task. This places the work firmly in the Ubiquitous AR category of the Milgram-Weiser Continuum.
To achieve the augmentation of the smart objects we use markerless computer vision techniques to detect and track the objects in the environment. Through our cooperative augmentation framework the objects themselves can become Tangible User-Interfaces (TUI), where location, orientation, object geometry, projected interfaces and sensors become methods for interacting directly with the projected displays, and hence, otherwise hidden knowledge in the object and environment.
The following sections of this chapter investigate these areas in more detail.
2.2 Ubiquitous
Computing
This section describes the closely related fields of ubiquitous computing (responsible for the drive to make everyday objects smarter) and tangible user interfaces. In recent years the ubiquitous computing field has become broader; however, in this thesis we concentrate on augmenting physical-tangible smart objects with projected displays. Here we examine what smart objects are, investigate some typical uses and concentrate on understanding how the potential for output capability can benefit objects and users.
2.2 UBIQUITOUS COMPUTING
could be attached to objects to augment them with a "digital self" [Holmquist, Gellersen et al. 2004]. So called “smart objects” would have the ability to perceive their environment through sensors and provide resources to nearby users and objects via peer-to-peer communication and customisable behaviour. However, the computing itself is secondary to the object, with the computer placed in the background of a users’ interaction with the physical and social environment [Beigl and Gellersen 2003].
Mark Weiser proposed that “the real power of the concept comes not from any one of these devices: it emerges from the interaction of all of them. The hundreds of processors and displays are not a ‘user interface’ like a mouse and windows, just a pleasant and effective ‘place’ to get things done” [Weiser 1991], hence, collections of smart objects become a collaborative interactive experience. Sensors providing objects with awareness of physical context and communication allows objects to promote a digital presence and to become part of networked applications.
2.2.1 Sensor Nodes
There are many experimental sensor node platforms in use for augmenting everyday objects with sensing and computation, however here we concentrate on two typical devices – Smart-Its and Motes.
The Smart-Its platform for embedded computing has developed over the years, with early DIY versions [Strohbach 2004] and more-recent versions such as the Particle computer [Decker, Krohn et al. 2005]. A basic objective of Smart-its platform is to be generic, to enable operation in mobile settings and have ad-hoc peer-to-peer interoperation, while allowing customisation of sensors, perception and context-awareness methods. This is achieved using a flexible system with hardware consisting of main-boards with a PIC18F6720 microcontroller for processing, a TR1001 transceiver for communication on 868MHz and extendable pluggable sensor boards, as shown in Figure 2.5. Powered is provided by a 1.2V AAA rechargeable battery.
Figure 2.5 (left) Smart-Its design (centre) Particle Smart-Its Device main board, (right) Add-on sensor boards [Decker, Krohn et al. 2005]
2.2 UBIQUITOUS COMPUTING
Figure 2.6 (left) Crossbow Technology Motes (right) Motive Corporation (now Sentilla Corporation) Telos Mote [Inc 2007]
Motes were initially developed in a collaboration between the University of California, Berkley and Intel Research [Nachman, Kling et al. 2005]. Motes are small, self-contained battery-powered devices with embedded processing and communication, enabling them to exchange data with one another and self-organize into ad hoc networks. Hence, similar to Smart-Its, the Motes form the building blocks of wireless sensor networks. The Motes typically run a free, open source component-based operating system called TinyOS. Motes are manufactured by Crossbow Technology, Berkley and Sentilla Corporation. The Motes family have a large number of designs, with an equally large number of pluggable daughter-boards. They support many of the same sensors as Smart-Its devices such as the integrated temperature, light and humidity sensors shown in Figure 2.6 (right). More information can be found on the related company and university websites.
2.2.2 Smart Objects
The Mediacup was one of the first projects to demonstrate sensing and computation embedded unobtrusively in an everyday object, as shown in Figure 2.7 (left). Here a coffee-cup was made smart by means of an attachable rubber foot containing computing to sense context with movement and temperature sensors, for example, sensing if the user drinks, or plays with the cup [Gellersen, Beigl et al. 1999]. It had the ability to communicate with other devices, such as smart watches and smart door plates to share its context. In this case, if a smart door-plate detected several Mediacups inside the room it displayed a “Meeting” sign, warning others.
2.2 UBIQUITOUS COMPUTING
Figure 2.7 (left) Mediacup Object [Gellersen, Beigl et al. 1999], (centre) Cooperative Chemical Containers, (right) Hazard warning display using 3 LEDs [Strohbach, Gellersen et al. 2004]
Strohbach et al. present a scenario for embedded computing in industrial environments [Strohbach, Gellersen et al. 2004]. In this scenario large industrial storage facilities potentially contain thousands of chemical containers with different contents. Health and Safety rules apply to where and for how long these containers can be stored. Instead of augmenting the environment to track all the objects, Strohbach et al. propose embedding the rules directly into the containers and using embedded sensing to detect their state and their location relative to nearby containers. The containers can now cooperate, sharing their context to determine whether they comply with the rules, and detect hazard conditions, such as potentially reactive chemicals stored together, critical mass of containers stored together and when containers are stored outside of approved areas [Strohbach, Gellersen et al. 2004]. Such potentially risky situations require action from the facility employees to avert any danger, but the employees are faced with potential problems – such as how to find one container that has been placed in the wrong place out of thousands, and where to return this particular container to. Strohbach et al. provided visual feedback to employees as three LEDs on the top of the container barrel – green for no hazard, yellow for a warning (e.g. container stored outside the approved area) and red for critical hazards (e.g. reactive chemicals in proximity), as shown in Figure 2.7 (right).
Figure 2.8 (left) Proactive Furniture Assembly [Antifakos, Michahelles et al. 2004], (centre) Display Cube Object [Terrenghi, Kranz et al. 2006], (right) Tuister Object [Butz, Groß et al. 2004]
2.2 UBIQUITOUS COMPUTING
embedded system, both as the task itself can be accomplished in different ways, and as it must cater for different user experience. For example, beginners may need a full walk-through, while experts may only need to be rescued if they assemble a piece incorrectly.
The system augments both tools and different pieces of the furniture with different sensors, for example, a screwdriver with a gyroscope to sense rotation, a horizontal board with an accelerometer for orientation sensing, and a side board equipped with a force sensing resistor (FSR) to measure when the two boards are joined. Hence, the system monitors its state and suggests the next most appropriate action using strips of LEDs for visual feedback, as shown in Figure 2.8 (left).
This feedback was a green pattern on both edges of the boards when correctly assembled, a red pattern when a mistake is made, or a flashing green when there are multiple alternatives. After alignment, individual green LED direct the user to tighten screws with the screwdriver. From their user study it was determined that augmented furniture with even simple LED notification allowed both a measureable decrease in assembly time and reduction in assembly errors [Antifakos, Michahelles et al. 2004].
2.2.3 Tangible User Interfaces
While differing from ubiquitous computing, Tangible User Interfaces (TUI) research holds a common concern for physically contextualised interaction. In contrast to ubiquitous computing, TUI research is rarely interested in augmenting everyday objects, but instead producing new artificial objects that fuse together input and output within a single device. TUI propose using these devices to provide an explicit mapping between the physical and virtual worlds, enabling tactile sense exploration and spatial reasoning which exploits the human senses of touch and kinaesthesia, and allows familiar physical actions to be used as input [Ishii and Ullmer 1997].
Central to TUI is the concept of embodying information in tangible objects, where objects serve as tokens or containers for digital information (as demonstrated by Underkoffler et al. in the Luminous Room project, described in section 2.3). Similarly, physical objects can serve as input primitives or tools to manipulate digital information, creating the possibility of representing abstract entities and concepts with physical ones, potentially enabling more efficient cognition of the relationships involved [Valli 2005].
Physical objects can also be used to gather and infer information about the context of the user and their intentions – for example, if a user picks up a tennis racket, they may also be interested in the location of their tennis balls. Lamming and Bohm propose such a system using embedded computing to detect relative proximity between objects and warn a user if they forget items from their bag [Lamming and Bohm 2003]. Such context information can be useful even when not being grasped by a user, for example, as objects may be placed in a particular spatial arrangement for an activity. Here, adding more objects allows more degrees of freedom, and hence gives the user more control over the representation of complex spatial relationships.
2.2 UBIQUITOUS COMPUTING
Villar et al. 2003; Block, Schmidt et al. 2004]. 3D accelerometers detected orientation and allows detection gestures such as shaking or placing the object down on a surface to control a home entertainment centre, as shown in Figure 2.9.
Figure 2.9 Using a sensor enabled Cubicle for interaction [Block, Schmidt et al. 2004]
The Display cube, shown in Figure 2.8 (centre), was designed by Terrenghi et al. as a child’s learning appliance that exploited the familiar physical affordances of a cube, while augmenting it with embedded sensing, computing and displays [Terrenghi, Kranz et al. 2006]. The internal cube hardware uses a Smart-Its platform, 3D accelerometers to sense orientation, an LCD display on each face and a speaker for audio feedback.
The user interface was designed for games and quizzes, for example, a matching task where a letter was shown on the top face and children had to select the matching character from the other faces. Applications had to be specially designed to cope with the low resolution display and the lack of electronic compass sensors, which prevented sensing of the rotation around the gravity vector. However, in the study Terrenghi et al. found that users could still easily read letters and numbers in any orientation, suggesting that lack of orientation sensing is not a major issue for very simple text and graphics.
The user study also illustrated additional benefits of a tangible cube, with children quickly engaging with the games due to the shaking and turning, and cooperative play with children demonstrating to each other the solutions to the tasks.
Figure 2.10 (left) Prototype mock-up display cube using static front-projection, (centre) The current LED-matrix display Z-agon interactive cube, (right) The envisioned fully interactive cube with colour displays [Matsumoto, Horiguchi et al. 2006]
2.3 PROJECTOR-BASED AUGMENTED REALITY
accelerometers; however, they envision a fully interactive high-resolution video-player and communication device with colour displays, as shown in Figure 2.10 (right).
The Tuister was designed as one-dimensional input and output device based on discussions with cognitive psychologists which indicated that cubes may have too many degrees of freedom for users to locate and remember a display position (Sheridan et al. identified 17 non-verbal input affordances [Sheridan, Short et al. 2003]). Instead, the psychologists believe people were likely to loose track of their movements in a complex series of motions [Butz, Groß et al. 2004]. Consequently, Butz et al. designed the Tuister for browsing hierarchical nested menu structures with hardware consisting of two parts – a handle and display part which rotates to scroll through the menus, as shown in Figure 2.8 (right). Embedded in the display part are 6 organic LED displays each with 64x16 pixel resolution to display small symbols or short text. Sensors in a Smart-Its device detect the rotation of the display part with respect to the handle. Butz et al. envision Tuister as a personal multi purpose device, carried to interact directly with pervasive environments and serving as a universal remote control.
2.2.4 Input-Output Imbalance
The increasing amount of technology embedded into the environment enables new interaction metaphors beyond the traditional GUI paradigm. In the ubiquitous computing field there has been much research on input to smart objects, for example, on embedding sensing, location systems and methods for accumulating and distributing knowledge. However, there is little research on output methods to allow the user to visualise this knowledge and interact with it. Similarly, tangible user interfaces work allow physical manipulation and spatial arrangement of objects, but visual feedback to the user is mostly still provided by displays in the environment instead of the device itself [Butz, Groß et al. 2004]. This leads to an indirection in the interaction and an input-output imbalance.
As we have seen from sections 2.2.2 and 2.2.3, there is a real potential for objects and users to benefit from the delivery of complex and variable visual information on the object itself. This potential can be seen in diverse situations such as hazard monitoring in safety-critical workplaces, for assembly instruction, or for visual feedback to object manipulation in tangible user interfaces. The objects we examined attempted to redress the input-output imbalance either by using other displays in the environment or embedding displays in the physical objects themselves. These embedded displays took different forms, such as simple LEDs (e.g. the Chemical Containers and Smart Furniture) or multiple graphical displays (e.g. the Display cube, Z-agon and Tuister).
However, the display technology currently used has many limitations. For example, LED displays can only convey a small amount of information to users (such as flashing to indicate an error condition), while graphical displays are expensive, have high power requirements (so are difficult to integrate in low-power mobile objects) and change the appearance and function of an object. Hence, this motivates our approach in this thesis using non-invasive projected displays.
2.3
Projector-based Augmented Reality
2.3 PROJECTOR-BASED AUGMENTED REALITY
understand how we can create interactive, undistorted and visible projected displays on objects of varying shapes and appearances.
Projector-based Augmented Reality uses front-projection to project images directly onto physical object’s surfaces, not just in a user’s visual field. [Raskar, Welch et al. 1999]. Unlike physical displays such as computer monitors, projection-based displays allow integration with the existing appearance of an object to create seamless displays [Pinhanez and Podlaseck 2005]. The displays they create are non-invasive, as they do not require any hardware in the object being augmented. This feature allows projected displays to be used almost anywhere, in situations where physical displays would not be used, for example, due to cost, vandalism concern or hazardous environments. Projection can be used to change or supplement the functionality of the object - most commonly by transforming a non-augmented object “into an access point to the virtual information space” [Pinhanez 2001].
Projectors are able to create images much larger than the display device itself, allowing even small portable projectors to augment large objects. The traditional AR display technologies (Head Mounted Displays (HMD), PDA, tablets or mobile phones) are inherently encumbering and limited to a single user. In contrast, projected displays have scalable resolution, improved ergonomics, easier eye accommodation (as the graphics appear at the same distance in the real world as the objects) and a wide field of view, so are visible to multiple people. These properties enable a greater sense of immersion and have the potential to increase the effectiveness of multi-user interaction or co-located group-working in an object’s physical space [Bimber and Raskar 2005].
Some of the earliest work in Projector-based Augmented Reality was Underkoffler, Ullmer and Ishii’s Luminous Room project [Underkoffler, Ullmer et al. 1999]. This project developed a concept for providing graphical display and interaction on each surface of an environment. Co-located two-way optical transducers –called I/O bulbs– that consist of projector and camera pairs capture the user interactions and display the corresponding output. The Luminous Room also demonstrated the possibility of embodying information in tangible objects. Here, objects could “save” associated digital information, such as the chess board state, allowing the user to remove the object from the projected surface. The projected interface would then re-appear in the saved state whenever the object was placed back on the surface.
Figure 2.11 (left) A chessboard with memory (centre) Interactive optics-design, (right) A prototype I/O bulb projector-camera system in the Luminous Room [Underkoffler, Ullmer et al. 1999]
2.3 PROJECTOR-BASED AUGMENTED REALITY
animation was applied to the projections to make people aware of the virtual nature of the projections.
This reduced ability to distinguish between real and virtual was used deliberately in the Spatially Augmented Reality project [Raskar, Welch et al. 1999], which captured a physical object’s inherent colour, texture and material properties (such as reflectance) with a camera, replaced them with a white object and projected imagery exactly reproducing the original appearance of the object. Raskar et al. showed that visually there was no difference between the original object illuminated with white light and the white object illuminated with the original appearance, indicating the ability to separate an object’s appearance from its form. Using this separation Raskar et al. demonstrate alternate appearances, lighting effects and animation by simply changing the projection. This was also one of the first projects to demonstrate that projection is not restricted to a planar surface or a single projector, by augmenting complex 3D objects such as a model representation of the Taj Mahal mausoleum in India with multiple static projectors.
Figure 2.12 Spatially Augmented Reality (SAR) [Raskar, Welch et al. 1999]
As demonstrated by the I/O bulb and Spatially Augmented Reality project, the addition of a camera to the projector creates a feedback-loop and allows the display to become interactive. Projector-camera systems enable un-encumbered and un-tethered interactive displays on any surface, at any orientation. No special hardware is required in the display surface itself to support this interaction.
2.3.1 Projector-Camera Systems
The projection-based AR technology discussed in section 2.2 form part of a larger family of projector-camera systems. Here we decompose the family into three categories with respect to display mobility:
1. Static projector-camera systems (such as multi-projector display walls) 2. Mobile, handheld and wearable projector-camera systems
3. Steerable projection from a static system with pan and tilt hardware
These categories can be seen more clearly in Figure 2.13, when compared to a traditional desktop monitor which is a static, single user technology with a small display size.
2.3 PROJECTOR-BASED AUGMENTED REALITY
[image:33.595.219.419.117.315.2]2.15) projector-camera systems can only opportunistically detect and project on objects passing through the field of view of the projector and camera.
Figure 2.13 The Projector-Camera system family decomposed by mobility and display size, compared to traditional desktop monitors
In contrast, projector-camera systems in the third category, with computer controlled steerable mirrors or pan and tilt platforms [Pinhanez 2001; Borkowski, Riff et al. 2003; Butz, Schneider et al. 2004; Ehnes, Hirota et al. 2004] allow a much larger system field of view and the ability to track objects moving in the environment. We use the generic term “Steerable Projectors” for these systems.
2.3.2
Mobile, Handheld and Wearable Projector-Camera
Systems
Raskar et al. initially developed the concept of handheld projector-camera systems in the “intelligent Locale-Aware Mobile Projector” (iLamps) project [Raskar, VanBaar et
al. 2005]. As seen in Figure 2.14, the handheld projector-camera system included on-board computing, a tilt-sensor and network access. The projector-camera system was initially calibrated to determine the intrinsic (optical) parameters and extrinsic pose (relative locations and orientations) of projector and camera. Projection-based object adaptive displays were then demonstrated using circular fiducial markers to allow the system to calculate the camera pose (hence the projector pose). With projector pose known relative to an object (in this case the black rectangle with a fiducial marker in Figure 2.14), a projection can be registered with the object so it is overlaid on its surfaces.
2.3 PROJECTOR-BASED AUGMENTED REALITY
Figure 2.14 (left and centre) The iLamps Project developed a handheld projector-camera system, (right) Detecting circular fiducial markers to augment a wall scene with projection
Handheld projectors are now widely researched due to recent technology developments in micro displays and cheap, long-life LED and LASER light sources. These developments have caused a drastic reduction in the size of projectors, which will soon enable projectors to be carried in a pocket or embedded in mobile devices. Some recent research concentrates on calibration of handheld projectors [Dao, Hosoi et al. 2007], while other projects make use of the ability of projectors to create displays larger than the device itself, focussing on collaborative interaction techniques using multiple handheld projectors [Cao and Balakrishnan 2006; Cao, Forlines et al. 2007].
Figure 2.15 SONY’s Handheld spotlight projector [Rapp, Michelitsch et al. 2004], (centre left) Multi-user interaction using handheld projectors [Cao, Forlines et al. 2007], (right) Wearable Projector-camera system [Karitsuka and Sato 2003]
2.3.3 Multi-Projector Display Systems
Traditionally, multi-projector displays were created by time-consuming mechanical alignment of the individual projectors to abut the images. Periodic re-calibration was often necessary, due to factors such as vibration which caused increasing alignment inaccuracies over time.
As part of the iLamps project [Raskar, VanBaar et al. 2005], Raskar et al. demonstrate the first ad-hoc clustering of overlapping projectors, using camera-based registration and image blending to create a single geometrically seamless display (see Figure 2.16, right). The project also developed shape adaptive displays, where the display was geometrically corrected to appear undistorted on multi-planar and curved quadric surfaces using the least-squares conformal mapping approach proposed by Levy et al. [Levy, Petitjean et al. 2002].
![Figure 2.2 The "Weiser Continuum" of ubiquitous computing [Weiser 1996] to monolithic computing, taken from](https://thumb-us.123doks.com/thumbv2/123dok_us/7976781.755640/22.595.205.377.430.578/figure-weiser-continuum-ubiquitous-computing-weiser-monolithic-computing.webp)
![Figure 2.4 The Milgram-Weiser Continuum [Newman, Bornik et al. 2007]](https://thumb-us.123doks.com/thumbv2/123dok_us/7976781.755640/24.595.175.404.87.318/figure-milgram-weiser-continuum-newman-bornik-et-al.webp)