875
CLUSTERING FAILED COURSES OF ENGINEERING
STUDENTS USING ASSOCIATION RULE MINING
ROSEMARIE M. BAUTISTA
Associate Professor, Bulacan State University, College of Information and Communications Technology, Philippines
Email: [email protected]
ABSTRACT
In today’s world, the fast-paced changes in technology and upswing volume of organizational data in almost all domains including academe are very remarkable. This coupled with the aspiration to gain competitive advantage necessitate the utilization of data mining. This paper applies the processes in the Knowledge Discovery in Databases by Fayyad and presents in methodological way the steps performed towards finding the associations between courses failed by engineering students. It started with the preparation of data moving towards proper transformation of it for data mining and concluding with data interpretation and evaluation. Using association rule mining through Apriori algorithm, the rules were extracted from the database. The statistical significance and the strength of the rule were analyzed using 3 measures of usefulness: lift, support and confidence. All the rules generated have positive co-relation, that is, the relationships of the consequent of the rule with the antecedent are not due to chance. The over-all output of the study is expected to offer viable results that may be used by administrator, academic advisor and curriculum planners in devising worth-while strategies such as improvement of teaching methodology, re-structure of curriculum, modification of course pre-requisites or development of supplemental activities to students.
Keywords: Data Mining, Association Rule Mining, Market Basket Analysis, Knowledge Discovery in
Databases, Educational Data Mining
1. INTRODUCTION
The hasty growth of technology and the surge of enormous data are increasingly evident in the past few decades. The widespread computerization and explosive growth of data in almost every conceivable field including government, businesses, recreations, education and others necessitate the need to analyze, manage and transform such data into usable information. Data mining, thus, becomes an imperative approach in these integral tasks [1].
Data mining or DM which is usually referred to as the process of discovering invaluable knowledge from databases [2], [3] is part of the natural evolution of information technology [1]. It oftentimes uncovers hidden patterns which are not usually generated by traditional computer-based information system. It is termed as educational data mining or EDM in the context of education. EDM is now gaining popularity and capturing the
interest of countless researchers who wish to extract previously unknown patterns and unique information from educational databases [4], [5]. It is used to analyze students’ historical attributes to gain understanding of some academic records, enrolment data, student behavior and pedagogical performance that may improve decision-making and better management of scholastic-related issues [6], [7], [8]. Techniques such as association rule, k means and some classification algorithms were used to analyze both students’ behavior and teachers’ performance to provide recommendation for further curriculum improvement [9].
876 failure and dropping rate. In this study, for instance, almost 50% of the total students’ analyzed were failed or dropped in at least one course. This means additional semesters or years of stay in the part of students and additional expenses in the part of the government since state universities like BulSU are subsidized by national budget. The aforementioned situations inspired the researcher to start an endeavor to analyze failed engineering courses and quest for applicable measure that may be used to determine possible patterns contributors to students’ academic performance. The ultimate problem of this research was how to be able to extract the associations among courses failed by students. It also dealt with how the obtained data from the University databank is converted into form suitable for data mining. The outcome of this study aims to provide awareness to the administration, academic advisor and curriculum planners regarding patterns of courses failed by students. The generated association rules may be used to support curriculum re-structuring, course pre-requisite modification, students’ learning enhancement, and faculty teaching strategy improvement which may eventually lessen the percentage of failing and/or dropping of courses.
This study conducted data mining of students’ records stored in the University Management Information System (MIS) data bank. However, data mining algorithms do not naturally support relational databases specially normalized relations which store the data that we usually used [10]. Data should be converted first into transactional or market basket data format before data mining algorithms can be utilized [10], [11]. This study describes in methodological way the steps performed in converting normalized relations into specific format suitable to allow formation of students’ basket of failed grades using SQL statements implementing views with joins, aggregate function and sub-queries. The resultant view was used as dataset fed into WEKA that performs the data mining process.
The remaining part of the paper is organized as follows. Section 2 presents some related work. Section 3 discusses the methodology used in the study. Section 4 presents the results and discussions. Finally, the paper closes with a brief conclusion in Section 5.
2. RELATED WORK
Data mining is inevitably playing an important role in the growth and survival of many business entities and academic institutions because the intelligence it generates is now becoming an effective tool for analysis and a valuable support for decision-making [12]. One typical and popular example of this is the market basket analysis which is also known as association rule mining. In this, DM was used in analysis of stores’ transactional databases to mine customers’ purchasing patterns through extraction of co-occurrences of products in each customer’s transactions. The result was then used in deciding the best marketing strategies to employ such as promotional bundles of products and convenient store layout [13]. Another study was conducted in a multiple store environment where there is diversity in store sizes, product replacement ratio, and number of stores as well as periods was considered. The rules developed in this store-chain association method may be used in the entire chain without restriction or may be used only in specific store and period. Therefore, marketing strategies and product management may be developed for individual store or for the entire chain [14]. Another study considered customer heterogeneity where an approach was developed to combined multi-category choice models with data driven strategy to form a segment-specific market basket analysis. The study aimed to benefit both marketing analysts and retail marketing managers [15].
In similar perspective, the market basket analysis or the association rule mining which was extensively adopted in marketing arena is now progressively used in various practical applications such as in academe [16]. In the experiment conducted by Melgueira and Rato [17], the association rule mining was used to know the trends in college course completion among students in University of ´Evora. Pattern extractions which they called tasks were performed. However, for every student instance, only a single combination of completed course and grade in both antecedent and consequent of the association rule was extracted in task 1. Task 2 on the other hand, identified incompatible courses. Moreover, both tasks focused only in one of the two semesters of a single school year under study.
877 association rule mining is implemented was shown in the study. The result revealed the associations between students’ social activities, their concern fields and courses failed by students. This, according to authors, may be helpful in raising students’ success by guiding them in profession selection [18]. It effective illustrates how association rule was utilized to mine recurrent failures. It also mentioned that automation software was utilized to reveal the association rules, however, unable to show sample output generated by the software.
Aside from studies that focus on the algorithms, studies were also conducted that gives emphasis on the fact that data mining algorithms cannot directly be performed on relational databases but instead required tedious conversion process. In the study conducted by Alashqur, Badran, and Amman, an SQL statement was used to create a virtual table which is called view. This view was used to find the association rules that satisfy the defined minimum support and confidence. The authors limit the mining of association rules in the context of the relational model [11]. Having the same standpoint, an association rule mining was also once used to analyze admission system data which determines the relationship of some students’ attributes to their chances of being accepted in King Abdulaziz University [10]. The authors showed the coding scheme used, sample input and equivalent transactional database. However, actual conversion from relational database to equivalent transactional database using specific software was not shown.
Several studies concerning association rule mining have been conducted and various rule mining algorithms have been proposed by several researchers while others performed comparisons of existing algorithms. Majority of the discussions in the cited studies concentrated on how the algorithm actually works but failed to offer a clear grasp about how the actual data were extracted from their respective sources. A relational database which represents data in forms of tables is by far the most rampant in today’s databases [19] and thus, the most common source of data. Very few researchers showed interest in developing a process that will show how to handle the conversion of traditional relational database which is used in ordinary operational systems, such as systems used in universities, into transactional representation appropriate for association rule mining. Although in one of the studies mentioned above, SQL
statement was employed to create view that allows mining associations among relations, it focused only in mining the context of the relational database [11].
The very novel contribution of this study is the presentation of a detailed methodology showing how data stored in relational database converted into a form suitable for data mining. In this study, the researcher formulated an SQL statement combining the concepts of not only views and joins but also implementation of aggregate function and subqueries as column expression to form the market basket data representation which was fed in WEKA. The actual data mining process was also discussed. Thus, the study provides a clear picture of how mining of important associations in university database is done from data selection, transformation, datamining and interpretation of mined patterns.
3. METHODOLOGY
This research applies a steadfast model in mining significant patterns in databases which is Fayyad Knowledge Discovery in Databases (KDD). It is perceived as one of the most reliable research models used for academic purposes [20].
The Knowledge Discovery in Databases (KDD) as shown in figure 1 is popularly known in finding hidden patterns, unseen trends and correlations in databases in order to suggest appropriate future decisions. In this study, the processes in KDD was used as guiding paradigm to extract possible hidden associations among students’ grades that may contribute in building the university administrator better understanding and visualization of such concealed knowledge. KDD process involves discovering interesting patterns and knowledge from databases through application of data mining techniques and algorithms [20]. It consists of well-established processes: data selection, data cleaning and transformation, data mining, data interpretation and evaluation.
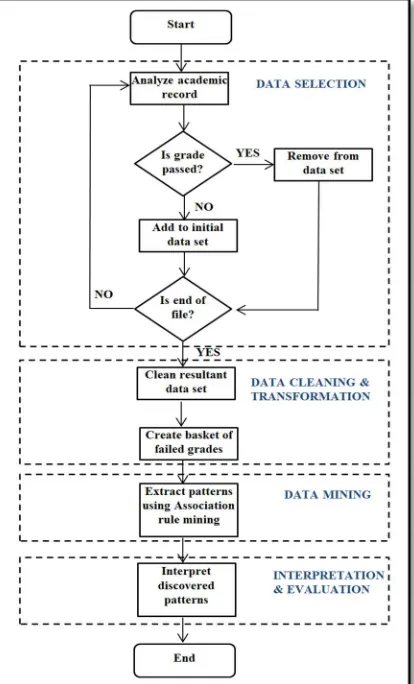
878 In this study, the researcher developed a specific approach which sets the direction of this undertaking. It was crafted after the Fayyad KDD model and shows the details of every activity performed by the researcher as shown in Figure 2.
In the data selection process, the researcher requested a copy of the academic profile of engineering students from the University Management Information System (MIS) department for first semester of school year 2012-2013 to second semester of school year 2015-2016. Using SQL statements, the researcher performed filtering to remove all grades successfully passed by the students. Only courses failed by students were left for analysis.
The consistency in attribute format was scrutinized in the cleaning and transformation process. The entity integrity and domain constraints were also enforced. A base relational table was created to hold only 2 relevant attributes:
student identification and name of courses failed. A view was also created to hold the baskets of grades associated to each instance of student.
The third undertaking is the data mining process where the obtained data set was evaluated using association rule analysis. The data mining tool WEKA was utilized in order to come up with patterns and identify interesting association rules. The support, confidence and lift were used to evaluate the resultant rules.
The researcher performed, in the last phase, the interpretation of the discovered patterns, consolidation and visualization of the extracted knowledge.
The ultimate goal of the study was how to be able to extract the associations among courses failed by students. The approach presented provides vividly the map about what particular activities are to be performed in each step that corresponds to Fayyad KDD model. It shows the detail of every process done from obtaining relational data from University MIS to conversion of it to market basket data format until the process of pattern extraction was done.
4. RESULTS AND DISCUSSION
This section provides a clear picture showing the sequence of events performed to achieve the objective of the study and extract the association patterns from databases. The latter part of this section presents the interpretation and evaluation of mined patterns discovered in the database.
4.1.Selection
Academic data of engineering students were requested from the MIS department of the University. The file was provided in excel format and was converted to csv file. It consists of student basic information, course code, course name, grade, academic year, and semester when a particular course was taken by the student. A database management system Oracle Database 11g was used to create the needed table and be able to import the file for analysis and transformation.
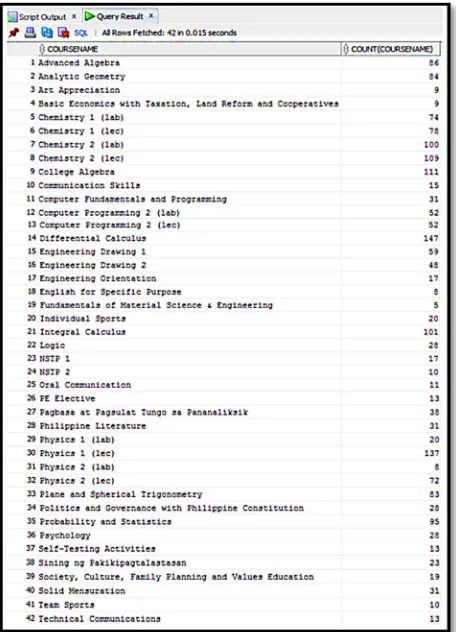
[image:4.612.90.297.169.511.2]The academic grades in the forty-two (42) first and second year courses of the one thousand twenty two (1,022) engineering students taken from first semester of school year 2012-2013 to second semester of school year 2015-2016 was analyzed. From a pool of grades consisting of more than forty
879 thousand instances, the researcher performed filtering and considered only those grades that are either dropped or failed by students. Figure 3 shows the frequency distribution of students per failed courses.
The academic records of students with passing grades were removed from the database using the SQL delete statement leaving only for analysis those grades that were considered failed. Out of 1,022 students, the records reveal that there are 504 students who failed in at least one course. It only leaves a total of 2,086 instances to evaluate. Figure 3 shows in the first column the list of engineering courses while the second column shows the number of students who failed in specific course. In other words, the value in second column represents the number of occurrence or the frequency of the course in the entire transactions
4.2 Data Cleaning and Transformation
Market basket data can be presented in either transactional data format or tabular data format [21]. However, data stored in systems we frequently used are in the format that allows basic database operations such as add, delete, edit and
search which are needed by users in performing their tasks and not in the format suitable for data mining. The first step, therefore, performed by the researcher is data cleaning and transformation. It is about removing insignificant attributes leaving only those which are relevant to the set purpose of the study. In this case, the relation ENGR_GRADE was initially created and is shown in Table 1.
The table consists only of 2 essential columns: the student number and the name courses failed by the students which were treated collectively as primary key. This technique ignored the consecutive failure of student in same course or the number of times a student failed in a particular course, the unit assigned to the course and other insignificant columns. Instead, it finds the set of subjects failed together by students. The table in this stage returns only 1,945 records. However, for the purpose of simple presentation, the researcher only showed sample few records. Similarly, the complete student numbers were not also presented but instead displayed only the last 3 digits for confidentiality of student identity.
[image:5.612.74.302.154.470.2]Association rules can be calculated from a dataset structured into baskets. Therefore, the next process performed was to organize table instances in such a way that a particular row of the resultant table will only represent the course or list of courses failed by individual student. This, in relation to the market basket analysis concept, epitomizes a basket of distinct student failed courses. A virtual table, a view named STUD_GRADE_VIEW, was created for this purpose. Parcel of the code showing how baskets of failed courses were constructed is shown in
Table 1: Sample Values in the Initial Format of the Data Set
[image:5.612.315.515.218.401.2]880 Figure 4. SQL aggregating functions, subqueries and joins were rolled together to produce the required data.
The study executed self-join, therefore, the Oracle server scanned the same table twice to retrieve the needed information. Since unary relationship was implemented, table aliases S and G were used to refer to the same table and a join condition that links the recursive key with the primary key was also specified. The subqueries were also used in the select clause to retrieve the courses that satisfied the conditions specified in the inner query. A total of 42 sub-queries were utilized, however, for simplicity of presentation only the sub-queries used for the first 2 courses and the last course (in the order as shown in Figure 1) were shown. The value after the AS operator is the column alias which is the displayed column names. The last clause, the group by clause was used to ensure that what lies in the same row is cluster of courses failed per student.
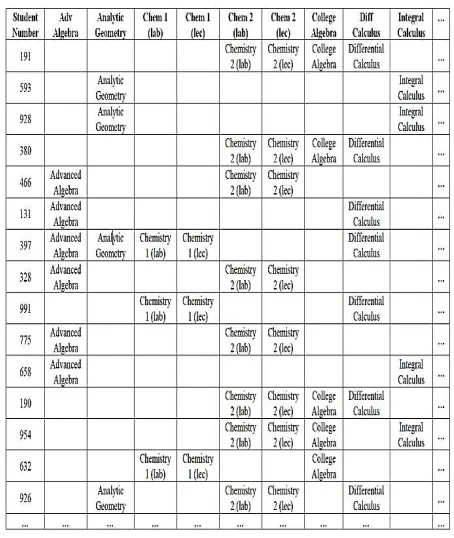
In the data format as shown in Table 2, the researcher displays the portion of the generated output after the execution of the SQL codes shown in Figure 4. The table shows that first basket consists of courses that include Chemistry 2 (lab), Chemistry 2 (lec), College Algebra and Differential Calculus.
The resultant table consists of a total of 504 records of distinct students with 43 columns representing the student number on the first column and on the rest of the columns are the first and second year engineering courses. The name of the course itself was displayed as value in the table column failed by students whereas the column is left null if student successfully completed the course. Again, for easy demonstration, only selected columns and records were displayed.
Further exploration of the resultant view revealed interesting observation that needs special attention. There are 78 students who failed only in Chemistry 1 lecture and 74 failed in Chemistry 1 laboratory only. On the other hand, running another SQL code which implements logical “and” revealed that 73 of them failed in both lecture and laboratory. This indicates that the ratio between the students who failed in both courses against those who failed in lecture only is 73:78 or 93.59%. Similarly, the ratio between the students who failed in both courses against those who failed in laboratory only is 73:74 or 98.65%.
The same was also observed for chemistry 2 lecture and laboratory. A total of 100 students failed in both Chemistry 2 lecture and laboratory.
[image:6.612.313.540.117.386.2]Figure 4: SQL Code that Forms the Basket of Failed Grades
[image:6.612.81.301.134.399.2]881 All the 100 students who failed in laboratory also failed in lecture, thus, the ratio between those who failed in both against those who failed in laboratory alone is 100:100 or 100%. Conversely, the ratio between those who failed in both against those who failed in lecture alone is 100:109 or 91.74%.
It is also obvious that 100% of the 52 students who failed in Computer Programming 2 lecture also failed in the laboratory of the said course. Therefore, in the final cleansing of the data, lecture and laboratory in above mentioned courses were treated as one.
Last step in the preparation of the final dataset used for mining is changing the content or column values from course names to word “failed” for better and clearer presentation. The rest were left null. The final table then was exported as csv file.
4.3.Data Mining
Market Basket is a well-recognized tool used to expose obscured and usually unnoticed associations among different items or products. It is frequently used to examine items purchases by identifying items or group of items bought together by customers in a buying transaction made in a store in order to understand important associations between buying behaviors. It is also intended to determine and assess the extent to which the items co-occur. For analysis, a database consisting of a relational table was used to hold arbitrary number of valid transactions {T1, T2, T3, …. Tn } where T1
represents the first transaction and Tn represents the
last transaction in the table. Each transaction, representing a basket, may contain a subset of items {ia,ib,ic…. in } where ia is the first item and in is the
last item in an instance of a transaction. The market basket defines the N items purchased together frequently by customers such as { T1,
ia,ib,ic….}, {T2, ia,ib,ic….,} where each combination
of items { ia,ib,ic…..} relates to a single transaction
identification. In this technique, only attributes that are most significant: transaction identification and item identification were considered. Other less significant attributes such as price and quantity of item bought were disregarded [22].
Market basket analysis, also known as association rule mining, is considered a data mining technique under category of unsupervised learning which does not require response or target variable and may not also guarantee to produce meaningful patterns. In this technique, association rules are
established to predict the occurrence or value of item based on the occurrences or values of other items in the database [23], [24]. An association rule, for instance, may be expressed as X→Y where X and Y are itemsets. An itemset is simply a collection of one or more items. The itemset X is called antecedent while itemset Y is consequent of the rule [25]. In layman’s term this rule simply means that “if itemset X is found, most likely itemset Y will also be found”. The rule should also consider X ∩ Y = Φ which means that X and Y are non-empty set of items [25].
Three indexes are usually used to know the strength of the association rule: lift, support, and confidence. These are important for rule selection because they provide complementary and distinct information. The value of the parameter lift is usually determined and analyzed first because it provides the statistical significance or statistical dependence between antecedent and consequent of every rule and used to weigh whether the association cannot be described by chance alone [16], [25].
Lift is basically defined as the probability of co-occurrence of X and Y divided by the product of probability of X alone and probability of Y alone. It can also be described as the ratio of the support of both X and Y to the product of the support of X alone and support of Y alone. It is important in describing whether the association exist and how good the rule is doing because considers both the confidence of the rule and the entire data set. The association rule has little or almost no value if lift is equal to 1 because it implies that the antecedent and the consequent of the rule are independent of each other. A value for lift greater than 1 indicates a positive co-occurrence which means that the resulting rule is better at predicting the consequent. In contrast, a lift value which is lower than 1 indicates a relationship that is negative in nature. The rule is stronger if the value for the lift is higher [16], [26]. The formula for lift is defined as p(X ∩ Y) / (p(X) * p(Y)).
882 the rule appear given that the transactions also contain the itemset in the antecedent. Confidence is defined as p(X ∩ Y) / p (X) [14], [27], [28].
Among the diverse algorithms available to mine association rules, Apriori is the most famous and widely used [14], [29]. It has been developed to extract combinations of items that have support value higher than or equal to the set minimum support and use this to generate the association rules [30]. All rules have also value greater than the user-specified minimum confidence threshold.
This study used association rule mining to perform the task of extracting occurrences and co- occurrences of courses failed by engineering students in their first and second year in the university. The csv file extracted from the previous stage was loaded into the WEKA data mining tool. A single transaction represents a basket of failed courses where each basket was identified by a student number. Since student number was simply used create a representation of a single transaction and the study was only interested with the groupings of courses, it was then considered insignificant attribute and removed from the dataset. This became the dataset which was analyzed using the DM algorithm. The Association-Apriori algorithm was then selected to perform association task. The minimum support and confidence threshold as well as the number of rules needed were also configured. In this study, the minimum support threshold was set to 3.5% and the minimum confidence threshold to 80%. It was set also to display only the top 20 association rules.
4.4.Interpretation and Evaluation
This research examined the academic records of 1,022 engineering students in the 42 courses offered in their first and second year stay in the university. These are the courses common across all engineering fields offered in the university. Analysis revealed that 504 of the 1,022 students utilized in the study, which is statistically equivalent to 49.32% of the sample, failed in one or more courses. The item frequency plot showing the number of students failed in particular course is shown in Figure 5.
The graph shows that the top 5 courses with highest number of students failed are Differential Calculus, Physics 1 (lecture), College Algebra, Chemistry 2 and Integral Calculus respectively. The number of students who failed in all those 5 courses is more than 100. If the individual probability to entire dataset is to be computed, the probabilities of occurrence of those top 5 courses are: 29.17%, 27.18%, 22.03%, 21.63% and 20.04% respectively. All are relatively higher than one fifth of the entire training data set. On the other hand, the courses with least number of failure rates are: Art Appreciation, Basic Economics with Taxation, Land Reform and Cooperatives, English for Specific Purpose, Physics 2 (lab) and Fundamentals of Material Science and Engineering. Unlike in Chemistry courses where almost all students who failed in lecture also failed in laboratory, based on the statistics presented, this principle is apparently not applicable to Physics courses where distance between the ratio of failure rate in laboratory and lecture is high.
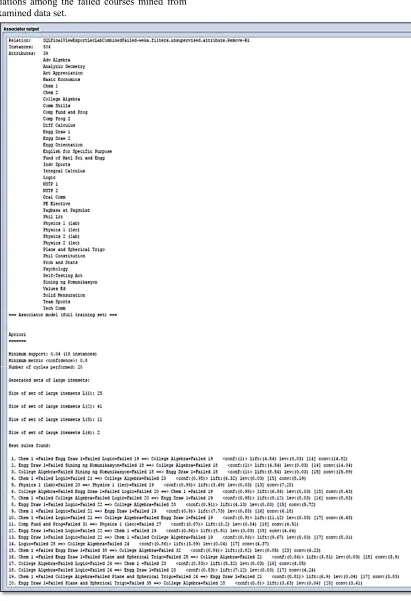
Aside from the frequency of the students failed vs a given course, this research was also interested in finding the patterns in the co-occurrences of failed courses. Through association rule mining, the possibility of the appearance of a course based on the appearance of other courses in student basket of failed grades was determined. Figure 6 shows the
883 associations among the failed courses mined from the examined data set.
884 Using association rule mining implementing Apriori algorithm, the associator output generated by WEKA displayed important facts about the dataset examined. The full training set contains 504 instances with 39 columns each. The number of cycle performed which is equal to 20 simply means that the algorithm stops at minimum support of 3.5% (rounded off in the output pane as 4% or 0.04) after running 20 times. The 18 instances displayed after the minimum support value is the support count or the frequency of occurrence of the set of items required to meet the user-specified minimum support threshold. L(1), L(2), L(3), and L(4) in the associator output are sets of large frequent itemsets. The output pane displays only the support count in both antecedent and consequent of the rule. Recall that support is the percentage of the entire baskets where courses in both antecedent and consequent appear together. Thus, to determine the support (X→Y), analyze the support count in antecedent and consequent to know the frequency where all courses in both sides co-exist. The value at the right hand side should be used and divided by the total basket which is 504. Using as example rule number 10, where support count in the antecedent is 21 and in the consequent is 19, support (X→Y) is 19 divided by 504 resulting to 0.038 or 3.8 %.
The output displays the top 20 best rules found and all those rules have lift values higher than 1.0. Therefore, this signifies that courses in the consequent of the rule are positively correlated with its antecedent and their relationships are not due to chance. The association rule with the highest lift is rule number 10 where courses in antecedent are {Chem 1, Logic} and in consequent are {College Algebra, Engg Draw 1} with support of 3.8% and confidence of 90%. This means that Chem 1, Logic, College Algebra, and Engg Draw 1 appear together or co-occur in 3.8% of the transactions or baskets in this training data set. The probability that College Algebra and Engg Draw 1 will be found given the presence of Chem 1 and Logic is 90% (the strength of the rule). This means that 90% who failed in Chem 1 and Logic also failed in College Algebra and Engg Draw 1.
Generally, the output shows that the lift value ranges from 11.12 to 3.2 which are much higher than 1. The percentage values for the support is from 6.3 to 3.6 percent of the total baskets while confidence or strength of the rule is as high as 100% to 80%.
Currently, many of the researches in association rule mining focused on algorithm comparison and improvement. Very few gave attention on the method of data transformation that prepares data for association rule mining. In one of the studies analyzed, the input database and its equivalent transactional database were shown [10] but failed to discuss the actual process done. In another, a view that joined tables was create to mine association rules that exist in different relations [11], however, failed to show the result obtained after execution of the view. This study provided a bridge between the gaps found in just cited studies. The researcher developed database code using SQL that effectively transformed the data extracted from university databank into a format fitted for data mining. The initial data, the SQL code developed, and the resultant output were all discussed to provide a better comprehension on how data were prepared before the actual data mining process. In this study, the data used were limited to first and second year engineering courses taken from school year 2012-2013 to school year 2015-2016. The dataset consists of courses failed by students. Dropped courses were also considered as failed while those which only require completion were treated as successful or passed. Similarly, lecture and laboratory of the same course were treated as one in cases where the ratio of failure between them was higher than 90%.
5. CONCLUSION
885 study presented trends showing strong positive relationship between the antecedent and consequent of the rule. These establish insightful and actionable knowledge for administrator, academic advisor and curriculum planners that might help them in devising strategies to suggest improvement in teaching methodology, re-structure of curriculum, modification of course pre-requisites or development of supplemental activities to students to improve learning especially on courses with high percentage of failure. The output of the association rule mining presented in this paper may positively be used to eventually lessen the percentage of failing and/or dropping of courses and improvement of students’ scholastic success. This study might be used as basis in other curriculum offerings in order to provide decision-makers better understanding of patterns in course failures for further curriculum improvement.
REFERENCES:
[1] J. Han, J. Pei, and M. Kamber, “Data mining: concepts and techniques”, Elsevier, 2011 [2] M.J. Zaki, W. Meira Jr, and W. Meira, “Data
mining and analysis: fundamental concepts and algorithms”, Cambridge University Press, 2014.
[3] B. K. Baradwaj and S. Pal, 2012, “Mining Educational Data to Analyze Students' Performance”, International Journal of
Advanced Computer Science and
Applications, Vol. 2, No. 6, 2011, pp. 63-69.
[4] D. M. M. Ali, “Role of Data Mining in Education Sector”, International Journal of Computer Science and Mobile Computing
(JCSMC), Vol. 2, No. 4, 2013, pp. 374-383.
[5] M. A. Anwar, N. Ahmed, and W. Khan, “Analysis of Students' Grades in Mathematics, English, and Programming Courses: A KDD Approach”, International
Journal of Future Computer and
Communication, Vol. 1, No. 2, 2012, pp. 111.
[6] A. A. R. Al-Azmi, “Data, Text and Web Mining for Business Intelligence: a Survey”,
International Journal of Data Mining &
Knowledge Management Process((IJDKP)),
2013, Vol. 3, No. 2, pp. 1-21.
[7] S. K. Yadav, and S. Pal, “Data Mining Application in Enrollment Management: A Case Study”, International Journal of
Computer Applications, Vol. 41, No. 5, 2012,
pp.1-6.
[8] M. Bienkowski, M. Feng, and B. Means, Enhancing Teaching and Learning Through Educational Data Mining and Learning Analytics: An Issue Brief. US Department of Education, Office of Educational Technology, 2012 Oct, 1, pp 1-57.
[9] P. M. Kumari, S. A. Nabi, and P. Priyanka, “Educational Data Mining and Its Role in Educational Field”, International Journal of
Computer Science and Information
Technologies, Vol. 5, No. 2, 2014, pp.
2458-2461.
[10] A.F. Mashat, M.M. Fouad, S.Y. Philip, and T.F. Gharib, “Discovery of Association Rules from University Admission System Data”,
International Journal of Modern Education
and Computer Science, Vol. 5, No. 4, 2013,
pp. 1-7.
[11] A. Alashqur, S. Badran, and J. O. R. D. A. N. Amman, “Mining association rules: A database perspective”, International Journal of Computer Science and Network Security
(IJCSNS), Vol 8, No. 12, 2008, pp, 69-74.
[12] A. Peña-Ayala, “Educational Data Mining: A Survey and a Data Mining-based Analysis of Recent Works” , Expert Systems with
Applications, Vol. 41, No. 4, 2014, pp.
1432-1462.
[13] R. Agrawal and R. Srikant, “Fast Algorithms for Mining Association Rules”, Proceedings
of the 20th VLDB Conference, Santiago,
Chile, 1994, pp. 478-499.
[14] Y. L. Chen, K. Tang, R. J. Shen, and Y. H. Hu, “Market basket analysis in a multiple store environment”, Decision Support
Systems, Vol. 40 No. 2, 2005, pp. 339-354.
[15]Y. Boztuğ and T. Reutterer, “A Combined Approach for Segment-Specific Market Basket Analysis”, European Journal of
Operational Research, Vol. 187, No. 1, 2008,
pp. 294-312.
[16] H. Aguinis, L. E Forcum, and H. Joo, “Using Market Basket Analysis in Management Research”, Journal of Management, Vol. 39, No. 7, 2013, pp. 1799-1824.
[17] P. Melgueira, and L. Rato, Finding Association Rules in College Course Progression, 2015. [18] A. Buldu, and K. Üçgün, “Data Mining
Application on Students’ Data”,
Procedia-Social and Behavioral Sciences, Vol. 2, No. 2,
2010, pp. 5251-5259.
886 [20] U. Fayyad, G. Piatetsky-Shapiro, and P.
Smyth, “From Data Mining to Knowledge Discovery in Databases”, AI magazine, Vol. 17, No. 3, 1996, p. 37.
[21] D. T. Larose, Discovering knowledge in data: an introduction to data mining. 2nd Edn., USA: John Wiley & Sons. 2014.
[22] L. Cavique, “A Scalable Algorithm for the Market Basket Analysis”, Journal of
Retailing and Consumer Services, Vol. 14,
No. 6, 2007, pp. 400-407.
[23] R. S. J. D. Baker, “Data Dining for Education”, International Encyclopedia of
Education, Vol. 7, No. 3, 2010, pp.112-118.
[23] M. J. Zaki, S. Parthasarathy, M. Ogihara, and W. Li, “New Algorithms for Fast Discovery of Association Rules”, In: KDD-97,
University of Rochester, August 1997, pp 283-286
[25] G. Li, Y. Hu, H. Chen, H. Li, M. Hu, Y. Guo, and M. Sun, “Data Partitioning and Association Mining for Identifying VRF Energy Consumption Patterns Under Various Part Loads and Refrigerant Charge Conditions”, Applied Energy, Vol. 185, 2017, pp. 846-861.
[26] G. S. Linoff, and M. J. Berry, Data Mining Techniques: For Marketing, Sales, and Customer Relationship Management, USA: John Wiley & Sons; 2011.
[27] R. C. Agarwal, C. C. Aggarwal, and V. V. V. Prasad, “A Tree Projection Algorithm for Generation of Frequent Item Sets”, Journal of
Parallel and Distributed Computing, Vol. 61,
No. 3, 2001, pp. 350-371.
[28] B. Vindevogel, D. Van den Poel, and G. Wets, “Why Promotion Strategies based on Market Basket Analysis do not Work”, Expert
Systems with Applications, Vol. 28, No. 3,
2005, pp. 583-590.
[29] M. Toloo, B. Sohrabi, and S. Nalchigar, “A New Method for Ranking Discovered Rules from Data Mining by DEA”, Expert Systems
with Applications, Vol. 36, No. 4, 2009, pp.
8503-8508.
[30] P. Dubey, Association Rule Mining on Distributed Data. International Journal of
Scientific & Engineering Research, Vol. 3,