http://dx.doi.org/10.4236/ojs.2014.41004
Comparative Study of Four Methods in Missing Value
Imputations under Missing Completely at
Random Mechanism
Michikazu Nakai1, Ding-Geng Chen2, Kunihiro Nishimura1, Yoshihiro Miyamoto1
1
Department of Preventive Medicine and Epidemiologic Informatics, National Cerebral and Cardiovascular Center, Suita, Japan
2
School of Nursing & Department of Biostatistics and Computational Biology, School of Medicine, University of Rochester Medical Center, New York, USA
Email: [email protected]
Received December 12, 2013; revised January 12, 2014; accepted January 19,2014
Copyright © 2014 Michikazu Nakai et al. This is an open access article distributed under the Creative Commons Attribution License, which permits unrestricted use, distribution, and reproduction in any medium, provided the original work is properly cited. In accor- dance of the Creative Commons Attribution License all Copyrights © 2014 are reserved for SCIRP and the owner of the intellectual property Michikazu Nakai et al. All Copyright © 2014 are guarded by law and by SCIRP as a guardian.
ABSTRACT
In analyzing data from clinical trials and longitudinal studies, the issue of missing values is always a fundamental challenge since the missing data could introduce bias and lead to erroneous statistical inferences. To deal with this challenge, several imputation methods have been developed in the literature to handle missing values where the most commonly used are complete case method, mean imputation method, last observation carried forward (LOCF) method, and multiple imputation (MI) method. In this paper, we conduct a simulation study to investi- gate the efficiency of these four typical imputation methods with longitudinal data setting under missing com- pletely at random (MCAR). We categorize missingness with three cases from a lower percentage of 5% to a higher percentage of 30% and 50% missingness. With this simulation study, we make a conclusion that LOCF method has more bias than the other three methods in most situations. MI method has the least bias with the best coverage probability. Thus, we conclude that MI method is the most effective imputation method in our MCAR simulation study.
KEYWORDS
Missing Data; Imputation; MCAR; Complete Case; LOCF
1. Introduction
Missing values often occur in clinical trials and longitudinal studies. Whenever there are missing data, there is loss of information, which causes a reduction in efficiency or a drop in the precision in statistical inference. Also, the location of the missing data is important for precision. That is, both the missingness spread sporadically over many subjects as well as how highly correlated the missing data are with the observed data will affect the loss of precision. Under certain circumstances, missing data can introduce bias and thereby lead to misleading statistical inferences in the data analysis. It is common knowledge that the greater the number of the missing values, the more bias exists in the data analysis.
The challenge of the imputation methods is, even when an imputed value is closer to an ideal predicted ob- servation; it is still considered as imputed data, not real data. Thus, some researchers neglect to consider imputa- tion methods as a tool of missing value since the imputed values are not actually measured. Because of the issue, when imputed values are used for an analysis, the dataset normally includes some bias. It depends on a re- searcher’s decision whether they analyze with a complete dataset or an imputed dataset. Although the rule of thumb suggests that 20% or less of missing data is acceptable for imputation [1-4], no clear rules exist regarding how much is too much missing data [5].
Background
Recently, several researchers have conducted simulation studies to check the efficiency of imputation methods. For example, Musil et al. [5] investigated with simulations to compare the complete case method, mean imputa- tion method, regression method, and EM algorithm method, and concluded that regression method produced good estimates while mean imputation method was the least efficient method. In contrast, Engel and Diehr [6] concluded that the last observation carried forward (LOCF) method was the most effective method out of 14 imputation methods. Also, Tufis [7] conducted the imputation comparison among mean imputation method, EM algorithm method, and multiple imputation (MI) method and concluded that MI method was the most efficient method to estimate missing values. In addition, Janssen et al. [8] produced the simulation for comparison of complete case method, exclusion of D-dimer level from the model and MI method. They concluded that MI method showed the least bias out of three methods. However, we cannot simply adopt MI method in every situa- tion. For example, Zhou et al. [9] compared MI method with complete case method and mean imputation me- thod. They concluded better standard deviation estimates for MI method than mean imputation method. Shrive et al. [10] suggested that MI method was the most accurate method for dealing with missing data in most data scenarios, but in some situations, mean imputation method actually performed slightly better than MI method. Moreover, White and Carlin [11] pointed out a similar concept, stating that complete case method was more ef- ficient than MI method in some scenarios, even though MI method was widely advocated as an improvement over complete case method. Cheung [12] concluded that complete case method performed well in most of his experimental settings compared with EM algorithm method and MI method. Therefore, there is no consensus on which method is uniformly better than the other methods and the research is still going on to study and search for the best imputation methods in different settings for developing a guideline to determine appropriate imputa- tion methods. This paper is then another addition to the research.
In this paper, we will conduct a study to simulate datasets and then apply known missing mechanism to these simulated dataset. With these simulations, we can show the efficiency of the four imputation methods and give more appropriate recommendations on when and how to use these imputation techniques. The paper is orga- nized as follows. In Section 2, we briefly review the missing mechanism and methods of imputation methods. In Section 3, we describe the simulation settings and detail the simulation results. The datasets with different simu- lation conditions are used in Section 4 to further illustrate these methods with “Discussion and Conclusions” given in Section 5.
2. Theory
2.1. Missing Mechanism
In general, three types of missing data mechanisms exist which were developed by Little and Rubin [3]. Let Y denote the n×p matrix of complete data, the observed part of Y by Yobs and the missing part of Y by Ymis, and missing data indicator R denotes as 1 for missing and 0 otherwise. Missing at random (MAR) can be expressed as the probability that an observation is missing depends on Yobs, but not on Ymis, denoted by
(
,)
(
obs,)
P R Y ϕ =P R Y ϕ for all Ymis where φ is an unknown parameter. When missingness patterns are MAR, the probability of missingness at each time point is conditionally independent of current and future responses, given the history of the observed responses prior to that occasion. In addition, missing completely at random (MCAR) is the special case of MAR, and has stronger assumptions than MAR. Data are said to be MCAR when the probability that an observation is missing doesn’t depend on both Yobs and Ymis, denoted by
(
,)
( )
missing data process are unrelated to the parameters to be estimated. In contrast, not missing at random (NMAR) is referred as a non-ignorable mechanism. Data are said to be NMAR when the probability that an observation is missing depends on both Yobs and Ymis, denoted by P R Y
(
,ϕ)
=P R Y(
obs,Ymis,ϕ)
where φ is an unknown pa- rameter.2.2. Imputation Methods
Four methods are commonly used in missing value imputations: 1) complete case method; 2) mean imputation method; 3) last observation carried forward method, and 4) multiple imputation method. In this paper, we eva- luate these four imputation methods and describe the advantages and disadvantages of each imputation and give recommendations on characteristics which might be better suit for each imputation method.
2.2.1. Complete Case Method
Complete Case (thereafter referred as “Complete”) method is to simply delete all cases with missing values at any measurement occasion. If data are MCAR, then the reduced sample will be a random subsample of the original sample, which implies for any parameter of interest, if the estimates are unbiased for the full dataset, they will also be unbiased for the complete case dataset. This imputation method must be used with caution be- cause complete method will yield an unbiased parameter only when missingness pattern in MCAR. When the missingness is not MCAR, then the imputed result may be biased because complete case method may be unre- presentative of the full population. Another caution is that the substantial loss of information should be consi- dered by deleting all cases with missing values. Therefore, this imputation is the most effective when the data have MCAR missingness pattern with fairly small missingness.
2.2.2. Mean Imputation Method
The main difference between complete method and mean imputation (thereafter referred as “Mean”) method is to maintain the sample size when missingness occurs. Instead of deleting all cases with missing values at any measurement occasion, the mean imputation method takes a mean of the non-missing values at the measurement occasion and imputes it to missing values. When dealing with fairly large missingness, this imputation method can severely distort the distribution for the variable as well as underestimate the standard deviation, which may cause a large kurtosis. The missing mechanism must be MCAR for maintaining the efficiency [13-15].
2.2.3. Last Observation Carried Forward Method
Last observation carried forward (LOCF) method was used widely in the medical field [4]. In this method, every missing value is replaced by the last observed value from the same subject. Since the value of the outcome be- fore the missing value is used, the time effect doesn’t influence to its imputed value. This situation could be considered as unrealistic in many settings. Thus, LOCF method tends to underestimate the true variability of the data [16]. Compared to complete method, LOCF method maintains the sample size. However, LOCF method may include bias when dealing with a longitudinal dataset in addition to the long time point of measurement in each interval. Since a previous observation is used to replace the missing value, data in each time interval in- crease linearly, creating bias in the imputed observation. When the linearity is larger, then the efficiency of LOCF method is questionable. Recent research has shown that LOCF method creates bias even when data is MCAR. Thus, this method gives a valid analysis only if the missing mechanism is MCAR [17] despite the as- sumption for the missing mechanism as MAR cited in the literature. To maintain the efficiency of LOCF method, the observations in the dataset must be approximately close to each other. The nearby sample values or short time point of measurement would be necessary for the effectiveness of LOCF method.
2.2.4. Multiple Imputation
addition, the uncertainty inherent in missing values is ignored in MI method. Allison [18] states that MI method produces slightly different results each time it is used with the same dataset. The actual procedure is as follows. Suppose that a parameter θ is computed from m imputations. Let ˆθi and Uˆi be the point and variance esti- mates from the ith imputed data set, i=1, 2,,m. Then, the point estimate for θ from MI is the average of the m imputed data estimates as follow:
1 1 m ˆ
i i m θ θ =
=
∑
(1)Let W be the within-imputation variance, which is calculated from the average of the m imputed as follows:
1 1 m ˆ
i i
W U
m =
=
∑
(2)And, let B be the between-imputation variance, which is calculated by computing the variance for each para- meter estimate such that,
(
)
2 1 1 ˆ 1 m i i Bm = θ θ
= −
−
∑
(3)Then the variance estimate associated with θ is the total variance such that, 1
1
T W B
m
= + +
(4)
This is a very straightforward combination of between- and within-imputation variability. The statistic T
θ θ−
is approximately distributed as a t-distribution with vm degrees of freedom:
(
)
(
)
(
)
2 1 1 1 1 1 where . m m mv m r
m B r W − − = − − − = (5)
The parameter rm is called the relative increase in variance due to non-response. In SAS, MI method can be carried out using PROC MI and PROC MIANALYZE from SAS version 8 or higher. In R, “mi” package can handle multiple imputation method. In this paper, we generate 5 imputed datasets by the MCMC imputation us- ing PROC MI. More reference for MI method can be found in [19,20].
3. Simulation Study
3.1. Simulation Settings
Data from repeated measurements Yit (i=1,,100;t=1,, 5) are generated from a multivariate normal distri- bution with mean response E Y
( )
it =β0+β1t where β =0 intercept and β =1 slope. The correlation between two variables of Yis and Yit is simulated withs t
ρ − =
correlation for ρ≥0. We simulate N = 1000 longi- tudinal datasets using SAS 9.2. The variance at each occasion is assumed to be constant over time, while the correlations have a first-order autoregressive (AR(1)) pattern with positive coefficient [1]. The program using PROC IML in SAS to create AR(1) dataset is shown in Appendix 1. The dataset is referred as “Original” the- reafter. Assuming that the first occasion was fully observed, simple random sampling without replacement was used to make MCAR datasets and to test following cases:
Case I: 5% missingness at each time point;
Case II: 0%, 5%, 10%, 15% and 20% at time points 1, 2, 3, 4, 5, respectively. Case III: 0%, 10%, 20%, 30% and 50% at time points 1, 2, 3, 4, 5, respectively.
3.2. Simulation Performance Measures
vestigate the effectiveness for imputation methods. The other parameters used in the simulations are: ρ =0.7, 2
1
σ = and β =0 10.
3.3. Missingness Mechanism
The missing mechanism was simulated as a MCAR. In order to make a MCAR dataset, we assume the first time point of measurement to be fully observed. Then, we use a RANUNI function to assign a random number to each observation. After a random number is generated and assigned to each dataset, sort the dataset by the as- signed variable to each occasion. Then, we generate observations depended on the amount of missing percentage. Since each occasion is assigned different random numbers, this missingness satisfies MCAR condition. Note to test the missing mechanism, Little’s MCAR test [22] can be used to check whether the produced datasets are MCAR or not. In SPSS, the Missing Values Analysis (MVA) provides this test. In SAS, there is a macro pro-gram for this purpose which requires SAS version 8.2 or higher because PROC MI is used to obtain ML esti-mates of the covariance matrix and mean vector.
[image:5.595.135.465.474.732.2]3.4. Simulation Result
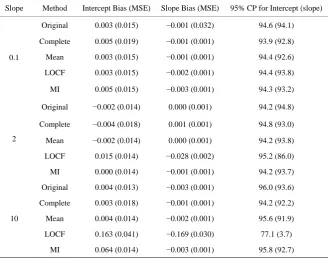
Table 1 provides the result for Case I missingness pattern where each time point includes 5% missingness. Since the missingness is constant in each time point, Case I examines the relationship between imputation me- thods and AR(1) correlation structure. For small slope = 0.1, there is no bias in each imputation method. In- creasing slope to 2, LOCF method starts to show bias for both Intercept and Slope, which reflects 95% CP for slope (86.0%). When slope = 10, LOCF method clearly shows larger bias for both Intercept and Slope with very poor 95% CP for Intercept and Slope (77.1% and 3.7%, respectively). Other imputation methods don’t indicate huge difference from original dataset. Thus, the main difference for Case I among imputations is LOCF method. This method clearly includes bias in both Intercept and Slope for larger slope.
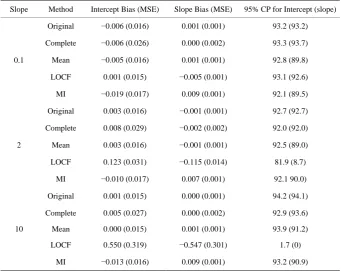
Table 2 provides the result for Case II missingness pattern. After considering the relationship between corre- lation and imputation, Case II examines the efficiency of imputation methods given the result of Case I. For Slope = 0.1, the bias for Intercept and Slope in MI method is slightly higher than that in the original dataset even though this bias is considered as small. The MSE values are also quite similar. For other methods, there is not a detectable significant difference to the Case I in both Bias and MSE. For Slope = 2 or 10, Intercept Bias and Slope Bias for LOCF method clearly differ from original dataset (Intercept bias of slope = 2: 0.003 (original),
Table 1. (Case I) 5% missingness in each time points.
Slope Method Intercept Bias (MSE) Slope Bias (MSE) 95% CP for Intercept (slope)
0.1
Original 0.003 (0.015) −0.001 (0.032) 94.6 (94.1) Complete 0.005 (0.019) −0.001 (0.001) 93.9 (92.8) Mean 0.003 (0.015) −0.001 (0.001) 94.4 (92.6) LOCF 0.003 (0.015) −0.002 (0.001) 94.4 (93.8)
MI 0.005 (0.015) −0.003 (0.001) 94.3 (93.2)
2
Original −0.002 (0.014) 0.000 (0.001) 94.2 (94.8) Complete −0.004 (0.018) 0.001 (0.001) 94.8 (93.0) Mean −0.002 (0.014) 0.000 (0.001) 94.2 (93.8) LOCF 0.015 (0.014) −0.028 (0.002) 95.2 (86.0)
MI 0.000 (0.014) −0.001 (0.001) 94.2 (93.7)
10
Original 0.004 (0.013) −0.003 (0.001) 96.0 (93.6) Complete 0.003 (0.018) −0.001 (0.001) 94.2 (92.2) Mean 0.004 (0.014) −0.002 (0.001) 95.6 (91.9)
LOCF 0.163 (0.041) −0.169 (0.030) 77.1 (3.7)
Table 2. (Case II) 0%, 5%, 10%, 15% and 20% missing in each time points, respectively.
Slope Method Intercept Bias (MSE) Slope Bias (MSE) 95% CP for Intercept (slope)
0.1
Original −0.006 (0.016) 0.001 (0.001) 93.2 (93.2) Complete −0.006 (0.026) 0.000 (0.002) 93.3 (93.7)
Mean −0.005 (0.016) 0.001 (0.001) 92.8 (89.8)
LOCF 0.001 (0.015) −0.005 (0.001) 93.1 (92.6)
MI −0.019 (0.017) 0.009 (0.001) 92.1 (89.5)
2
Original 0.003 (0.016) −0.001 (0.001) 92.7 (92.7) Complete 0.008 (0.029) −0.002 (0.002) 92.0 (92.0)
Mean 0.003 (0.016) −0.001 (0.001) 92.5 (89.0)
LOCF 0.123 (0.031) −0.115 (0.014) 81.9 (8.7)
MI −0.010 (0.017) 0.007 (0.001) 92.1 90.0)
10
Original 0.001 (0.015) 0.000 (0.001) 94.2 (94.1) Complete 0.005 (0.027) 0.000 (0.002) 92.9 (93.6)
Mean 0.000 (0.015) 0.001 (0.001) 93.9 (91.2)
LOCF 0.550 (0.319) −0.547 (0.301) 1.7 (0)
MI −0.013 (0.016) 0.009 (0.001) 93.2 (90.9)
0.123 (LOCF), Intercept bias of slope = 10: 0.001(original), 0.550 (LOCF) and Slope bias of slope = 2: −0.001 (original), −0.115 (LOCF), Slope bias of slope = 10: 0.00 (original), −0.547 (LOCF)). Moreover, 95% CP clearly indicates bias in LOCF method.
Table 3 provides the results for Case III missingness pattern. The main feature of Case III is to consider not only 20% missingness, but also 30% and 50% missingness. It can be seen from this table that when the slope in- creases from 0.1 to 2 and to 10, the biases from both Intercept and Slope in LOCF are getting higher where the coverage probabilities are getting lower to almost zero. The rest methods are compatible.
4. Simulation in Other Scenarios
In this section, we will investigate different scenarios to compare the influence of imputation methods with smaller ρ = 0.1 from ρ = 0.7 in previous section. Since AR(1) is too restricted, we also investigate the perfor- mances for these methods under “unstructured” correlation structure.
4.1. Simulation Result with Small ρ Value
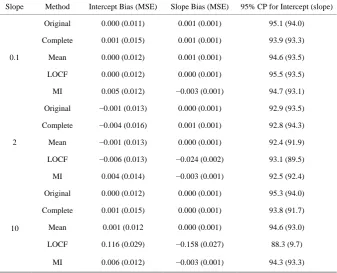
The simulation with Case I missingness pattern for small ρ = 0.1 where each time point includes 5% missing- ness is listed in Table 4. It can be seen that the results are very much similar to the results in Table 1. Every im- putation method estimates well for slope = 0.1. In slope = 2 or slope = 10, LOCF method starts to include some bias and 95% CP for slope is decreasing. The simulation with Case II missingness pattern for small ρ also indi- cates similarly with Table 2 which is not included in this paper. The behavior for Case III as listed in Table 5
doesn’t have much difference except decreasing CP. With slope = 0.1 in Table 5, 95% CP for Slope is 94.9% (original), 88.4% (complete), 79.3% (mean), 91.1% (LOCF) and 84.4% (MI). Even when slope = 2 or slope = 10, the CP for MI method is higher than that in mean imputation. Even though the result is similar to that in ρ = 0.7, the smaller ρ-value clearly influences the CP and the efficiency of imputation methods. Overall, MI method is shown as the most effective imputation method out of four imputations.
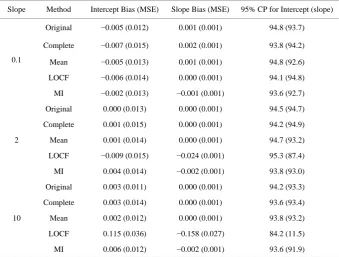
4.2. Simulation Result with Unstructured Correlation Structure
Table 3. (Case III) 0%, 10%, 20%, 30% and 50% missing in each time points, respectively.
Slope Method Intercept Bias (MSE) Slope Bias (MSE) 95% CP for Intercept (slope)
0.1
Original −0.003 (0.014) 0.000 (0.001) 94.8 (94.6) Complete −0.005 (0.062) 0.001 (0.005) 91.8 (89.0)
Mean −0.002 (0.016) 0.001 (0.001) 93.2 (84.1)
LOCF 0.022 (0.014) −0.018 (0.012) 94.8 (89.4)
MI 0.010 (0.017) −0.009 (0.002) 92.2 (85.5)
2
Original −0.002 (0.015) 0.001 (0.001) 93.7 (93.2) Complete −0.009 (0.069) 0.004 (0.004) 89.5 (89.6)
Mean −0.004 (0.017) 0.002 (0.002) 92.3 (80.5)
LOCF 0.310 (0.112) −0.287 (0.084) 29.2 (0)
MI 0.007 (0.019) −0.007 (0.002) 90.7 (83.9)
10
Original −0.001 (0.015) −0.001 (0.001) 93.3 (93.7) Complete −0.006 (0.063) −0.001 (0.001) 90.6 (91.1)
Mean −0.001 (0.017) −0.001 (0.002) 91.7 (82.7)
LOCF 1.312 (1.740) −1.306 (1.710) 0 (0)
MI 0.009 (0.0017) −0.009 (0.002) 91.2 (85.7)
Table 4. Case I missingness pattern with ρ = 0.1.
Slope Method Intercept Bias (MSE) Slope Bias (MSE) 95% CP for Intercept (slope)
0.1
Original 0.000 (0.011) 0.001 (0.001) 95.1 (94.0) Complete 0.001 (0.015) 0.001 (0.001) 93.9 (93.3)
Mean 0.000 (0.012) 0.001 (0.001) 94.6 (93.5)
LOCF 0.000 (0.012) 0.000 (0.001) 95.5 (93.5)
MI 0.005 (0.012) −0.003 (0.001) 94.7 (93.1)
2
Original −0.001 (0.013) 0.000 (0.001) 92.9 (93.5) Complete −0.004 (0.016) 0.001 (0.001) 92.8 (94.3)
Mean −0.001 (0.013) 0.000 (0.001) 92.4 (91.9)
LOCF −0.006 (0.013) −0.024 (0.002) 93.1 (89.5)
MI 0.004 (0.014) −0.003 (0.001) 92.5 (92.4)
10
Original 0.000 (0.012) 0.000 (0.001) 95.3 (94.0) Complete 0.001 (0.015) 0.000 (0.001) 93.8 (91.7)
Mean 0.001 (0.012 0.000 (0.001) 94.6 (93.0)
LOCF 0.116 (0.029) −0.158 (0.027) 88.3 (9.7)
MI 0.006 (0.012) −0.003 (0.001) 94.3 (93.3)
[image:7.595.130.468.404.677.2]Table 5. Case III missingness pattern with ρ = 0.1.
Slope Method Intercept Bias (MSE) Slope Bias (MSE) 95% CP for Intercept (slope)
0.1
Original −0.001 (0.013) 0.001 (0.001) 94.1 (94.9) Complete 0.003 (0.055) −0.001 (0.005) 89.7 (88.4) Mean −0.001 (0.017) 0.001 (0.002) 86.9 (79.3)
LOCF 0.022 (0.014) −0.016 (0.001) 92.9 (91.1)
MI 0.019 (0.018) −0.011 (0.002) 89.3 (84.4)
2
Original 0.000 (0.013) 0.000 (0.001) 93.2 (93.6) Complete −0.008 (0.055) 0.002 (0.005) 89.1 (89.9) Mean −0.002 (0.017) 0.001 (0.002) 86.3 (79.7)
LOCF 0.362 (0.147) −0.303 (0.094) 17.7 (0)
MI 0.020 (0.017) −0.012 (0.002) 88.2 (84.3)
10
Original −0.004 (0.013) 0.001 (0.001) 93.9 (92.7) Complete −0.005 (0.052) 0.001 (0.005) 90.7 (92.4) Mean −0.004 (0.017) 0.001 (0.002) 86.4 (76.5)
LOCF 1.345 (1.836) −1.319 (1.746) 0 (0)
MI 0.017 (0.018) −0.011 (0.002) 88.7 (82.2)
Table 6. Case I missingness pattern with unstructured correlation structure.
Slope Method Intercept Bias (MSE) Slope Bias (MSE) 95% CP for Intercept (slope)
0.1
Original −0.005 (0.012) 0.001 (0.001) 94.8 (93.7) Complete −0.007 (0.015) 0.002 (0.001) 93.8 (94.2)
Mean −0.005 (0.013) 0.001 (0.001) 94.8 (92.6)
LOCF −0.006 (0.014) 0.000 (0.001) 94.1 (94.8)
MI −0.002 (0.013) −0.001 (0.001) 93.6 (92.7)
2
Original 0.000 (0.013) 0.000 (0.001) 94.5 (94.7) Complete 0.001 (0.015) 0.000 (0.001) 94.2 (94.9)
Mean 0.001 (0.014) 0.000 (0.001) 94.7 (93.2)
LOCF −0.009 (0.015) −0.024 (0.001) 95.3 (87.4)
MI 0.004 (0.014) −0.002 (0.001) 93.8 (93.0)
10
Original 0.003 (0.011) 0.000 (0.001) 94.2 (93.3) Complete 0.003 (0.014) 0.000 (0.001) 93.6 (93.4)
Mean 0.002 (0.012) 0.000 (0.001) 93.8 (93.2)
LOCF 0.115 (0.036) −0.158 (0.027) 84.2 (11.5)
MI 0.006 (0.012) −0.002 (0.001) 93.6 (91.9)
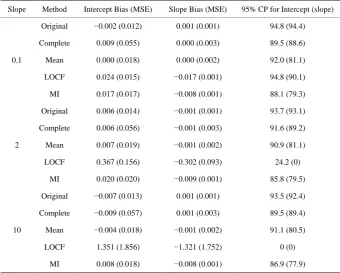
both mean method and MI method. In summary, the scenario of unstructured correlation structure gives less ac- curacy of imputation methods than that in AR(1) correlation structure.
5. Discussion and Conclusions
[image:8.595.128.468.402.659.2]Table 7. Case III missingness pattern with unstructured correlation structure.
Slope Method Intercept Bias (MSE) Slope Bias (MSE) 95% CP for Intercept (slope)
0.1
Original −0.002 (0.012) 0.001 (0.001) 94.8 (94.4) Complete 0.009 (0.055) 0.000 (0.003) 89.5 (88.6)
Mean 0.000 (0.018) 0.000 (0.002) 92.0 (81.1)
LOCF 0.024 (0.015) −0.017 (0.001) 94.8 (90.1)
MI 0.017 (0.017) −0.008 (0.001) 88.1 (79.3)
2
Original 0.006 (0.014) −0.001 (0.001) 93.7 (93.1) Complete 0.006 (0.056) −0.001 (0.003) 91.6 (89.2)
Mean 0.007 (0.019) −0.001 (0.002) 90.9 (81.1)
LOCF 0.367 (0.156) −0.302 (0.093) 24.2 (0)
MI 0.020 (0.020) −0.009 (0.001) 85.8 (79.5)
10
Original −0.007 (0.013) 0.001 (0.001) 93.5 (92.4) Complete −0.009 (0.057) 0.001 (0.003) 89.5 (89.4)
Mean −0.004 (0.018) −0.001 (0.002) 91.1 (80.5)
LOCF 1.351 (1.856) −1.321 (1.752) 0 (0)
MI 0.008 (0.018) −0.008 (0.001) 86.9 (77.9)
longitudinal datasets with constant variance and AR(1) correlation. We also classified three different missing patterns. One pattern investigated up to 30% and 50% missingness to maximize the estimation for the accuracy of imputations. Moreover, we focused on different ρ values to compare the imputation results. Furthermore, since AR(1) structure is too restricted in reality, we conducted the simulation with unstructured structure to ob- serve if correlation structure affects the efficiency of imputation methods.
We chose to examine MCAR instead of MAR or NMAR. As stated in Section 1, our main objective is to test imputation methods in different settings and to compare the effectiveness so that it is easier for researchers to determine how to use imputation methods appropriately. Based on our knowledge, such a simulation study has not been conducted in the literature.
In this simulation study, we concluded that MI method is the most effective imputation method out of four imputation methods. The complete method and LOCF method predictably included some bias at certain mis- singness. The mean method showed less accuracy in 95% CP, especially for small ρ values. As stated in Section 2, the complete method has a disadvantage of losing sample size, which reduces power and test efficiency. In this simulation, the complete method performed well in Case I. However, when it gets to Case II or Case III, even though missingness could be handled, its estimation was approximated far from the original dataset, espe-cially intercept MSE. Small sample size maintains representative of population, but 95% CP gets lower in Case III. Hence, in addition to the MCAR assumption, the complete method could be handled up to Case II.
thod shows some bias even in MCAR. To our knowledge, MAR is the assumption for LOCF method. However, this simulation proves that the effectiveness of LOCF method is not the matter of missing mechanism, but re- lated to the magnitude of the slope. Even though its method is frequently used in clinical trial data, Kim [23] and Tang et al. [24] showed inaccuracy of this imputation method. Further study for determining which missing me- chanism fits would be another research field.
In our simulation study, we concluded that the MI method is the most effective imputation method. When missingness gets large, this imputation estimates well even when there is small time point of measurement.
In this paper we simulated under the simple linear regression, β0+β1t. It is worthwhile for a future study to conduct simulations by adding covariates or nonlinear relationship in the regression equation. With nonlinear equation, we will be able to observe different relationship where the linear model is not appropriate. Also, we could include both covariates and nonlinearity together in the equation to analyze their influences on accuracy of these imputation methods. In addition, a study on categorical dataset such as sex or disease category is under investigation.
Acknowledgements
We appreciate the comments and suggestions from Dr. Nicole Trabold who improved this manuscript signifi- cantly.
REFERENCES
[1] G. M. Fitzmaurice, N. M. Laird and J. H. Ware, “Applied Longitudinal Analysis,” Wiley, New Jersey, 2004. [2] D. Hedeker and R. D. Gibbons, “Longitudinal Data Analysis,” Wiley, New Jersey, 2006.
[3] R. J. A. Little and D. B. Rubin, “Statistical Analysis with Missing Data,” 2nd Edition, Wiley, New Jersey, 2002.
[4] J. L. Schafer and J. W. Graham, “Missing Data: Our View of the State of the Art,” Psychological Methods, Vol. 7, No. 2, 2002, pp. 147-177. http://dx.doi.org/10.1037/1082-989X.7.2.147
[5] C. M. Musil, C. B. Warner, P. K. Yobas and S. L. Jones, “A Comparison of Imputation Techniques for Handling Missing Data,”
Western Journal of Nursing Research, Vol. 24, No. 7, 2002, pp. 815-829. http://dx.doi.org/10.1177/019394502762477004 [6] J. M. Engel and P. Diehr, “Imputation of Missing Longitudinal Data: A Comparison of Methods,” Journal of Clinical
Epidemi-ology, Vol. 56, No. 10, 2003, pp. 968-976. http://dx.doi.org/10.1016/S0895-4356(03)00170-7
[7] C. D. Tufis, “Multiple Imputation as a Solution to the Missing Data Problem in Social Sciences,” Calitatea Vietii, Vol. 1-2, 2008, pp. 199-212.
[8] K. J. M. Janssen, A. T. Donders, F. E. Harrell Jr., Y. Vergouwe, Q. Chen, D. E. Grobbee and K. G. M. Moons, “Missing Cova-riate Data in Medical Research: To Impute Is Better than to Ignore,” Journal of Clinical Epidemiology, Vol. 63, No. 7, 2010, pp. 721-727. http://dx.doi.org/10.1016/j.jclinepi.2009.12.008
[9] X. H. Zhou, G. J. Eckert and W. H. Tierney, “Multiple Imputation in Public Health Research,” Statistics in Medicine, Vol. 20, No. 9-10, 2001, pp. 1541-1549. http://dx.doi.org/10.1002/sim.689
[10] F. M. Shrive, H. Stuart, H. Quan and W. A. Ghali, “Dealing with Missing Data in a Multi-Question Depression Scale: A Com-parison of Imputation Methods,” BMC Medical Research Methodology, Vol. 6, 2006, p. 57.
[11] I. R. White and J. B. Carlin, “Bias and Efficiency of Multiple Imputation Compared with Complete-Case Analysis for Missing Covariate Values,” Statistics in Medicine, Vol. 29, No. 28, 2010, pp. 2920-2931. http://dx.doi.org/10.1002/sim.3944
[12] M. W.-L. Cheung, “Comparison of Methods of Handling Missing Time-Invariant Covariates in Latent Growth Models under the Assumption of Missing Completely at Random,” Organizational Research Methods, Vol. 10, No. 4, 2007, pp. 609-634. http://dx.doi.org/10.1177/1094428106295499
[13] S. M. Fox-Wasylyshyn and M. M. El-Masri, “Handling Missing Data in Self-report Measures,” Research in Nursing & Health, Vol. 28, No. 6, 2005, pp. 488-495. http://dx.doi.org/10.1002/nur.20100
[14] M. Nakai, “Analysis of Imputation Methods for Missing Data in AR(1) Longitudinal Dataset,” International Journal of Ma-thematical Analysis, Vol. 5, No. 45, 2011, pp. 2217-2227.
[15] M. Nakai, “Effectiveness of Imputation Methods for Missing Data in AR(1) Longitudinal Dataset,” International Journal of Mathematical Analysis, Vol. 6, No. 28, 2012, pp. 1391-1394.
[16] G. Liu and A. L. Gould, “Comparison of Alternative Strategies for Analysis of Longitudinal Trials with Dropouts,” Journal of Biopharmaceutical Statistics, Vol. 12, No. 2, 2002, pp. 207-226. http://dx.doi.org/10.1081/BIP-120015744
[18] P. D. Allison, “Missing Data,” Thousand Oaks, 2002.
[19] SAS Institute Inc, “SAS/STAT® User’s Guide, Version 8,” Cary, 1999.
[20] Y. S. Su, A. Gelman, J. Hill and M. Yajima, “Multiple Imputation with Diagnostics (mi) in R: Opening Windows into the Black Box,” Journal of Statistical Software, Vol. 45, No. 2, 2011.
[21] L. M. Collins, J. L. Schafer and C. M. Kam, “A Comparison of Inclusive and Restrictive Strategies in Modern Missing Data Procedures,” Psychological Methods, Vol. 6, No. 4, 2001, pp. 330-351. http://dx.doi.org/10.1037/1082-989X.6.4.330
[22] R. J. A. Little, “A Test of Missing Completely at Random for Multivariate Data with Missing Values,” Journal of the American Statistical Association, Vol. 83, No. 404, 1988, pp. 1198-1202. http://dx.doi.org/10.1080/01621459.1988.10478722
[23] Y. Kim, “Missing Data Handling in Chronic Pain Trials,” Journal of Biopharmaceutical Statistics, Vol. 21, No. 2, 2011, pp. 311-325. http://dx.doi.org/10.1080/10543406.2011.550112
[24] L. Tang, J. Song, T. R. Belin and J. Unutzer, “A Comparison of Imputation Methods in a Longitudinal Randomized Clinical Trial,” Statistics in Medicine, Vol. 24, No. 14, 2005, pp. 2111-2128. http://dx.doi.org/10.1002/sim.2099
Appendix 1: Program in PROC IML to Create AR1 Dataset
proc iml; S2=1;rho =.7;b0=10; b1=2;/* b1 could be changed depending on slope value */
Var = J(5,5,S2); do i=1 to 5; do j=1 to 5; distance = abs(i-j);Var[i,j] = Var[i,j]*(rho**distance);end; end; call svd(u,q,v,var); vhalf = u * diag(sqrt(q)) * t(v); seed = J(5,1,0); y = J(500,1,0); time = J(500,1,0); subject = J(500,1,0); do f=1 to 100; err_ind = rannor(seed);err = vhalf * err_ind;t = (1:5)`;start = (f-1)*5 + 1; end = f*5; y[start:end,] = b0 + b1*t + err; time[start:end,] = t; subject[start:end,] = f; end; create ar1data&k. var {Y time subject};append;quit;
Appendix 2: Program in PROC Mixed
proc mixed data=ar1data&k.; class subject; model y=time/solution;