Munich Personal RePEc Archive
Are the old poor? A discussion and some
cursory evidence
Dekkers, Gijs
18 November 2008
Online at
https://mpra.ub.uni-muenchen.de/29436/
Are the old poor?
A discussion and some cursory evidence
Gijs J.M. Dekkers
1Address at the “Forum Retraite: Vieillir sans Contrainte” Caisse des Dépôts – Direction des retraites,
Bordeaux, France, November, 18th, 2008.
1 Federal Planning Bureau (FPB), Belgium, and Center for Social Policy,
Katholieke Universiteit Leuven, Belgium. The author wishes to thank Raphaël Desmet for his comments on an earlier version of this paper. Contact: [email protected], FPB, 47-49
1. introduction: the risk of poverty in old-age
Many of us associate old-age and retirement with vulnerability, both physical and economical. Even though the position of the group of elderly as a whole has improved considerably and is now no less than that of younger cohorts2, poverty among elderly remains an issue worth of analyzing, also since they have fewer possibilities to recover from a drop in income, for example by changing their labour market behaviour (Hurd, 1990, Cherchye et al., 2008).
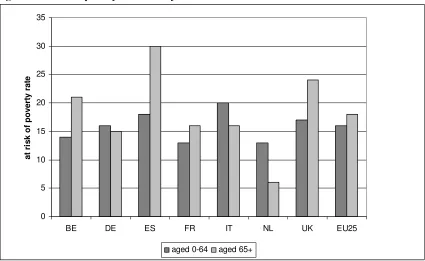
[image:3.612.93.518.372.633.2]This paper hopes to give cursory evidence on the poverty position of the elderly, while discussing some recent research. We start off with Figure 1 that is based on subsequent waves of the EU-SILC dataset.
Figure 1: the risk of poverty of the elderly
0 5 10 15 20 25 30 35
BE DE ES FR IT NL UK EU25
a
t r
isk o
f
p
o
ve
rt
y r
a
te
aged 0-64 aged 65+
Source: Eurostat, EU-SILC 2004 (incomes of 2003). See SPC (2006), table 3, p. 15 for more details.
2 In fact, Sierminska et al. (2007, 1) mention that most resource transfers between generations
The conclusion from Figure 1 is that old-age seems to be associated with a higher risk of poverty, especially in Spain, Belgium and the UK. The Netherlands and Italy seem the most notable exceptions to this rule. See Dekkers and Debels (2007), Zaidi (2006), and SPC (2006, 15) for a discussion.
Jamet (2007) discusses the situation of the elderly in France. She writes that “with the introduction of a minimum pension benefit for pensioners, and rising pension values, poverty has been sharply reduced among pensioners : using the 50% of median income threshold, the poverty rate for pensioners was over 20% in 1970 and under 5% in 2002” (ONPES (2006); in Jamet (2007, 10)). In an influential paper, Kangas and Palme (2000) conclude that the extension and maturisation of pension systems has resulted in a strong decrease of income poverty among the elderly, and that poverty among the elderly in continental-European and Scandinavian countries as well as in Canada, is no longer significantly higher compared to the younger population. Only in the UK and US does an important difference in poverty risk remain.
If the position of the elderly indeed improved, then this was not because the elderly received a larger share of social expenditures. Börsch-Supan (2007) concludes that social expenditures increased gradually from 1995 on, after a relative retrenchment in the first half in the 1990’s. However, the share of social expenditures dedicated to the elderly remained surprisingly constant. The conclusion therefore is that the improved position of the elderly, in terms of poverty, was due to more targeting, and higher incomes (other than social security pensions) for the elderly.
2. A closer look at the relation between the risk of poverty and old-age
Poverty is about a lack of welfare. This welfare is difficult to define, much less to measure directly. So, social scientists often opt for an indirect measure, where poverty is based on the confrontation of the household income x, corrected for differences in size
and composition of the household, with a poverty line z. If x≤ z, then the individuals in
this household are considered to be poor. This proportion of poor is also denoted as reflecting the ‘risk of poverty’, the ‘incidence of poverty’ or the ‘at risk of poverty rate’ in the population. The higher risk of poverty of those that receive pensions can easily be explained by the fact that one common poverty line has been used. If the average level of pensions is below that of earnings, then this ceteris paribus results in a higher poverty risk for those having only a pension benefit. The ceteris paribus clause, however, is important here, because a lower inequality of pensions relative to earnings can cause the poverty risk of elderly to be lower relative to that of the active population.
The conclusion that the risk of poverty is higher for pensioners than for the active population is far from undisputed, and we discuss two reasons why this picture needs refinement. Next, we will broaden the concept of poverty, first to multidimensional poverty and related concepts. After that, we will briefly take health, and wealth into account.
2.1. Different datasets our sets of countries, different conclusions
other countries. He concludes that there is no important difference between the poverty risks of the young and elderly in France, and that elderly in Germany have a lower poverty risk.
A second example of that different datasets may result in different conclusions, is the study by Dang et al (2006, Table 3, 18). They use various national datasets (such as the
Budget de Famille for France) to derive poverty rates for various countries, including
Germany, France, Italy and the UK. Save in France, poverty among individuals aged 65 and older is considerably higher than among the population as a whole. Only in France is the difference negligible, and this is in line with the conclusion by Hallberg and therefore in opposition to the conclusions based on the SILC (SCP, ScVV) in Figure 1.
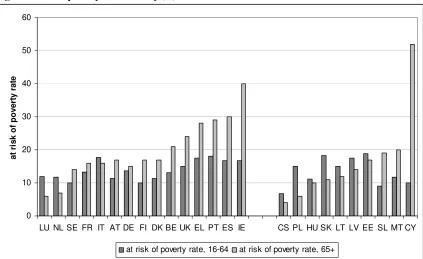
The first two examples showed that another dataset may result in different conclusions. The following discussion of is to show that limiting the analysis to the EU15 could lead to the wrong conclusion that the elderly always face a higher poverty risk. Zaidi (2006) uses the EU’s CRONOS database to compare the risk of poverty between the young (aged between 16 and 64) and those of 65 and older.
In the left pane of Figure 2, the poverty risk of elderly is higher in all countries, save Luxembourg and the Netherlands, where the situation is the reverse, and in Italy, where the poverty risks are roughly equal. So if one would only consider the EU15 in isolation, one would erroneously conclude that the elderly generally face a higher poverty risk than the active population3. But the picture clearly changes when the new member states are included. In 14 of 25 countries of the EU25, the elderly face a higher poverty risk than the active population. This includes countries with a low overall poverty rate and high social protection such as Finland, Denmark and Sweden.
3 The conclusions on the relative risk of poverty of the elderly are in all cases the same as those
Figure 2: risk of poverty of the elderly (II)
0 10 20 30 40 50 60
LU NL SE FR IT AT DE FI DK BE UK EL PT ES IE CS PL HU SK LT LV EE SL MT CY
a
t r
isk o
f
p
o
ve
rt
y r
a
te
at risk of poverty rate, 16-64 at risk of poverty rate, 65+
Source: EUROSTAT/CRONOS database. Incomes of 2003, save for Malta (2000) and the Czech Republic (2002). See Zaidi, 2006, for more details.
The difference is especially large in Ireland, Slovenia and Cyprus; here, the elderly are more than twice as high at risk of poverty as the population aged 16-64. In Belgium, the elderly are 1.6 times more likely to be in poverty than the active population. In France, this ratio is 1.2.
2.2. How important is old-age in explaining differences in poverty rates?
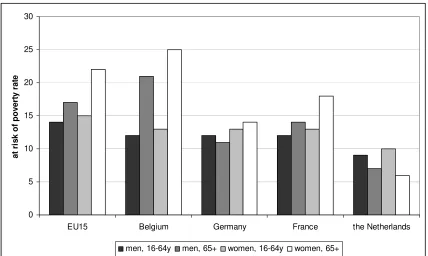
Figure 3: risk of poverty of the elderly – to gender
0 5 10 15 20 25 30
EU15 Belgium Germany France the Netherlands
a
t r
isk o
f
p
o
ve
rt
y r
a
te
men, 16-64y men, 65+ women, 16-64y women, 65+
Source: Eurostat/EU-SILC 2006 (incomes of 2005). See High Council of Finances, 2008, figure 5, page 68 for more details.
Figure 1 shows that the difference between the active population and the 65+ is limited in France. However, Figure 3 suggests that this difference does exist, but only for women. Likewise, Figure 1 shows that the poverty risk of elderly is lower than for the active population in Germany (though the difference is small). Figure 3 shows that this is only so for men; the risk of poverty for elderly women is higher compared to the active
The SPC (2006, 15) highlights several possible reasons for the higher poverty risk of the elderly. First of all, due to progressive extension of coverage of pension schemes, older cohorts have often accrued lower pension entitlements. Secondly, pension entitlements are typically not fully linked to the development of earnings, so that pensions
progressively lag behind. This effect is obviously more important for older pensioners, as they ceteris paribus retired longer ago. Third, labour market participation has traditionally been lower among women, resulting in lower pension benefits. These reasons of course do not explain nor argue why the poverty rate of elderly as a whole should be higher
compared to the active population, but suggests that the real vulnerable categories of elderly are the oldest pensioners and (single) women.
We thus have reason to believe that not the elderly as a whole, but some specific groups of elderly may face the highest poverty risks. Indeed, various studies show that
controlling for other factors –such as gender- decreases the difference between the retired and active population in terms of their poverty risk. Let us discuss two examples of studies where the risk of poverty is regressed upon various explanatory variables, including age.
Hallberg (2006) uses a multivariate logit analysis to explain differences in the probability of being observed in poverty. Explanatory variables include demographic factors (gender, single status, ..), health, education, labour market factors (current situation, and
characteristics of the last job, …). This analysis concludes that, once controlling for these variables, there is no longer a consensus that retired have a relatively higher risk of poverty (op. cit, Table 5, p. 17). In fact, the results are sometimes counterintuitive. In Sweden, being in retirement increases the probability of being observed in poverty, while the poverty risk of the elderly is lower than that of employed in Austria and Spain. In all other countries under consideration (including Germany, the Netherlands, Italy and France), the difference is not statistically significant4. His study also makes a difference
4 An obvious question is what characteristics then explain differences in poverty in this study.
in the age-groups of elderly (55-59, 60-64, 65-69, 70-79, 80+). He finds that less risk of
poverty can be found among the relative old in some countries (Greece, Germany, and Switzerland), but that there is no significant relationship in most countries.
Dekkers (2004) applies a dynamic (hazard-rate) model of falling into financial poverty given that one was not in poverty previously. This model is estimated for seven countries, using the ECHP dataset. He finds a small but significant negative effect of age on the probability of falling into financial poverty. This again suggests that the elderly have less
risk of poverty, in line with Hallberg’s analysis. This effect again is considerably smaller than other explanatory variables (including gender, relation to the labour market, level of education, and EU citizenship).
The two cited papers suggest that, on the whole, when poverty is regressed on multiple explanatory variables, the elderly have a lower risk of poverty. Finally, and before
turning to more direct measures of poverty among the elderly, two additional comments that call for caution when drawing conclusions on Figure 1 will be made in the next section.
2.3. How is poverty measured anyway?
The first comment is the above comparisons of the poverty risk of the elderly with the non-elderly are based on a national poverty line z. This makes a meaningful
within-country comparison possible. However, the comparison of between-within-country poverty risks is somewhat sketchy. This can be illustrated by an example. In August 2006, the US Census Bureau announced that about 12.5 percent of US citizens lived in poverty in 2004. The official poverty rate in Belgium for the previous year 2005 was higher, namely 14.8 percent. So, one could conclude that Belgium has a more serious poverty problem than the US. This conclusion is however put in perspective if one realizes that the poverty
line z in the US was roughly 7,500 euro per year5, while that in Belgium was 9,324 euro.
So the Belgian poverty line was almost 2,000 euro per year higher! The reason is that the US poverty line is an official poverty line which, unlike the Belgian one, is not based on median income. For comparison and pertaining to 1998, a poverty line equal to 50% median income in the US would equal no less than 11,517$ (Dang et al., 2006, Table 3, 18) and the pertaining poverty rate then would be 17.2 percent. The choice of the poverty line therefore has important consequences and comparing poverty rates between countries based on different poverty lines is, at best, quite risky6. Referring back to Figure 3, we can not say that the elderly in Spain are poor compared to, say, the Netherlands (although
they likely are), but only that elderly in Spain are poor compared to the non-elderly. In
that, the above measurement is less one of poverty but more of distribution of income.
The second additional comment starts by noting that the above discussion was based on just one, rather simple, indicator for financial poverty. It would take us too far to discuss all other kinds of income-based indicators, but we end this section by mentioning a more sophisticated income-based measure of poverty, namely the individual poverty gap, (x-z)
or (x-z)/z, reflecting the intensity of poverty among the poor. The SPC argues that, though
poverty rates are generally higher among older people, older people in poverty generally have a lower intensity of poverty than the general population. Put differently, the income of older poor is closer to the poverty line compared to non-elderly poor. They attribute this to the minimum pension benefit, which also causes inequality to decrease between employment and retirement (Brown and Prus, 2006). Dekkers and Debels (2007) apply TIP curves to compare the poverty position of various young and elderly single and married individuals between the Netherlands and Belgium. The advantage of TIP curves in essence is that they comprise information from both the above measures of risk and intensity of poverty. They conclude as well that the difference between men and
5 9827 dollar for those younger than 65, and 9060 US dollar for those of 65 and older. Exchange
rate of 31/08/2006.
6 Spicker (2001, 156) discusses another problem pertaining to setting a poverty line in relation to
(especially single) women is more important than the difference between the retired and active age categories. This confirms the conclusion from the previous paragraph.
An income-based analysis of poverty at least suggests that the relation between old-age and poverty may be more complex than suggested by the above figures.
3. Multidimensional poverty and social exclusion
Is income everything? How do the above conclusions change when the measurement of poverty is extended to include non-monetary variables? Social exclusion as a concept appeared as a subject of debate in France in the 1960s, but it became widely used after the introduction of the Revenu Minimum d’Insertion (the national assistance law) in the
1980’s (Silver, 1994, in Jehoel-Gijsbers and Vrooman, 2008). It appeared on the EU’s policy agenda in the second half of the 1990s, after the Amsterdam Treaty of
November 1997 that introduced the fight against social exclusion as a field where Europe should not stand idle (Dekkers and Legros, 2008). It is interesting that the concept of social exclusion, while having such an important impact on EU social policy, remains by itself undefined, probably to prevent heated discussions on that definition alone, so that efforts can concentrate on setting and comparing goals, and means to achieve these goals.
Recent developments in measuring multidimensional poverty use sociometric techniques to find latent dimensions underlying a wide range of unidimensional indicators. We are not going to discuss the results of all kinds of research here. Instead, and while not pretending to be exhaustive, we will concentrate on whether several recent studies find a relation between age or retirement status, and multidimensional poverty, social exclusion or related concepts.
such as heating, medical and dental treatments. Finally, the households report having trouble making ends meet. The second dimension is ‘inadequate access to social rights’, which includes inadequacy of housing, poor quality of the living environment, foregone medical care. The third dimension is ‘insufficient social participation’, which includes low frequency of social contacts and no membership of clubs or organisations, not being able to discuss personal matters with others, and not having trust in others. This
classification is then applied to three multi-country datasets, the SILC, SHARE, and ESS. Then, the indices for the three dimensions are created using categorical principal
components analysis. On the three dimensions, the same pattern emerges. For the two first dimensions, the position of the 55+ elderly in France is comparable with Belgium, Austria, Germany and Luxembourg, lower than in the Mediterranean countries, but higher than in Scandinavian countries, the Netherlands, and –surprisingly- higher than in the UK and Ireland. Only for the third dimension, low social participation, is the position of the elderly in France worse than the above-mentioned countries, and more close to the Mediterranean countries. This research is one of the few where regional differences are considered as well; for France, social exclusion in the region Nord-Pas de Calais (12%) contrast sharply with Île de France and Bassin de Paris (roughly 5%). This is roughly in line with Jamet (2007, 27), with Île de France as the main exception.
In general, the conclusion from the regional dispersion in the European countries is that elderly living in around the capital cities are better off (Brussels is the only exception), and those living in peripheral, economically weak or tourist regions, are worse off.
Comparison between age classes shows a clear difference between clusters of counties. In most countries including Belgium and France, the elderly are lessmaterially deprived
than the young. In Nordic countries, Germany and the UK, the elderly have significantly better access to social rights (housing and medical care). In the other Continental
countries including France and Belgium, differences are not significant. In the
young. When material deprivation and access to social rights are combined into one index of material poverty, (op. cit., Table 6, 39), age does not seem a statistically significant explanatory variable for belonging to the 10% most excluded elderly. It is only significantly negative in Germany, and positive in Italy. In contrast, having a bad perceived health has a strong and statistically significant impact in 24 of 26 countries under consideration (exceptions are Norway and Finland).
Tskakloglou and Papadopoulos (2002) combine the individual indicators describing income poverty, living conditions, necessities of life, and deprivations in social live into one index variable and assign a threshold. An individual is at risk of cumulative
disadvantage if they are classified as deprived on at least two of these indicators. One is then socially excluded if one suffered from cumulative disadvantage at least twice during a period of three years. This percentage varies between 1.7 in the Netherlands, and 9.9 in Portugal, and is 2.6 in Belgium and 3.3 in France (op. cit., Table 3, 217). The probability of being observed into social exclusion is then regressed on explanatory variables, including whether or not at least one of the individuals in the household is 64 or over. This turns out to be a statistically significant explanatory variable in just 4 out of 12 countries (Spain, Greece, Ireland, and Portugal). For comparison, the self-assessed health variable is significant in all countries, save Belgium, Ireland, the UK, and the
Netherlands.
Guio (2005) derives multidimensional material deprivation from the ECHP (a.o. France) as well as the EU-SILC (a.o. Belgium) dataset. Her measure concentrates on the material side of the matter. Using factor analysis, she discerns three dimensions: economic strain and enforced lack of durables, and characteristics of housing/dwelling. She finds a
positive effect of age, and hence concludes that the elderly face a higher risk of
Dekkers (2004) also uses Factor Analysis to discern two dimensions of multidimensional material poverty, using the ECHP between 1996 and 2000, for 7 countries, including Belgium and France. His first dimension is ‘material position’ (including enforced lack of durables, debts, making ends meet,…). The second dimension describes the individuals’ housing conditions. Like was the case in the causes of financial poverty, he finds a small but significant negative effect of age on the probability of falling into multidimensional
poverty. Dekkers (2008) confirms these conclusions for Belgium.
Alan Sue et. al. (2007) conclude that more Canadians report enjoying life more than before retirement than the converse. Furthermore, those that report that they do not enjoy life as much as prior to retirement more often cite health problems than economic
problems. It may therefore be relevant to extend the analysis from only poverty to include health issues. This brings us to our next section of this paper.
4. Who cares about money, as long as you’re in good health?
So far, this paper has considered financial poverty and social exclusion of the elderly compared to the non-elderly. However, health and related concepts such as
drawn. The first is that all three figures show that women have a higher life expectancy than men, but they clearly have a worse health than men: they have less expected years in good health than men (Figure 4), they live shorter without morbidity (Figure 5) and have less expected years without physical functional limitations (Figure 6). These differences are mostly proportional (i.e. relative to life expectancy), but in some countries and health variables even absolute (i.e. in number of years)! Indeed, Figure 6 of the EHEMU report shows that women in many European countries including France report lower years without physical functional limitations after 65. The second broad conclusion from the above figures is that there is a consistent North-South gradient through Europe for all 3 indicators (see also Börsch-Supan, 2007, 17).
Now poor health is clearly correlated with lower labour force participation, but differences in health do not explain differences between countries in retirement (see Blanchet and Debrand (2007), Barnay and Debrand (2006). Instead, this seems to be determined by institutional differences.
Kalwij and Vermeulen (2005) also describe health differences in Europe using the
SHARE. About 15% of the individuals aged 50-64 ever had a “severe” condition, such as a heart condition, a stroke, cancer or Parkinson. This is the highest in Belgium (17.5%) and the lowest in Switzerland (9.8%). In France, this is about 14%. More than 60% of the sample ever had a “mild” condition7 (including high blood pressure, diabetes, arthritis, etc.), and the extremes are again Belgium (68%) and Switzerland (roughly 46%). In France, this is about 62%. They show that various health-related variables have a
negative impact on the labour market participation of older workers in different countries. A remarkable exception are men in France; Kalwij and Vermeulen do not find a
statistically significant relation between any health variable and labour market
participation of men in France. For French women, there is a significant effect of having a severe health condition and a smaller significant effect of being obese on labour market activity.
7 The classification ‘severe’ and ‘mild’ are chosen by the authors. See Kalwij and Vermeulen,
Figure 4: expected years in good, fair and bad perceived health at age 65 by country
[image:17.612.90.521.267.440.2]Source: EHEMU (2006), Figure 1A, page 11(data: Eurostat and SHARE 2004).
Figure 5: expected years with and without undiagnosed morbidity, at age 65 by country
Source: EHEMU (2006), Figure 2A, page 13.(data: Eurostat and SHARE 2004) This variable contains 12 separate health conditions, including pain in the back, or joints, heart trouble, difficulties in breathing, persistent cough, swollen legs, sleeping problems, falling down, blackouts, intestine problems, incontinence.
Figure 6: expected years with and without physical functional limitations, at age 65 by country
[image:17.612.94.516.486.662.2]For men in Belgium, there is a negative effect of having a severe health condition on labour market participation. For women in Belgium, there is no statistically significant effect of any health condition, including severe and mild health condition. Nevertheless, the combined effect of age and especially level of education seems to outweigh the effect of health in most countries.
In their study on the impact of health on labour market participation, Blanchet and Debrand (2007) do not include psychological health variables. A possible reason for this is that the causal relation between labour force participation is ambiguous at best.
Nevertheless, their study might be missing part of the picture because Kalwij and Vermeulen (2005) show that no less than roughly 20% of the sample aged between 50 and 64 suffers from at least 3 mental health symptoms, such depression, suicidality or guilt. Extremes are France (roughly 31%) and Germany (15.2%). These psychological health variables affect labour market participation in Denmark, the Netherlands, Spain and Sweden for men, and Germany and Sweden for women. Furthermore, Dekkers (2008) shows that psychological health variables constitute the only within-household dimension of poverty.
5. The elderly, wealth and housing.
The life cycle model predicts borrowing prior to labour market entry, wealth
Reductions in social security pensions therefore could have deleterious effects on the adequacy of saving among these low-income households.
Short and Ruggles (2004) include the effect of financial assets and debts on poverty in the US. This introduces an age effect. The elderly have more assets and fewer debts, so their poverty risk decreases when the balance of assets is taken into account. The risk of poverty of specifically married non-elderly increases. Haveman (2006, in Sierminska et. al., 2007) however concludes that, even when wealth is taken into account, low-educated, single non-working individuals seem deprived. If we generalize the conclusion of Short and Ruggles (2004), then the differences in poverty risk presented in the first paragraph would be wrong, in that the poverty risk of the old is lower than predicted, whereas the poverty risk of the young is higher. However, the study of Short and Ruggles pertains mainly to the situation in the US, of which we know that the impact of private financial wealth is more important than in Europe (Sierminska et. al., 2007).
Williamson and Smeeding (2004) examine the change in the mix of income that older adults receive as they age, and this for five OECD countries. They conclude that property income has a small contribution to income in later life. Nevertheless, in countries where the level of social security benefits is lower (US and UK), they can make a difference. Finally, Sierminska et. al. (2007) argue that the effects of housing on consumption generally are smaller than that of financial wealth. Using a house for reverse annuity mortgages and home equity loans is a recent phenomenon which is not yet widespread in the US and almost inexistent in other countries. Fischer et. al. (2007) confirm this for the US, but argue that the US in this is an anomaly because in other countries, home
6. Back to pensions: a quick glance into the future
Börsch-Supan (2007) suggests that the size of social expenditures depends among other things on incentive effects that create an expanded demand for social expenditures towards the elderly. This has been a problem in Europe, because there is plenty of literature to show that the incentives to retire as early as possible are or were common in European pension systems8. This is why many countries have reformed their pension systems in order to improve its financial sustainability. A common trend in Europe is that replacement rates are on the decline, while second pillar pension are not (yet) stepping in the void, and certainly not for low-earnings workers.
Zaidi et. al. (2006) discern parametric and structural reforms. The former have been undertaken by all EU25 countries, and include changing contribution rates, income thresholds, the minimum number of contributions or contribution years. Parametric changes on the benefit side include changes on the retirement age, the indexation or uprating of pensions, or altering pensionable earnings. In some countries, parametric reforms preceded systematic reforms. The latter can again be subdivided into two groups: implementing a NDC (Italy, Sweden, and –for the first pension pillar- Latvia and
Poland), and developing a funded second pillar (many new member states such as the Czech republic, the Slovak republic, Poland, Hungary, and old member states as Sweden and Belgium). The paper claims that a comparison of pension spending projections of the EPC in 2001 with those of 2006 shows that reform in 5 years have managed to cut back more than a third of the impact of ageing, and this despite the fact that the magnitude of the ageing process has increased (footnote 2, page 2). Zaidi et al. (op.cit.) project that the benefit ratio will fall by more than 20% on average over the next 50 years. This decline ranges between 1% in Spain, and 57% in Poland, and is 23% in France and 7% in Belgium (table 3, p. 19). The paper then enters into a preliminary and very prudent simulation of effects of these reforms on poverty. It plots the risk of poverty against public pension generosity (Figure 1 to 3, page 49-50). This relation is of course negative and stronger for women than for men, because women less often work and have fewer
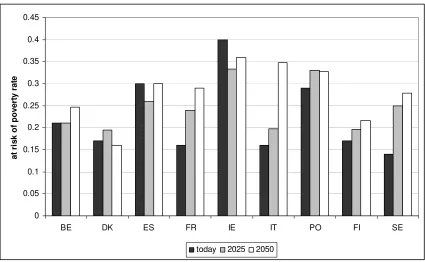
other sources of income after retirement. Furthermore, it is stronger for older pensioners, because of the larger lag between their pensions and earnings. The countries where generosity is to decline significantly, obviously would see the poverty risk increase, especially after 2025 (see Table 17, 52). The increase of the poverty risk rate would be limited in Belgium, but rates would almost double in France, Italy, Latvia and Sweden. The next figure shows some results for a selection of countries.
Figure 7: the development of the risk of poverty of the 65+ population.
0 0.05 0.1 0.15 0.2 0.25 0.3 0.35 0.4 0.45
BE DK ES FR IE IT PO FI SE
a
t r
isk o
f
p
o
ve
rt
y r
a
te
today 2025 2050
Source: Zaidi et. al., 2006, Table 17, 52.
Figure 8: at risk of poverty for pension recipients relative to other groups in Belgium 0 .1 .2 .3 .4 .5 he ad c ou nt r a ti o F G T (0 )
2000 2010 2020 2030 2040 2050
simulation year
Only earnings Only pension benefits Earnings and pension benefits
Source: MIDAS Belgium - own calculations.
Incidence of poverty
Source: Dekkers et.al., 2008.
Figure 9: at risk of poverty for pension recipients relative to other groups in Italy
0 .1 .2 .3 .4 he adc ou n t r at io F G T (0 )
2000 2010 2020 2030 2040 2050
simulation year
Only earnings Only pension benefits
earnings and pension benefits
Source: MIDAS Italy - own calculations.
[image:22.612.96.487.422.658.2]For the largest part, however, it is the result of proportional changes in household composition (two-earner households relative to one-earner households), the linkage between wages and pensions (in conjunction with changing average age of pensioners), and –especially for women- increasing labour market participation. For comparison, Figure 9 contains the comparable figure for Italy.
The incidence of poverty among households receiving only pension benefits increases in Italy. This is because benefits are no longer indexed to wage growth in the NDC.
7. Conclusions
The question whether the elderly run a higher risk of poverty than the active population, does not seem to be an easy one to answer. When the ‘risk of financial poverty’ of the elderly is compared to that of the active population, then the answer is univocally ‘yes’ for Belgium and for anglo-saxon and southern-European member states, but ‘no’ for new member states (at least in the years of which data is available).
Furthermore, controlling for other factors in most cases reduces age-related variables to non-significance in most countries. Finally, there are indicators that not including financial wealth in the assessment may overestimate the poverty risk of the elderly. Property income, finally, may have a limited impact on the position of the elderly, but this might change in the future.
If poverty is approached as ‘material deprivation’, then the position of the elderly is the same or even better than that of the active population. Only in terms of social
participation are the elderly in a more problematic situation.
This paper also considers the health position of the elderly. The broad conclusions are that there seems evidence of a North-South gradient within Europe, and that women – although having a higher life-expectancy- have a worse health than men.
as women and the oldest old, are the categories of concern. Furthermore, differences between countries are more important than differences between age categories over countries.
References
Barnay, Thomas, Thierry Debrand, 2006, Effects of health on the labour force participation of older persons in Europe, Health Economics Letter, No 109. http://www.irdes.fr/EspaceAnglais/Publications/IrdesPublications/QES109.pdf
[31/10/2008]
Blanchet, Didier, Thierry Debrand, 2007, Aspiration à la retraite, santé et satisfaction du travail: une comparaison européenne, Institut de Recherche et documentation en
economy de la Santé IRDES, working paper, 1, February 2007.
http://www.irdes.fr/EspaceRecherche/DocumentsDeTravail/DT1AspirationRetraite.pdf
[31/10/2008]
Böhnke, P., 2001, Reporting on Social Exclusion: Standard of Living and Social
Participation in Hungary, Spain, and Germany, Welfare in Europe-Euromodule, working
paper FS III 01-407, Wissenschaftzentrum Berlin für Sozialforschung
Börsch-Supan, Axel, 2007, European welfare state regimes and their generosity towards the elderly, MEA-paper 128-2007, Mannheim Research Institute for the Economics of
Ageing.
Brown, Robert, Steven Prus, 2003, Social Transfers and Income Inequality in Old-age: a multi-national perspective, SEDAP Research Paper No. 109, September 2003.
http://ideas.repec.org/s/mcm/sedapp.html [31/10/2008]
Browning, Martin, Thomas Crossley, 2001, The life cycle model of consumption and saving. Journal of Economic Perspectives, 15(3), 3-22.
Cherchye, Laurens, Bram de Rock, Frederik Vermeulen, 2008, Economic Well-being and poverty among the Elderly: an analysis based on a collective consumption model. Center
for Economic Studies Discussion Paper Series, 08.07, Katholieke Universiteit Leuven, Department of Economics.
Dang, Thai-Thanh, Herwig Immervoll, Daniela Mantovani, Kristian Orsini and Holly Sutherland, 2006, An Age perspective on economic well-being and social protection in nine OECD countries, OECD Social, employment and migration working papers,
DELSA/ELSA/WD/SEM/(2006)3.
Dekkers, Gijs, 2003, Multidimensionele armoede in België, Tijdschrift voor Sociologie,
Dekkers, Gijs, 2004, Financial and Multidmensional poverty in European countries: can the former be used as a proxy of the latter? Paper prepared for the 28th general
conference of the International Association for Research in Income and Wealth, Cork, Ireland, August 22-28, 2004.
Dekkers, Gijs, 2008, Are you unhappy? Then you’re poor! Multidimensional poverty in Belgium, International Journal of Sociology and Social Policy, vol. 28 (11/12)
Dekkers, Gijs, Annelies Debels, 2007, Genre, pensions et pauvreté : une comparaison Belgique – Pays-Bas. In : Legros, F., (ed.) Les Retraites. Libres opinions d’experts européens. Paris : economica.
Dekkers, Gijs, Florence Legros, 2008, Models for policy support on the impact of pensions: bringing ‘consumers’ and ‘producers’ together. Introductory paper presented
at the workshop of the same name, Centre for European Policy Studies, Brussels, September 25th, 2008.
Dekkers, Gijs, Hermann Buslei, Maria Cozzolino, Raphael Desmet, Johannes Geyer, Dirk Hofmann, Michele Raitano, Viktor Steiner, Paola Tanda, Simone Tedeschi, and Frédéric Verschueren, 2008, What are the consequences of the AWG-projections for the adequacy of social security pensions? An application of the dynamic micro simulation model MIDAS for Belgium, Italy and Germany, ENEPRI, Report of the Work
Package 4 of The AIM project.
EHEMU - European Health Expectancy Monitoring Unit, 2006, Estimations of health expectancy at age 65 in European Union countries in 2004, EHEMU Technical report 2006, 2,
http://ec.europa.eu/health/ph_projects/2003/action1/docs/2003_1_08_rep3b_en.pdf
[31/10/2008]
Engen, Eric, William Gale, Cori Uccello, 2004, Lifetime Earnings, Social Security Benefits, and the adequacy of Retirement Wealth Accumulation, CRR WP 2004-10,
Center for Retirement Research at Boston College.
EC (2006) The impact of ageing on public expenditure: projections for the EU-25 Member States on pensions, health care, long-term care, education and unemployment transfers, European Economy Special Report, n. 1/2006.
Eschtruth, Andrew, Wei Sun, Anthony Webb, 2006, Will reverse mortgages rescue the baby boomers?, Center for Retirement Research at Boston College, an issue in brief,
2008, no 8-12.
Fischer, Jonathan, David Johnson, Joseph Marchand, Timothy Smeeding, Barbara Boyle Torrey, 2007, No place like home: older adults and their housing, Journal of
Guio, Anne-Catherine, 2005, , Material Deprivation in the EU, Statistics in Focus, No.
21, European Communities, Brussels.
Gruber, J., D. Wise, 2004, Introduction, in Gruber J and Wise D (Eds.) Social Security Programs and Retirement around the world: micro-estimation, Chicago: the University
of Chicago Press, 1st ed, 1-41.
Hallberg, Daniel, 2006, Cross-national differences in income poverty among Europe’s 50+, Uppsala Universitet, department of economics, Working Paper 2006, no 14.
High Council of Finances (Hoge Raad voor de Financiën), (2008), Annual report of the Study Committee on Ageing (Jaarlijks verlag van de Studiecommissie voor de
vergrijzing), Brussels.
Hurd, Michael, 1990, Research on the Elderly: economic status, retirement, and consumption and saving, Journal of Economic Literature, 28, 565-637.
Jamet, Stéphanie, 2007, Combating poverty and social exclusion in France, OECD
Economics Department working papers No 569.
G. Jehoel-Gijsbers & C. Vrooman, 2008, Sociale uitsluiting in Nederland en Europa. In: SCP, Betrekkelijke betrokkenheid; studies in sociale cohesie, Sociaal en Cultureel
Rapport 2008, p. 234-258. Den Haag: Sociaal en Cultureel Planbureau.
Kalwij, Adriaan, Frederic Vermeulen, 2005, Labour Force Participation of the Elderly in Europe: the importance of being healthy, IZA DP, No 1887.
Kangas, Olli, Joakim Palme, 2000, Does social policy matter? Poverty cycles in OECD countries. International Journal of Health Services, vol. 30, no 2, 335-352.
Munnell, Alicia, Mauricio Soto, 2008, The housing bubble and retirement security,
Center for Retirement Research at Boston College, an issue in brief, 2008, no 8-12.
Short, Kathleen, and Patricia Ruggles, 2004, Accounting for Net Worth in Measuring Poverty, paper prepared for the 28th General Conference of the International Association
for Research in Income and Wealth, Cork, Ireland, August 22-28, 2004.
Sierminska, Eva, Andrea Brandolini, Timothy Smeeding, 2007, Cross-national
comparison of income and wealth status in retirement: first results from the Luxemburg Wealth Study (LWS), Center for Retirement Research at Boston College, CRR WP
2007-3.
Spicker, Paul, 2001, Cross-national comparisons of poverty: reconsidering methods.
International Journal of Social Welfare, vol. 10, 153-163.
Sue Alan, Kadir Alatay, Thomas Crossley, 2007, The Adequacy of Retirement Savings: subjective survey reports by retired Canadians, SEDAP Research Paper No. 199, May 2007.
Tsakloglou, P., Papadopoulos, F. (2002), “Aggregate Level and determining Factors of social exclusion in Twelve European Countries”, Journal of European Social Policy, Vol.
12, No 3, pp. 211-225
Williamson, James, Smeeding, Tim, 2004, Sliding into Poverty? Cross-National Patterns of Income Source Change and Income Decay in Old Age, CRR WP 2004-25, Center for
Retirement Research at Boston College.
Zaidi, Asghar, 2006, Poverty of Elderly People in EU25, European Centre for Social Welfare Policy and Research, Policy Brief, August 2006.
http://www.euro.centre.org/detail.php?xml_id=730 [24/10/08]
Zaidi, Asghar, Marin, Bernd, and Fuchs, Michael, 2006, Pension Policy in EU25 and its possible impact on Elderly Poverty. Second Report, July 10th, 2006, European Centre for
Dr. Gijs J.M. Dekkers (1967)graduated cum laude in economics at Maastricht