http://dx.doi.org/10.4236/ajibm.2014.43023
How to cite this paper: Zhu, J.H. and Liu, S. (2014) SOM Network Based Clustering Analysis of Real Estate Enterprises. American Journal of Industrial and Business Management, 4, 167-173. http://dx.doi.org/10.4236/ajibm.2014.43023
SOM Network Based Clustering Analysis of
Real Estate Enterprises
Jinhong Zhu, Sheng Liu*
School of Management, Shanghai University of Engineering Science, Shanghai, China Email: [email protected], *[email protected]
Received 27 January 2014; revised 27 February 2014; accepted 6 March 2014
Copyright © 2014 by authors and Scientific Research Publishing Inc.
This work is licensed under the Creative Commons Attribution International License (CC BY). http://creativecommons.org/licenses/by/4.0/
Abstract
For Real Estate industry which has many types of enterprises, how to carry on the effective clus-tering analysis has become a problem that needs to solve. This paper first theoretically elaborates the SOM network, and then pretreats the data with SOM network, which has the ability to deal with the high dimensional and complex data. Finally it uses the clustering function of SOM neural net-work to make clustering analysis and comparison of Real Estate companies which are listed in Shanghai and Shenzhen stock market. The clustering analysis results based on SOM are displayed in two-dimensional graphics, showing intuitively and comprehensively of the financial situation of each enterprise.
Keywords
Real Estate Enterprises; Financial Situation; SOM Neural Network; Clustering Analysis
1. Introduction
In recent years, the Real Estate Enterprises in China is affected by domestic and international external environ-mental factors as an important mainstay of the market economy, such as changes in market, the economic envi-ronment, social and cultural environment and policy changes. All these ever-changing factors are difficult to accurately predict that they inevitably bring about a direct or indirect impact on the financial management of Real Estate Enterprises [1]. These factors have a profound impact on companies when they deal with various fi-nancial relationships and activities. There are uncertain differences between fifi-nancial incomes and expected in-comes which have had a significant impact on the survival, profitability and sustainable development of the en-terprises. Nowadays, China’s Real Estate Enterprises are in a very competitive market environment of both do-mestic and international arena with the growing competition in dodo-mestic and international market and the
creasing complexity of the market competition environment [2].
Development of enterprises has a certain periodicity and the Real State Enterprises are no exception. They also experience the development cycle of production, development, prosperity and recession. The cycle of na-tional economic development and the level of it have a great influence on Real Estate Enterprises. Business in-vestment is still lacking in normative behaviors in China’s Real Estate Enterprises because of the late start of China’s Real Estate industry [3]. They are facing with a series of financial risks with suffering from the changes of global economic environment and the impact of domestic macro-control policies and other factors. Financial risk management and control apparently have become significant problems in the process of Real Estate Enter-prises’ development [4].
Real Estate industry is a typical capital-intensive industry which needs to invest a lot of money. With the con-tinuous improving cost of land and construction, the long period of Real Estate projects’ exploit, the long time capital takes up and the poor ability to adjust projects, you need to invest a lot of money to operate. Some Real Estate developers are lacking in awareness of the financial budget analysis. They don’t have a full analysis of the budget or in-depth investigation and study on the cost of land, financial operations, economic rate of return and other issues which the Real Estate development projects are facing. They have declinational judgment on the priority of use of funds, and are lack of overall planning for the use of the entire project funds, thus causing blind operation on funds management. Some developers are lack of planning for borrowing. They apply for ex-cessive loan to banks which is beyond the ability of themselves or borrow big money from other companies. All these increase the financial risks of Real Estate Enterprises [5].
As the global economy continues to grow and prosper, the enterprise financial evaluation system needs faster and more accurate processing ability on huge data. The improvement and integration of artificial intelligence method is the mainstream trend of the current financial evaluation methods. Numerous studies show that the neural network has relatively strong predictive ability and a high prediction accuracy rate in financial early war- ning. The clustering function of SOM neural network makes a variety of models cluster automatically in accor-dance with certain distances. Thus, it does not require the training sets that other clustering methods need and avoids the subjective interference of classification. The clustering analysis forms richer classes of species and provides a feasible technical method of analysis and evaluation of financial situation which is comprehensive and structured [6].
2. SOM Neural Network
According to the study in biology, in many living organisms’ pallium, a part of input signals of neurons are from the sensory organization or the external input signals of other areas, while the other parts are from the feedback signals of the same region. The weighted sum of the input signals received by each neuron has a function of feature detection, and the lateral feedback connections has a function of excitation or inhibition, which depends on the different distance with each neuron [7]. Teuvo Kohonen put forward self-organization mapping network model in 1981 according to this characteristic of biological neurons. He thought that neurons which are in dif-ferent regions of space have difdif-ferent division of labor, and a neural net will be divided into difdif-ferent response areas while each area has a different response characteristic when to accept outside input mode. Self-organiza- tion mapping network is a kind of classification method of unsupervised learning [8]. It can avoid some disad-vantages which the traditional clustering methods are difficult to overcome, and can use its strong learning func-tion and good self-organizafunc-tion, adaptive and robustness to provide informafunc-tion processing methods for the study on nonlinear classification, which has been successfully applied to the spatial pattern recognition problems, text clustering, natural language processing and many other research fields [9].
with other types of neural networks is: it reflects the classification results not by the state vector of a neuron or a network, but by a number of neurons simultaneously (in parallel). This kind of feature mapping neural network makes it possible for the space distribution of connection weights vector to reflect the input mode’s statistical characteristics by iterative learning of the input mode [11].
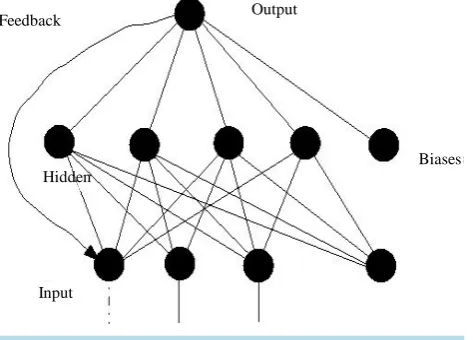
SOM network is composed of input layer and output layer. Each neuron in the input layer connects with every neuron in the output layer by weights. The input layer neurons are arranged in a one-dimensional form, and the number of input neurons is determined by the number of components in the input vectors [12]. The output layer neurons are generally arranged in a one-dimensional or two-dimensional form, as shown in Figure 1.
The training process of SOM algorithm is divided into 5 steps:
1) Establish networks according to the dimensions and the number of training samples, and give small weights to connection weights of M input neurons to the output neurons and complete the initialized weight ma-trix W [13];
2) Set the input space is of dimension m: X =
[
X X1, 2,Xm]
;3) Calculate the Euclidean distance between the input samples and each output neuron j:
( )
( )
21 n
j j i ij
i
d X W X t W t
=
= − =
∑
− ( )
( )
j j i ij
d = X−W =X t −W t
Select the best matching unit which has the minimum distance of neurons. And the weight of the node j is:
1, 2, 3, ,
j j j j jm
W = W W W W ;
4) Determine the area function, and correct the weight according to the type below:
(
1)
( ) ( )
( )
( )
ij ij i ij
W t+ =W t +η t X t −W t
Among them, η is a gain which declines to zero gradually with time, and generally η
( )
t =0.2 1⋅ −(
t)
or( )
t 0.2 1(
t1000)
η = ⋅ −
5) Normalized output:
(
min)
k j
O = f X−W
[image:3.595.198.435.543.713.2]In the training process, the neurons participate in each other’s competition, and the neuron node which has a maximum output is the winner. The winning node has the capacity to restrain other competitors and activate its neighboring nodes. But because only the winning node is the best match to the input graphs, only the winner is allowed to output, and only the weights of the winner and its adjacent nodes are allowed to be adjusted [14]. That is to say SOM network imitates the distribution of the input graphs, or to say it can extract the characteris-tics of the input graphs, and classify the input graphs according to the similar characterischaracteris-tics, representing by a
Figure 1. SOM network structure.
Feedback Output
Biases
winning node [15].
From the above discussion that, the space distribution of neural weight vectors can reflect the statistical cha-racteristics of input vectors for the trained self-organization mapping network.
This paper explores the self-organizing mapping network model which is in the application of the Real Estate enterprise financial analysis, and classifies the Real Estate companies’ financial condition according to cluster-ing analysis by SOM model and the actual data. The validity of the model is verified by experimental results which are satisfactory.
3. Clustering Indexes Selection
This paper uses financial indexes of Real Estate companies which are listing in Shanghai and Shenzhen stock market to research financial situation of them. The rational and scientific financial risk indexes play an impor-tant role in description of financial situation of a company. Quantitative indexes include the cash flow capacity, solvency, profitability, operation ability, development capacity [16]. Among them, the cash flow capacity is mainly used to reflect the cash flows that brought by business operating activities of enterprises [17]; Solvency is the ability of companies to repay all kinds of maturing debt that can be divided into short-term solvency and long-term solvency [18]; Profitability is company’s ability to obtain profits, reflecting the company’s operating performance and financial structure [19]; Operation ability refers to an enterprise’s capability of configuring and using its limited resources; Development capacity refers to the enterprise’s prospect, trend and potential of its production and business operation activities in the future [20].
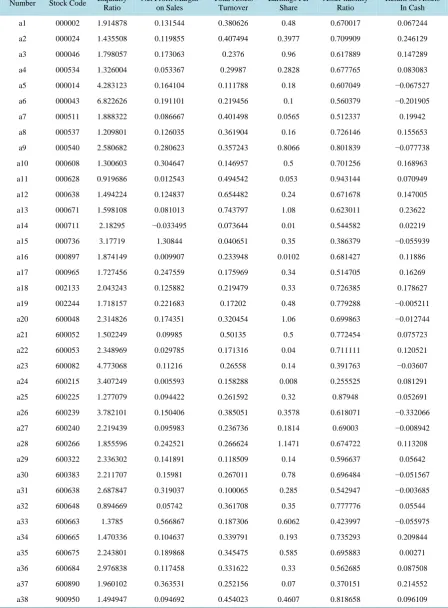
This paper selects 6 financial risk indexes in order to make a comprehensive analysis on the financial condi-tion of Real Estate Enterprises, as shown in Table 1.
4. Experiment and Result Analysis
This paper selects the Shanghai and Shenzhen listed Real Estate companies of the 27 financial indexes, and data as of June 30, 2013.
The main parameter settings of SOM clustering algorithm are as follows:
1) Input layer: The input layer parameters are the 6 indicators and 38 stock codes of Real Estate companies which are listed, summing to data of 6 × 38. As neural network training samples, the value is entered after deal-ing with the normalized can increase the area of the change, which greatly improves the traindeal-ing of convergence [21]. Conversion of essential data is as following:
min
max min
i i
b α α
α α
− =
−
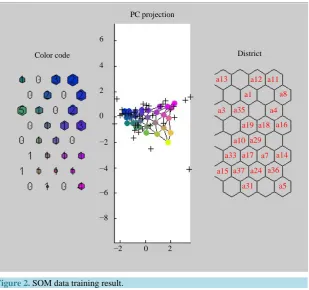
2) Output Layer: The output layer is a two-dimensional plane space, constituted by four neurons (2 * 2). 3) Use Matlab to deal with data, and the clustering result is shown in Figure 2.
As shown in Figure 2, the enterprises whose ticker symbols are in the first and second layer develop more balanced, especially the ability to grow. And their profitability is the strongest. They are worth the investment because of their high safety degree of debt loans and preferable financial flexibility. The enterprises whose tick-er symbols are in the third and fourth laytick-er can be a small investment because they are mainly distributed to high security degree of creditor’s rights and their operational efficiency and solvency are in general. The enterprises whose stock codes are at Layer 5 and Layer 6 can be an appropriate investment because of their general profita-bility and growth aprofita-bility. And they have higher solvency and a higher level of debt loans security. The enter-prises whose stock codes are at Layer 7 and Layer 8 are overall the worst. They can be appropriate investments; ticker symbol in the fifth floor of the company’s overall worst. They have the poorest profitability, growth abil-ity and financial flexibilabil-ity although their debt paying abilabil-ity is in general. So they are recommended not to be invested.
5. Conclusion
Table 1. Financial analysis index system of real estate enterprises.
Number Stock Code Liquidity Ratio
Net Profit Margin on Sales
Total Assets Turnover
Earnings Per Share
Asset-liability Ratio
Return on Assets In Cash
a1 000002 1.914878 0.131544 0.380626 0.48 0.670017 0.067244
a2 000024 1.435508 0.119855 0.407494 0.3977 0.709909 0.246129
a3 000046 1.798057 0.173063 0.2376 0.96 0.617889 0.147289
a4 000534 1.326004 0.053367 0.29987 0.2828 0.677765 0.083083
a5 000014 4.283123 0.164104 0.111788 0.18 0.607049 −0.067527
a6 000043 6.822626 0.191101 0.219456 0.1 0.560379 −0.201905
a7 000511 1.888322 0.086667 0.401498 0.0565 0.512337 0.19942
a8 000537 1.209801 0.126035 0.361904 0.16 0.726146 0.155653
a9 000540 2.580682 0.280623 0.357243 0.8066 0.801839 −0.077738
a10 000608 1.300603 0.304647 0.146957 0.5 0.701256 0.168963
a11 000628 0.919686 0.012543 0.494542 0.053 0.943144 0.070949
a12 000638 1.494224 0.124837 0.654482 0.24 0.671678 0.147005
a13 000671 1.598108 0.081013 0.743797 1.08 0.623011 0.23622
a14 000711 2.18295 −0.033495 0.073644 0.01 0.544582 0.02219
a15 000736 3.17719 1.30844 0.040651 0.35 0.386379 −0.055939
a16 000897 1.874149 0.009907 0.233948 0.0102 0.681427 0.11886
a17 000965 1.727456 0.247559 0.175969 0.34 0.514705 0.16269
a18 002133 2.043243 0.125882 0.219479 0.33 0.726385 0.178627
a19 002244 1.718157 0.221683 0.17202 0.48 0.779288 −0.005211
a20 600048 2.314826 0.174351 0.320454 1.06 0.699863 −0.012744
a21 600052 1.502249 0.09985 0.50135 0.5 0.772454 0.075723
a22 600053 2.348969 0.029785 0.171316 0.04 0.711111 0.120521
a23 600082 4.773068 0.11216 0.26558 0.14 0.391763 −0.03607
a24 600215 3.407249 0.005593 0.158288 0.008 0.255525 0.081291
a25 600225 1.277079 0.094422 0.261592 0.32 0.87948 0.052691
a26 600239 3.782101 0.150406 0.385051 0.3578 0.618071 −0.332066
a27 600240 2.219439 0.095983 0.236736 0.1814 0.69003 −0.008942
a28 600266 1.855596 0.242521 0.266624 1.1471 0.674722 0.113208
a29 600322 2.336302 0.141891 0.118509 0.14 0.596637 0.05642
a30 600383 2.211707 0.15981 0.267011 0.78 0.696484 −0.051567
a31 600638 2.687847 0.319037 0.100065 0.285 0.542947 −0.003685
a32 600648 0.894669 0.05742 0.361708 0.35 0.777776 0.05544
a33 600663 1.3785 0.566867 0.187306 0.6062 0.423997 −0.055975
a34 600665 1.470336 0.104637 0.339791 0.193 0.735293 0.209844
a35 600675 2.243801 0.189868 0.345475 0.585 0.695883 0.00271
a36 600684 2.976838 0.117458 0.331622 0.33 0.562685 0.087508
a37 600890 1.960102 0.363531 0.252156 0.07 0.370151 0.214552
Figure 2. SOM data training result.
fault tolerance. All these make classification of intelligent available, and lead to satisfying results. Seen from the interior of Real Estate companies that you can realize the changes of financial situation of these companies in a timely manner, and compared with other scale-like enterprises, you can avoid the stagnation of various projects caused by the capital chain rupture in order to avoid the crisis of bankruptcy. Seen from an external perspective at all levels of the companies that the majority of shareholders can buy stocks according to the hierarchy of Real Estate Enterprises’ financial condition to avoid the potential risk of loss caused, Banks can use this model for credit control of Real Estate Enterprises, which not only can reduce the risk of loans, but also laid the foundation for the stable operation of the national economy. In addition, external auditors can narrow the scope of audit ob-jects and develop targeted audit procedures, thereby improving their ability to assess and reducing audit risks.
Funding
This work is supported by the National Natural Science Foundation of China (NO. 61075115) and Innovation Program of Shanghai Municipal Education Commission (Grant No. 12ZZ185).
References
[1] Shanghai Real Estate Research Institute Comprehensive Research Study (2009) China’s Housing Price to Income Ratio Study: House Prices Fall, First-Tier Cities Are Still on the High Side.
[2] Tang, J.T. (2011) Commercial Bank Credit Risk under the Tight Real Estate Policy Thinking. Economic Research Guide.
[3] Kohonen, T. (1990) The Self-Organizing Maps. Proceedings of the IEEE, 78, 1464-1480.
http://dx.doi.org/10.1109/5.58325
[4] Li, G.Z. and Liu, T.Y. (2006) Feature Selection for Bagging of Support Vector Machines. Lecture Notes in Computer Science. Springer Verlag, Berlin, 271-277.
[5] Fitz, P. (1932) A Comparison of Ratios of Successful Industrial Enterprises with Those of Failed Firms. Certified Pub-lic Accountant, October, November, and December.
[6] Li, Q. and Yu, P. (2012) Main Methods Comparative Research on the Financial Crisis Prediction. Application of Stati- stics and Management, 7, 689-706.
PC projection
Color code 6
4
2
0
−2
−4
−6
−8
a13
District
−2 0 2
a1 a12 a11
a8
a3
a7 a4 a35
a5 a19 a18 a16
a10
a33 a17 a29
a14
a15 a37 a24
[7] Bai, T. (2009) Commercial Bank Risk Management Practices. China Finance Publishing House, 1, 34-39.
[8] Xin, L. and Gao, J.L. (2012) Commercial Bank Risk Management Practices. Business Accounting.
[9] Xiao, Q., Qian, X.D. and Liao, H. (2012) Clustering Algorithm Analysis of Web Users with Dissimilarity and SOM Neural Networks. Journal of Software, 7, 11.
[10] Li, X.H. (2012) EVA Enterprise Early Warning Index System of Comprehensive Analysis of the Building. Modern Commerce. 32.
[11] Zhao, J.X. and Du, Z.P. (2009) Based on the Combination of Neural Network and Decision Tree of Credit Risk As-sessment Model. Journal of Beijing Institute of Technology, 2009, 2.
[12] Wen, X.C. (2012) Enterprise Financial Crisis Warning Research Trend. Modern Commerce, 36.
[13] Boyacioglu, M.A., Kara, Y. and Baykan, O.K. (2009) Predicting Bank Financial Failures Using Neural Networks, Sup- port Vector Machines and Multivariate Statistical Methods: A Comparative Analysis in the Sample of Savings Deposit Insurance Fund (SDIF) Transferred Banks in Turkey. Expert Systems with Applications, 36, 3355-3366.
[14] Wu, A.M. (2013) Credit Policy Effect of Real Estate and Commercial Bank Management Innovation Research. South- west Finance.
[15] Nie, H. (2013) China’s Commercial Banks, Financial Crisis Early Warning Mechanism Research. Accounting Finan-cial.
[16] Bao, X.Z., Wu, P. and Zhou, Y. (2012) Based on Clustering and Grey Correlation Analysis of the Financial Early- Warning Index Screening Study. Chinese Certified Public Accountant.
[17] Ma, D.S., Ye, Z.R. and Hu, J.Z. (2013) Financial Audit in Our Country the Construction of Early Warning Index Sys-tem and Index. Modern Finance and Economics, 2013, 1.
[18] Von, P.G. (2009) Asset Prices and Banking Distress: A Macroeconomic Approach. Journal of Financial Stability, 2009. http://dx.doi.org/10.1016/j.jfs.2009.01.001
[19] David, W.B. (2010) US Higher Education and Current Recession. International Higher Education, 55, 2.
[20] Zhang, R.Y., Zhang, A.W. and Huang, S.S. (2013) The Establishment of the Company’s Financial Risk Evaluation In-dex System. Finance and Accounting Monthly, 3.