Composite and decomposable indicators
for evaluating RIA systems in practice:
proposals for discussion and testing
de Panizza, Andrea
European Network for Better Regulation – ENBR
2007
Online at
https://mpra.ub.uni-muenchen.de/13069/
ENBR Working Paper
No. 09/2007
COMPOSITE
&
DECOMPOSABLE
INDICATORS
FOR
EVALUATING
RIA
SYSTEMS
IN
PRACTICE
ANDREA DE PANIZZA
ISTAT
C
OMPOSITE&
DECOMPOSABLE INDICATORS FOR EVALUATINGRIA
SYSTEMS IN PRACTICEProposals for discussion and testing
*Andrea de Panizza
(Istat)
Abstract
The spread in the adoption of RIA, sponsored by international organisations, will hopefully result also in an increase of its usage, by countries other than the few ones (mostly of Anglo-Saxon/common law tradition) where it is established since long. This, in turn, would render factual comparison of RIA national practices an exercise both meaningful and desirable, in particular for eliciting specific areas and pathways for improvement. This paper proposes a first attempt for the development of a statistical tool where basic measures and/or tests (i.e. individual indicators) are organised and grouped in composite indices addressing different dimensions within RIA. The latter can be variously combined, resulting also in more general, synthetic indicators, preserving the components’ constituent elements. Due to current limitations in information availability, weights for aggregation are left undetermined in practice; the same reason impacts on selection of elementary indicators and the shape of composites, so that appropriate methodologies ought to be applied to get to a fully operational stage. A derived frame is also proposed, limited to a monetary perspective on the overall performance of RIA national systems, by means of a handful of key indicators which are less dependent on issues of aggregation. The whole package should thus be considered as an input for discussion, to be amended and eventually refined by testing for robustness and stability, starting from the information which is being collected in the international DIADEM database developed within the European Network for Better Regulation project.
* Paper prepared from the presentation (with M. Visaggio) held at the ENBR Workshop on
Methodology, Erasmus University, Rotterdam - Dec. 14, 2006.
Introduction
Extensive usage of RIA in support of evidence-based (or at least informed)
policymaking is still limited to a few, mostly English speaking/common law based
countries. However, this situation is likely to change in the near future, in view of the
diffusion of the culture of governance and better regulation. This, favoured by the
Oecd and the World Bank, in the last decade resulted in the adoption of RIA principles
by a swiftly growing number of advanced economies and by some LDCs as well.
However, while the collection and analysis of comparable information on governance
and regulation at the international level is by now advanced, the development of
statistical tools for comparing the working of national RIA systems – at this point both
meaningful and desirable to help improvements especially for ‘newcomers’ to RIA – it
is still in its infancy.1 An intense debate is already underway on good practices and key
dimensions to be addressed also by means of indicators, and a relevant effort is being
undertaken to collect comparable information, through the DIADEM database, on the
features of RIA systems across Eu countries. Most information available or easily
collectable on RIA practice, though, portrays specific characteristics and/or often
assumes a y/n form. Hence we need treating it somehow, if we wish to achieve a more
comprehensive view on the functioning of RIA systems.
This paper presents some suggestions on ways to organise information available (or
which will be available in the near future) and on additional data needs, outlining a
system of composite indicators for comparing RIA national systems on different
aspects of quality, usage and effectiveness. It also proposes a derived, smaller set of
key indicators targeting only the monetary dimension related to the usage of RIA. The
paper consists of this introduction and five sections: section 2 introduces the
1 With respect to regulation and governance at large and the development of (composite)
dimensions addressed in the analysis and the following discusses some general issues
and the approach adopted; Sections 4 and 5 present the two sets of indicators; the last
section draws some concluding remarks and topics for future research.
1.
Conceptualising RIA and identifying domains and variables for evaluation.
A reasonable first step in designing an indicator (even more so a system of indicators)
is to know what we want to track, and ask ourselves whether what we have at hand –
duly arranged and put in shape – can do the job, and which additional pieces of
information we might need.
In the case of the overall quality of RIA systems the concept is too wide to catch it
easily (though still partially) by a single measure, maybe complex to compute, like
GDP does for wealth. Hence, as the quality of RIA encompasses different dimensions,
it is useful to first outline its main features, and identify within them the most
important areas to be addressed by indicators.
To this end, drawing from contributions by various authors and of different nature,2
we can outline a conceptual framework for analysing RIA systems based on common
(chrono) logical macro-phases, identifying the three moments of input, outputs and
outcomes or, borrowing from an other area of research, distinguish amongst RIA
readiness, usage and impact,3 a quasi equivalent taxonomy, which allows adding to the
former also an intermediate step of process. It is worth noting that this is only one way
political stability and absence of violence, government effectiveness, regulatory quality, rule of law, and control of corruption.
2 Indirectly, it is rooted in works undertaken in other areas, such as the systematisation of
Policy Impact Analysis with specific reference to innovation proposed by Roberti (2006) and the author’s work on the development of a system of indicators for tracking the innovation policy process (de Panizza, 2006, from which some of the indicators proposed are derived). In a stricter sense, it builds on official reports and theoretical guidelines (including Mandelkern, 2001 and, subsequently, EC, 2005 and Oecd 2004a) as well as on previous analyses such as Oecd (2004b) and the few pathbreaking attempts at scorecards and indicators (Renda, 2006; Radaelli, 2003, Jacob et al. 2006, De Francesco and Radaelli, 2007, etc.) and the related design of the DIADEM database framework (Radaelli et al., 2006). The paper is also directly indebted to (long discussions with) M. Visaggio, who provided inputs to the design of many indicators, besides theoretical reflections on the quality components of RIA systems now reported in Visaggio (2007). I would also like to thank colleagues at the ENBR workshop for their comments and suggestions, as well as C. Radaelli for making available some published and unpublished works. Mistakes, of course, are only mine…
3 The so called “Oecd methodology” first proposed by Industry Canada and subsequently by
of looking at RIA, and that other, complementary or partly superposed perspectives
are possible and have been portrayed by different authors.4
Though very loose, this framework is helpful for identifying and positioning some still
general but more homogeneous aspects, i.e. the dimensions that we wish to address by
indicators. Along these lines – and taking stock both from previous works and the
information produced by DIADEM5 – under Readiness (or amongst inputs) we can
include both the resources available for RIA and the ‘possibility’ of acting, i.e. the fact
that we give a space to RIA within the public administration, creating some specific
departments, attributing them some functions/powers and establishing specific
procedures and appropriate guidelines. When it comes to RIA usage, this can be done
applying procedures and methodologies more or less properly under both a formal
and a substantial perspective. The output of this process is a certain production of
proposals, which again can be few or many, and of good or bad quality. Finally, RIA
proposals might impact differently on political choices, the economy, society and
institutions themselves. This will depend on a number of factors, including the
presence of built-in devices to improve the system’s quality and efficiency, such as
continuous evaluation (Table 1).
4 For instance, Jacob et al. (2006) distinguish process, content, and impact, as target areas for
indicators, while Visaggio (2007), whose conceptualisation was developed jointly with this one and is otherwise very similar, also points at the distinction between implementation and evaluation; with reference to empirical studies of ex post evaluation; instead, the Oecd (2004) identifies the dimensions of compliance, process and functions.
5 Though with some innovations which might demand the collection of specific information,
Table 1 – A taxonomy of RIA phases and related dimensions for analytical purposes
Phases Steps & alternative taxonomies
Domains /dimensions within each phase (to be targeted by indicators)
Readiness Æ Input
Resources (Financial, Human)
Legal Framework (degree of RIA compulsoriness in regulatory action, power of RIA Institutions, National Guidelines vs. International standards)
Usage
Æ Process
Æ Output
Compliance of individual RIAs to National/Intl Guidelines & ways of treating Information flows
RIA general properties (timeliness, etc.) and extensiveness of analysis
RIA results vs. forecasts (ex post
evaluation)
Impact
Æ Outcome
RIA (internal/external) cultural Impact (ex post
evaluation)
RIA (internal) impact on choices (ex post
evaluation)
RIA (external) economic Impact (ex post
evaluation)
As we shall see in the following, these aspects are not exhaustive, as others bridging
them might ask for consideration, or because there could be other dimensions which
would be identified as relevant while some of those mentioned above require further
specification or result less important conceptually or after testing, or for other reasons,
which might render borders between phases quite blurred, and the interpretation of (at
least some) indicators not straightforward.
2.
Issues and approach: composites and their lim ts
i
Having set some key dimensions for analysis, the next step consists in selecting and
manipulating the information required to build appropriate indicators for targeting
each of these ‘conceptual variables’. In practice, this implies first of all checking what
information is available or could be gathered in a cost effective way.
The focus here is on the DIADEM database, still in progress, but the information
available, though overabundant for certain items, is also fragmented and not
immediately suitable for the purpose, due to its qualitative nature, or y/n type as for
the case of tests.
Composite indicators are a possible way of addressing this problem, but a serious
(2006). Indeed, passing from individual (often qualitative dichotomous) indicators to
composites implies building a system of weights. This has an intrinsically subjective
nature, which demands data treatment and/or other forms of consensus to be
addressed and circumscribed, at least partly.
At present, while DIADEM would in any case not satisfy all information requirements,
there are not yet enough data readily available, nor any previous form of consensus
building could be performed, so the issue of aggregation cannot be dealt with on
practical grounds in this paper, but for a few examples and some referencing to
appropriate methodological solutions, leaving applications to future works. For this
and other reasons, the system proposed is to be regarded as highly tentative with
respect to interpretation. Indeed:
a) Quantitative techniques based on data that are not yet available are a basic tool
also for the selection of elementary indicators and their grouping;6
b) Some issues might lose relevance over time (say, for instance, formal
compliance to guidelines) while others would gain ground (say, measures of
outcome as the number of RIA becomes larger), so that the system is also
intrinsically evolutionary;
c) The interpretation can change according to the perspective of analysis,
considering that some indicators address different aspects of the RIA machine,
depending to the way we look at them (e.g., see below, diffusion);
d) Last but not least, what according to some indicators might appear as a bad (or
good) result, could not be such when we take into account other aspects: for
instance, a scarce compliance with respect to certain parameters might be due
to the fact that in a given country most RIAs do not address issues which,
indeed, do not need being addressed to work; besides, relationships are often
not stable over time nor the same for all countries.
6 An overview of issues and methodologies related to the selection of information, and the
construction and testing of composite indicators can be found in the joint JRC-OECD Handbook
In view of the above, and in order to allow a targeted approach to the evaluation of
RIA features, the system of indicators is conceived as open to additions, changes and,
especially, to the recombination of its components along different lines. This is
achieved by normalising data by setting a unique scale (usually from 0 to 1) for
indicators at different levels of aggregation, irrespective of the weights attributed to
each component, allowing for their use in isolation or in combination with others, and
by applying a common metrics based on percentage results vs. total and/or vs. best performer.7
3.
A frame of composites along the readiness-usage-impact taxonomy
4.1 Indicators of Readiness: resources and legal framework
At the root of RIA functioning there is its financing and, subsequently, the endowment
of human resources. In a strict sense this is an aspect of ‘quantity’ rather than ‘quality’.
However, the two issues are strictly intertwined and usually go together, and quantity
also can be a matter of comparison.
These aspects can be assessed by means of two sets of indicators, addressing
respectively funding and human resources attributed to RIA in quantitative (relative to
some general parameters which would allow comparison and relative to tasks) and
qualitative terms. These dimensions can also be merged to get thematic indicators and
a composite resource endowment index, as detailed in Table 2 hereunder.
7 This latter specification, when looking for a benchmarking-type result, presents two
Table 2 – Indicators on the endowment of resources
A) Financial Effort Index FEI = α1Financial res. Index + α2Consistency Index [where α1+α2=1]
a1) Financial resources index RIA expenditure vs. public Budget (or GDP); (% of highest
ranking)
a2) Consistency vs. objectives index RIA exp. vs. turnover of regulated sectors
(% of highest ranking)
B) Human Resources Index HRI = (HR Quantity index)*(HR Quality index)
b1) HR Quantity index HR in regulatory authorities vs. employment overall, or in businesses subject to control; (% of highest ranking)
b2) HR Quality index Adequate technical skills & balancing = sum of weights by staff expertise composition index (% of totals). An example with purely conventional distinctions among staff categories could be:
9 Administrative staff < X% = β1 (else =0)
9 Technical staff from regulated industries > Y1% = β2 (else
=0)
9 Technical staff – economists > Y2% = β3 (else
=0)
9 Technical staff – engineers > Y3% = β4 (else
=0)
9 Technical staff – juridical > Y4% = β5 (else
=0)
[Where: Σβ=1 Σ(Υ, ; X) <1]
Resource Endowments Index REI = α (FEI)+ β (HRI) [where (α + β) = 1]
These indices are to be considered only a first approximation for testing and
refinement, for instance with respect to variables used as denominators of the ratios.8
Besides, other aspects might be included under the above headings. In particular, as
stressed by Jacobs (2006), adequate training of personnel is also a key determinant of
RIA (and of Human Resources) quality, so that Indicators of training might be computed
(complementary, or alternative to the HR quality index above), both with respect to
financial effort (amount of resources devoted to training/retraining) and to RIA
personnel (percentage of staff which underwent training/retraining).
Unfortunately, at present the collection of data for computing these indicators is
framework of DIADEM. As we shall see in the following, it is also worth noting that
the Financial Resources Index alone does provide a synthetic measure of input (though
within a purely monetary perspective), and that with some caution we can also
compute Efficiency Indices, as outputs (results from action)/inputs (or effort) ratios.
Besides resources, in the previous section another major area was identified as
contributing to RIA readiness under the heading of “Legal Framework”. This, primarily,
consists of the features and powers of RIA institutions, which arguably constitute
another basic aspect conditioning the working of RIA systems.
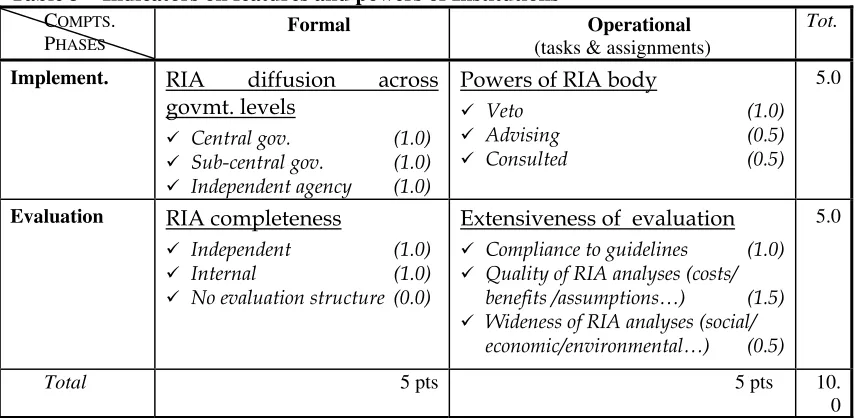
In table 3 hereunder we portray a (set of) composite Indicator(s) of Institutional
development, where the areas of implementation and evaluation are considered
separately and, within each of them, a formal and an operational dimension are
[image:11.595.80.508.353.562.2]distinguished.
Table 3 – Indicators on features and powers of Institutions
COMPTS. PHASES
Formal Operational (tasks & assignments)
Tot.
Implement. RIA diffusion across
govmt. levels
9 Central gov. (1.0)
9 Sub-central gov. (1.0)
9 Independent agency (1.0)
Powers of RIA body
9 Veto (1.0)
9 Advising (0.5)
9 Consulted (0.5)
5.0
Evaluation RIA completeness
9 Independent (1.0)
9 Internal (1.0)
9 No evaluation structure (0.0)
Extensiveness of evaluation
9 Compliance to guidelines (1.0) 9 Quality of RIA analyses (costs/
benefits /assumptions…) (1.5) 9 Wideness of RIA analyses (social/
economic/environmental…) (0.5)
5.0
Total 5 pts 5 pts 10.
0
The choice of phases and components presented in Table 3 is, of course, just one of the
possibilities, as well as the elementary indicators used can be questioned. Besides, for
sake of simplicity we let the value of the composite Indicator of overall Development of
Institutions (IDI) vary from 0 to 10 attributing identical weights (0 to 5) to the two
phases of implementation and evaluation, as well as to the formal and operational
components: different weightings can obviously be attributed to each component and
underlying indicators, and the field of variation of indices is to be rescaled on a 0 to 1
8 For example there might be some economies of scale in RIA, suggesting for a correction with
when proceeding to further aggregations. Finally, it is worth noting that sub-indices
could also be assembled along different lines: for instance, we could compute a side
indicator depicting RIA institutional strength, by putting together the two indicators for
the operational component and that for RIA completeness.
Legal framework conceptually includes also the compliance of national guidelines with
respect to international standards. However, as the same elementary indicators (tests) can
be used (performed) and composites built for tracking the compliance of RIA practice
to guidelines and to analyse individual RIA features, these aspects are treated together
in the next Para on indicators of usage. Finally, it is worth noting that, by applying the
same weighted average methodology, a composite Legal framework Index can be
computed by merging the dimensions of institutions with compliance to international
guidelines (see below), as well as an overall Index of Readiness, by putting together
resources and legal framework.
4.2 Indicators of usage (process and output): compliance to guidelines, properties and diffusion
of RIAs
When looking at the usage of RIA, an issue which has already been explored is that of
‘how’ the process is performed, i.e. of the (formal) compliance of RIAs to guidelines.
This is an area for which is information – although of a y/n type – is going to be
abundant, thanks to DIADEM. Under this heading we can consider the compliance of
RIA practice to national (and, indirectly, international) guidelines, as well as individual
RIA features and, as anticipated above, the correspondence of national to international
guidelines can be analysed by means of the same indicators, though as part of the legal
framework dimension.
Irrespective of which of these aspects we wish to examine, information on specific
items can be grouped around three main areas: a) the process of problem identification,
preliminary to RIA itself; b) the analytical options included into RIA; and c) the
procedures of consultation undertaken and related information flows from and to the
public.9 These areas and underlying items are described in Table 4.
9 It is worth stressing once again that, being the categories proposed subjective, other ways of
In the case of compliance too, composite indicators proposed are modelled in such a
way that their value, at any level of aggregation, can vary from 0 to 1: some
adaptations can be made, recomposing differently thematic indices and/or introducing
other elementary indicators for evaluating IA practices. For instance, with respect to
consultation, it could be worth considering whether it is conducted prior (+) or after (-)
detailed proposals, or compute a wideness of consultation index, which would consider
categories (stakeholders, experts, etc.) and phases of the decision making process
[image:13.595.82.508.248.743.2]involved.
Table 4 – Indicators of compliance
Problem identification and Impact Assessment preliminary framework index (Α) =Σ(αa)
(1) Identification of magnitude (a1)coeff.: (α1)
(2) Identification of causes (α2)
(3) Identification of baseline situation and trends (α3)
(4) Multi-tiered approach to IA (No=0; yes=0.5 or 1 if explicit criteria also stated) (α4)
(5) Description of incentives of interests affected (α51)
(6) State explicit reasons for IA (welfare maximisation / Cost minimisation) (α52)
Policy options index (Β) = ρΒ1+(1−ρ)Β2
(B1) IA Analytical features index Β1=Σ(β1xb)
(7) Articulate policy objectives as measurable outcomes (β11)
(8) Require alternative approaches to be considered (β12)
(9) Consider zero option (β13)
(10) Consider market solution (β14)
(11) Risk analysis (β15)
(12) Identification of parties affected by changes (1=all; 0.5= partial; 0 = no; β16)
(13) Identification of appropriate level of government (subsidiarity) (β17)
(B2) Extension of Policy options analysis index Β2=Σ(β2xb)
(14) Performance in terms of enforcement & compliance (β21)
(15) Administrative burden (β22)
(16) Impacts on competition (β23)
(17) Impacts on SMEs (β24)
(18) Other impacts (social, environmental, …) (β2i)
Stakeholders consultation and information Index (C) = Σ(γc )
(19) Consultation (1=mandatory; 0.5=suggested; 0 = no) (γ1)
(20) Scope of consultation (γ2)
(21) Prescription on timing (γ3)
(22) Prescriptions on method (γ4)
(23) Accessibility (free access by any member of the public) (γ5)
(24) Ways of considering & responding to consultation input (γ6)
(25) Transparency (Mandatory report on results) (γ7)
Where: Σα, Σβ, Σγ [0, 1]
The indicators of compliance proposed address the process of RIA implementation
from a formal perspective, but of course have to do with its capability to interpret
real-world dynamics. Another step in this direction is represented by indicators addressing
the way RIAs are undertaken and their outputs in terms of a set of desirable properties.
These include timeliness of the analysis, measurability of outcomes, proportionality of
effort,10consistency of key economic assumptions and forecasts with reality (ex ante and
ex post), transparency of the process and accessibility to the general public. A list of
possible indicators related to these properties is reported in Table 5 hereunder,
drawing from existing literature, using the opportunities offered by DIADEM or just
building them ex nihilo.
Table 5 – Indicators addressing RIA quality related properties
Timeliness: (1) RIAs performed before policy choice per country / body [%of, rescaled as (2)] (2) Months from initial proposal (rescaled on best performer)
Measurability: (3) Costs and/or benefits computed and compared (percentage of
individual IA)
Proportionality: (3) Net benefits of RIA superior to costs (RIA costs vs. estimated benefits of
proposal)
Consistency/accuracy: (4) Discount rate in line with market rates
(1 - average percentage distan
(5) Forecasted vs. real outcomes (only ex post, 1 - average percentage distance)
(6) RIA considering trade-off between objectives (percentage of)
Accessibility: (6) RIA published or available on request (percentage of) Transparency (7) RIA for which an executive summary is published (percentage of)
Quality properties Index (QPI) = weighted sum of individual indicators
Indicators in Table 5, irrespective of their being derived from simple tests or based on
quantitative information, in most cases require several practical problems being
addressed before usage. For instance, Timeliness indicator (2) ought to be corrected for
some measure of depth of analysis performed, else be dropped using only indicator (1);
further, Consistency indicator (5) depends crucially on the availability of monetary
forecasts as in indicator (3) for computation (a zero value, i.e. 100% distance, might be
attributed to those RIA which do not provide them), and so on.
10 In this case on substantial, not formal grounds as for the case of compliance indicators in
Passing from RIAs general properties to their features in terms of impacts considered,
we can follow the standard distinction between economic, social and environmental
impacts and, identifying a series of items within each of them, build synthetic
indicators for comparing RIA systems, in terms of the variables considered in each type
of impact assessment, the frequency with which certain impacts are considered, and
overall.
Table 6 - Indicators on RIA impact analytical dimensions and accuracy of estimates
Economic (a1) Competitiveness + (a2)SMEs +(a3)Investment + (a4)GDP + (a5)Trade + (a6)Inflation
+…
Social (b1) Health + (b2) safety +(b3) Employment + (b4) social inclusion + (b5) gender + (b7) …
Environmental (c1) renewable / non renewable resources+ (c2) Biodiversity +(c3) air & water quality
+…
Overall (OII) = δ1A + δ2B + δ3C Where Σa = Σb = Σc = Σδ= 1
All indicators are built in percentage of total RIAs; for comparative purposes they can be further rescaled with respect to best performing country/body)
Indicators in table 6 can be used also for ex-post evaluating whether impacts were
correctly estimated in each domain and for each variable considered, as indices of
consistency/accuracy (distance of estimates from real world dynamics), complementary
to those in table 5 above. However, it has to be reminded that this type of assessment
(as in Table 5) faces the issue of real world variability (aspects which could not be
forecasted when estimates were produced), that we shall not deal with here.11
When used for assessing overall RIA quality, we have to consider that indicators work
by attributing a higher value to RIAs including a larger number of variables and
different types of impact. This implies that they risk to vehicle a very poor information
content, as there is not a prescription common to all RIAs: for instance, should a RIA
on a proposal of regulation for bread-making consider environmental issues, and to
what extent? Hence, a less ambitious aim could be fixed, using the variables included
into each indicator as signposts, only to depict average degrees of
complexity/completeness of individual RIAs for each type of impact and for the whole
lot, and the overall average degree of complexity of RIAs in a given system, which, in
turn, can represent a weighting reference for assessing RIAs under other perspectives,
such as in terms of efficiency (see below).
11 A side indicator for assessment in this case might refer to whether an estimate was explicitly
Finally, usage as such means that RIA is an everyday practice. Hence, along with the
above aspects (and perhaps on top of them) we should also consider RIA diffusion
(Table 7).
Table 7 – Indicators addressing RIA diffusion
(1) Rough (general) Proposals undergoing RIA(percentage of/absolute number, rescaled on best performer) (2) Horizontal: Spread of RIA across different levels of government (see above, Institutions)
(3) Targeting ..with respect to highest ranking affairs (monetary/political impacts) (percentage)
Compound Vertical diffusion corrected for (2), (3) &/or others [(1)/(2, 3), normalised] In this line of thought, we can track the spread of RIA in general, 12 and/or weighted
(compound index) by taking into account also its diffusion across different levels of
government (horizontal), or by using other variables, such as compliance, in
depth/extensiveness of analysis, or relevance (targeting, as expressed by monetary or
political interests involved).13
It has to be observed that diffusion can also be interpreted as belonging to the
dimension of impact, when we consider it as a result of the break-through of the culture
of better regulation, and that RIAs themselves can contribute to it.
Finally, as for readiness, we could compute an Index of overall usage, by combining
indicators in tables 4-7 above.
4.3 Indicators of Impact / Outcome
Assessing the overall impact of RIAs on quantitative terms is the less explored and
most difficult issue. However, drawing from literature at large, we can identify at least
few, often intertwined aspects: the diffusion of RIA culture mimicked by
implementation, detailed above, usually leads to gains in RIA efficiency and in turn to a
higher effectiveness (Table 8).
12 Please note that computing the index as ‘percentage of’ requires a previous agreement on the
typology of normative acts to be considered for comparison. Alternatively, a rough version can be computed, as ‘absolute number of RIA rescaled on best performer’, in view of the fact that normative production might differ enormously between elsewhere similar countries, and at the same time be similar between large and small countries.
13 The Oecd (1999) remarks that – with respect to the change of policy focus by the OMB in the
Table 8 – Indicators addressing RIA Impacts /outcomes
Diffusion (see above);
Efficiency: (1) Rough: Unit cost of IAs, including indirect costs (UCI=€/IA) (2) Corrected: UCI weighted by indicators of intensity, compliance or relevance (UCI/PCI)
Effectiveness: (3) Normative: Regulation subject to RIA subsequently amended (percentage o
(4) Monetary: ex post gains (cost reduction/benefit increase) due to RIA (rescaled on best perf.)
(a): with respect to original proposals
(b) with respect to baseline situation
Overall Impact (OII) = normalised and weighted sum of (2), (3) and (4a), eventually including
diffusion
As for diffusion, the rough Indicator of efficiency needs being corrected to take into
account the complexity of RIAs undertaken. This can be done using indicators for
compliance (composite PCI, or some component indicators, such as those reflecting
policy options), for extensiveness of analysis, for relevance, or a mix of them: testing
for robustness and variability could be of great help for an appropriate choice.
With respect to effectiveness, instead, some normative and monetary indices were
defined and computed in empirical literature and by RIA authorities. The proposal
here is to extend monetary indices to baseline situations, and to study the relationship
between the two, which would provide a measure for RIA average impact (representing
an indicator of its focus, complexity, etc.).
An overall impact indicator can also be computed with the usual methodology, as well
as other indicators for tracking the Cultural impact, with respect to awareness (for
instance, by monitoring media coverage, or by ad hoc surveys on stakeholders and
policy-makers), participation (drawing on indices for consultation, and/or looking at
the development of the RIA approach by stakeholders themselves).
All in all, we have to warn that impact (or outcome) indicators, even when properly
designed, can be often tricky when interpreted. Jacobs (2006) provides a clear example
of this kind of issues, with respect to the fact that often RIA systems gain in efficiency
and effectiveness over time, so that a U shaped curve might be expected for the results
of implementation. Systems which are in place since long thus have a comparative
advantage on younger ones, and the results of the latter might be not only worse, but
appear also for other families of indicators, could be tackled by considering explicitly
the effect of time.14
4.
From simple to complex and back: key indicators for monetary evaluation
On purely abstract grounds, following the procedures outlined above (sum of
coefficients =1 etc.) we could put together composite thematic indicators and compute
indicators addressing different aspects or the whole RIA system, such as RIA =
a(Readiness) + b(Usage) + c(Impact), in the most comprehensive form. On the other side,
we might decide to monitor only some aspects / components, which are deemed to be
of particular relevance.
In this line of thought, we could focus on the monetary dimension of RIA, identifying a
sort of Quantitative backbone made up of a few key, headline indicators. These, based on
measurable aspects of RIA systems, would target each one of the phases of the
readiness-usage-impact taxonomy and suffer only in part of the limitations and
shortcomings which have been pointed out above with respect to composites.
Within this framework, the Financial Resources Index could be used for monitoring
readiness, the Compound diffusion Index (with weights based on monetary relevance) as
a synthetic measure of usage, and the Monetary Effectiveness Index (with respect to
original proposals) for tracking impact.15 Considering RIA as any production process,
we have resources fed into the RIA machine, which produces some outputs that, sold
on the market, are again transformed into money. This view allows also highlighting
the critical points in these transformations (i.e. how effectively inputs become outputs
and outputs money?), obtaining side indicators for efficiency and average value (Table 9).
14 This can be done: a) at the moment of computing the indicator, by treating a progressively
diminishing part of costs as a long run investment (i.e., imputing only a quota as amortisation), and b) in comparisons, by applying a correction factor, such as dividing results by the number of years (in absolute, log or other forms) since RIA implementation.
Table 9 – The quantitative backbone indicators addressing RIA monetary dimension
Stages Readiness Æ Usage Æ Impact
&Concepts Effort Diffusion Effectiveness
Key Indicators
Financial Resources Compound Diffusion (3)
Monetary Effectiveness (a)
Critical pts Efficiency Average value
We can then follow different roads, based on data availability and other
considerations. If we do not have information on the whole process, we might consider
that each indicator should roughly approximate the other two, and limit the field of
observation. Second, we might be able to monitor all stages, so that we can see how
efficiently money getting into the process is transformed into money coming out, and
analyse leakages by means of the side critical point indicators.
This approach, it has to be acknowledged, can be criticised under many respects.
Indeed, many of the warnings outlined in the above sections apply to this latter tool as
well. Besides, RIA is not only an issue of money in-money out; not all impacts can
easily transformed into monetary equivalents (what is the value of participation?)
and/or because in many cases results depend crucially on shadow values for
transformation. Summing up, this frame of headline indicators does not have to be
overemphasised on grounds of practical relevance and its usage requires caution; at
the same time, once amended and tested, it can constitute a complementary instrument
for monitoring RIAs from a quantitative perspective.
5.
Concluding remarks
This paper aims at offering a contribution to the debate on indicators for comparing
RIA systems from a practitioner’s perspective. A loose conceptualisation of the
different (chrono) logical phases of RIA was sketched, to serve as a basis for designing
a set of (mostly composite) indicators encompassing all relevant thematic domains (or
conceptual variables). These indicators were outlined and discussed, together with
related computational solutions, and a derived, smaller set of headline indicators
addressing RIA specifically in a monetary perspective was also proposed.
The paper, especially with respect to the more comprehensive frame of composites,
does not yet reach a fully operational stage, due to a number of issues which were
addressed only partly and/or from a purely abstract perspective, and both
To this end, contributions from experts can sharpen definitions of target phenomena,
and would be of great help for addressing issues of weights, at least tentatively; an
equally relevant contribution, however, would come from empirical testing, which was
not possible at present, due to limitations in data availability. Indeed, the paper
intentionally referred extensively to the items in the DIADEM database which is still in
progress, taking on board nearly everything, as for most indicators in empirical
literature; a certain amount of brand-new items were also added to the lot based on,
say, inspiration of the moment, so that some information gaps will also need being
addressed, would related indicators be deemed relevant.
Correlation analysis, tests of robustness and sensitivity, factor analysis and other
techniques might lead to reducing the number of elementary indicators, to a clearer
view of phenomena to look at when comparing RIA systems and on key relationships
among them (resulting also in the selection of variables and the identification of
proxies), as well as to the check and tuning of weighting systems defined otherwise
References
BRE (2006)‘The Tools to Deliver Better Regulation – Revising the Regulatory Impact
Assessment: A Consultation ’, Better Regulation Executive of H.M. Cabinet Office;
www.cabinetoffice.gov.uk/regulation
COLECCHIA,A.(1999),‘Defining and Measuring E-commerce: Towards the development of an Oecd Methodology’, presented at the Conference On The Measurement Of Electronic Commerce, Singapore Dept. of Statistics (6-8 December).
DE PANIZZA,A.(2006), Benchmarking Indicators for Innovation Policies at the Regional Level, Omen project D.2.2
DE FRANCESCO, F. and C. M. RADAELLI (2007), ‘Indicators of Regulatory Quality’, in C.
Kirkpatrick and D. Parker (eds), Regulatory Impact Assessment: Towards Better Regulation?, Cheltenham: Edward Elgar, 2007.
EC(2005),‘Impact Assessment Guidelines’, European Commission, SEC (2005) 791; JACOB,K.,A.MEUWESE and C.RADAELLI (2006),Development of a preliminary set of
indicators for the quality of IA, EVIA D.1.4 on Indicators for Regulatory Quality, 2nd draft
(September)
JACOBS,S. (2006), ‘Current Trends in Regulatory Impact Analysis: The Challenges of Mainstreaming RIA into Policy-making’, Jacobs and Associates, 30 may. Adapted from ‘Regulatory Impact Analysis in Regulatory Process, Method, and Co-operation:
Lessons for Canada from International Trends’, in Policy Research Initiative Working Paper Series
KAUFMANN,D.,A.KRAAY and M.MASTRUZZI,(2004)‘Governance Matters III,
Governance indicators for 1996, 1998, 2000, and 2002’, World Bank Economic Review. 18:253-287.
——— (2005)‘Governance Matters IV, Governance indicators for 1996-2004’, WB Policy Research WP No. 3630 (May)
——— (2006)‘Governance Matters V, Governance indicators for 1996-2005’, Available at SSRN: http://ssrn.com/abstract=929549
MANDELKERN,D.(ED.,2001) Mandelkern Group on Better Regulation Final Report ,
presented at the Laeken Meeting of the European Council of September 2001; available at:
http://ec.europa.eu/governance/impact/docs/key_docs/mandelkern_report_en.pdf
NARDO,M.,M.SAISANA,A.SALTELLI and S.TARANTOLA,(2005a), Tools for Composite Indicators Building. IPSC - Joint Research Centre of the European Commission. Available at:
http://farmweb.jrc.ec.europa.eu/ci/Document/EUR%2021682%20EN.pdf
NARDO,M.,M.SAISANA,A.SALTELLI and S.TARANTOLA,with A. HOFFMANN and E. GIOVANNINI (2005b), ‘Handbook on constructing composite indicators: methodology and user guide’, Oecd Statistics Working Papers series, STD/DOC(2005)3 (August). OECD (1999),Regulatory Reform in the United States – Government capacity to ensure High Quality Regulation. Oecd, Paris
OECD (2004a), ‘Regulatory Impact Analysis (RIA) Inventory’, note prepared by the Oecd Secretariat for the Public Governance Committee meeting,
GOV/PGC/RD(2004)1, Oecd, Paris, April.
OECD (2004b), ‘Regulatory performance: ex-post Evaluation of Regulatory Tool and Institutions’, Working Party on Regulatory Management and Reform, Public
Governance Committee, GOV/PGC/REG (2004)6. Oecd, Paris
RADAELLI,C.,B.DENTE,S.JACOBS,C.KIRKPATRIC,A.MEUWESE and A.RENDA (2006),
‘ENBR Handbook: How to perform the DIADEM data collection’, www.enbr.org (31 July)
RENDA, A. (2006) Impact Assessment in the EU: the State of the Art and the Art of the State, Ceps, Brussels
ROBERTI,P.(2006)Assessment Methodology Tool for Policy Evaluation and Impact Analysis, Omen Project D.2.1;
ROOM, G. (ed.; 2004), Final Report on Conceptualisation and Analysis of the New Information Economy, Deliverable 5.3 of the Nesis EU-IST VFP Project, Informer. Internet:
http://www.bath.ac.uk/soc-pol/research/nesis; http://nesis.jrc.cec.eu.int.
VISAGGIO, M. (2007), ‘A Conceptual Framework Toward Composite Indicators For Evaluating RIA Program Quality’, paper developed from the presentation (A. de Panizza, M. Visaggio) held at the ENBR Workshop on Regulatory Quality – Rotterdam (December 2006), mimeo
WORLD BANK (2004) Doing Business in 2004 – Understanding Regulation, The WB-IFC & Oxford U.P.: Available at: www.doingbusiness.org