Examine the Performance of different Topologies using
Opnet 14.5 in ZigBee Sensor Network
Sandeep Kaur
M.Tech Scholar ,AIET Faridkot, Punjab
Harinderpal Singh
Assistant Professor,AIET Faridkot, Punjab
Gurjeevan Singh
DIC ECE , Poly-Wing, SBSSTC Ferozepur, Punjab
ABSTRACT
This research work is implemented in ZigBee using IEEE 802.15.4 protocol stack, it is most widely used technique in wireless sensor network for low rate wireless personal area network. In this paper three topologies are used i.e. mesh, tree and hybrid topology. The hybrid topology is implemented by using the combination of mesh and tree topology. The data-based setup is done by changing mobile percentage of nodes. The performance of these topologies is measured using parameters throughput, MAC delay, DTR and DTS. The results quantify that hybrid topology is best among other two topologies as it provides high throughput ,high DTR and DTS. The simulation is done by OPNET modeler 14.5.
Keywords
ZigBee, OPNET Modeler, DTR, DTS.
1. INTRODUCTION
Wireless sensor networks (WSN) consists of light-weight, low power and small size sensor nodes. They have capability to monitor, compute and connect wirelessly [1]. Zigbee is a wireless personal area network based on IEEE 802.15.4 wireless protocol. Zigbee network defined first in 2004 and released in 2006. The second stack of the Zigbee network was defined as Zigbee 2006. It provides short distance communication with low complexity, low data rate and low power consumption. It is a two way technology which pointed to Wireless Sensor Network (WSN) [2]. Furthermore, it has several advantages such as self organization, smaller size of protocol stacks, and larger addressing space. Most commonly Zigbee also used in the medical field for patient monitoring or health and added together with self-care and self-management technologies can enhance their health outcomes [3]. The main aim of this technology is remote control and sensor applications, which is appropriate to operate in ruthless radio environments and isolated locations.The IEEE 802.15.4 protocol defines MAC and PHY layers for personal area network (PAN) [4]. The medium access control (MAC) layer send data frames over radios channels with specified modulation and spreading techniques. It enables the transmission of MAC frames through the use of the physical channel. The MAC layer of IEEE 802.15.4 standards operates in two modes, they are beacon enabled and non-beacon enabled mode. In beacon enabled mode, beacon messages are transmitted periodically for network organization and management. Beacon enabled are synchronized and allows the mode to operate on slotted Carrier Sense Multiple Access with Collision Avoidance (CSMA/CA) mechanism. In non-beacon mode nodes are not synchronized, because periodic beacon transmissions are absent. Therefore, this mode supported to unslotted CSMA/CA mechanism [5]. The physical layer is defined by IEEE 802.15.4 standard. The physical layer is responsible for providing data transmission service [6]. The physical layer
offers three operational frequency bands; there are 27 channels allocated in the 802.15.4 range, with 16 channels in the 2.4 GHz band, 10 channels in the 915 MHz band, and 1 channel in 868 MHz band.
2. COMMUNICATION
ARCHITECTURE
3. SIMULATION SETUP
[image:2.595.319.553.71.266.2]The simulation process is done using OPNET modeler 14.5.
Table 1: Simulation parameters
Network Size 45 m * 45 m
Number of Nodes 36 nodes
Simulation Duration
300 Sec
Mobility Model Random Waypoint
Lm 5
Cm 10
Rm 10
Using table 1, three scenarios has been designed in which percentage of mobile nodes varies from 20 to 80 percent and using random waypoint mobility model the speed of mobile nodes are 5 m/s. The nodes are randomly placed anywhere in the network. In the first scenario tree topology and in second scenario mesh topology is used. In third scenario the combination of tree and mesh topologies are used to implement a hybrid topology.
4. RESULTS AND DISCUSSION
The given result shows the performance of hybrid (H), tree (T), mesh (M) with 20%, 40%, 60% and 80%of mobile nodes in the network. Using followingparameters the performance of the network has been observed.
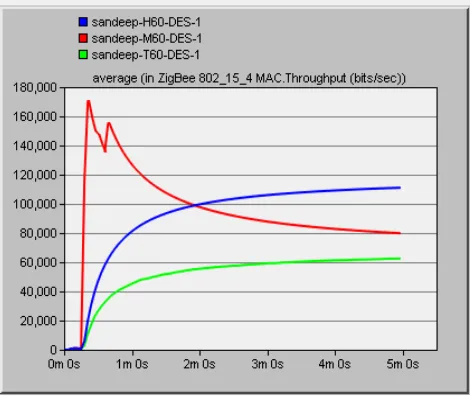
4.1 Throughput
[image:2.595.69.260.127.288.2]Throughput is the ratio of the total amount of data that a receiver receives from a sender to a time it takes for receiver to get the last packet. Throughput is the data quantity transmitted correctly starting from the source to the destination within a specified time (seconds). A low delay in the network translates into higher throughput. The results shown in Figures 1, 2, 3 and 4 conclude that maximum throughput is achieved by hybrid topology and minimum throughput is achieved in tree topology. Throughput in mesh topology is almost same in all cases.
[image:2.595.320.555.302.502.2]Figure 1 Throughput of tree, mesh and hybrid topologies with 20% of mobile nodes
Figure 2 Throughput of tree, mesh and hybrid topologies with 40% of mobile nodes
Figure 3.Throughput of tree, mesh and hybrid topologies with 60% of mobile nodes
[image:2.595.320.557.528.730.2] [image:2.595.56.283.568.738.2]4.2 MAC Delay
[image:3.595.318.550.85.255.2]Represents the end to end delay of all the packets received by the 802.15.4 MACs of all WPAN nodes in the network and forwarded to the higher layer. Figures 5, 6, 7 and 8 shows that MAC delay of hybrid topology is maximum and MAC delay of tree topology is minimum in all simulation. The MAC delay in mesh topology is almost same in all scenarios.
[image:3.595.55.290.152.320.2]Figure 5. MAC delay of tree, mesh and hybrid topologies with 20% of mobile nodes
Figure 6. MAC delay of tree, mesh and hybrid topologies with 40% of mobile nodes
[image:3.595.55.290.352.526.2]
Figure 7. MAC delay of tree, mesh and hybrid topologies with 60% of mobile nodes
Figure 8.MAC delay of tree, mesh and hybrid topologies with 80% of mobile nodes
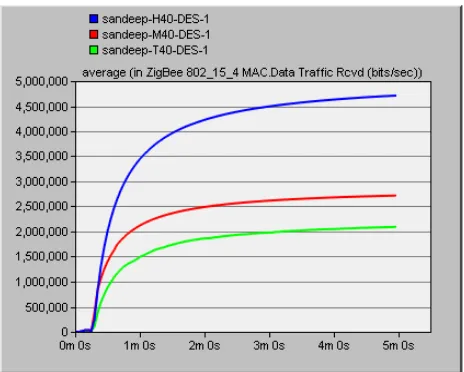
4.3 DTR (Data Traffic Received)
[image:3.595.320.556.367.524.2]It represents the total traffic successfully received by the MAC from the physical layer in bits/sec. This includes retransmissions. The results shown in Figures 9, 10, 11 and 12 conclude that maximum DTR is provided by hybrid topology .Whereas tree topology attained minimum DTR. The mesh topology obtains effective DTR in all cases.
Figure 9. DTR of tree, mesh and hybrid topologies with 20% of mobile nodes
[image:3.595.56.293.552.734.2] [image:3.595.321.553.555.741.2]Figure 11. DTR of tree, mesh and hybrid topologies with 60% of mobile nodes
Figure 12. DTR of tree, mesh and hybrid topologies with 80% of mobile nodes
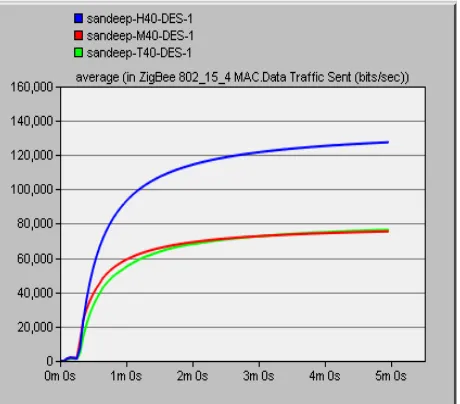
4.4 DTS (Data Traffic Send)
[image:4.595.55.295.274.433.2]These statistics record the amount of data transmitted by the network interface onto the physical layer. The results shown in Figures 13, 14, 15 and 16 conclude that maximum DTS is provided by hybrid topology .Whereas mesh topology attained minimum DTR. The tree topology obtain effective DTS in all cases.
[image:4.595.320.561.301.512.2]Figure 13. DTS of tree, mesh and hybrid topologies with 20% of mobile nodes
Figure 14 . DTS of tree, mesh and hybrid topologies with 40% of mobile nodes
Figure 15. DTS of tree, mesh and hybrid topologies with 60% of mobile nodes
[image:4.595.321.558.540.739.2] [image:4.595.55.294.546.744.2]5. CONCLUSION
This research work show that the hybrid topology achieved maximum and tree topology achieved minimum throughput and in case of mesh topology the throughput is almost same in all cases. MAC delay of hybrid topology is maximum and MAC delay of tree topology is minimum in all simulation. The MAC delay in mesh topology is almost same in all scenarios. Maximum DTS and DTR are achieved by hybrid topology. Tree topology provides minimum DTR and mesh topology provides minimum DTS.
6. REFERENCES
[1] Boris Mihajlov and Mitko Bogdanoski,”Overview and Analysis of the Performances of ZigBee based Wireless Sensor Networks”, International Journal of Computer Applications (0975 – 8887) Volume 29– No.12, September 2011.
[2] Zavosh Abdollahzadeh Davani, Azizah Abdu Manaf, “Survey on Key Management of ZigBee Network”, The International Conference on E-Technologies and Business on the Web (EBW2013).
[3] Rozeha A. Rashid , Hamdan Sayuti, Nurul Mu'azzah Abdul Latiff, Norsheila Fisal, Mohd Adib Sarijari, Abdul Hadi Fikri Abdul Hamid, Rozaini Abd Rahim, “Simple Scheduling Scheme for Smart Home and Ambient Assisted Living”, The Second International Conference on Informatics Engineering & Information Science (ICIEIS2013) – Malaysia.
[4] Long Fei Zhao, Jordan Angelov, Stoyan Petrov, “Evaluation of Zigbee Remote Sensor Networks, ENSC 427 SPRING 2012.
[5] Surender.R, P. Samundiswary, “Performance Analysis of Node Mobility in Beacon and Non-Beacon enabled IEEE 802.15.4 based Wireless Sensor Network”, IJCA (0975 – 8887), Volume 76– No.12, August 2013.
[6] http://en.wikipedia.org/wiki/ZigBee.
[7] J. Pedro Amaro, Fernando J.T.E., Ferreira, RuiCortesão, Jorge Landeck, “Powering Wireless Sensor Networks Nodes for Comple Protocols on Harvested Energy”, CENTERIS 2012 – Conference on Enterprise Information Systems HCIST 2012 - International Conference on Health and Social Care Technologies, Procedia Technology 5 ( 2012 ) 518 – 526.
[8] Francesca Cuomo, Emanuele Cipollone, Anna Abbagnale,” Performance analysis of IEEE 802.15.4 wireless sensor networks: An insight into the topology formation process”, Computer Networks 53 (2009) 3057– 3075.
[9] Lovish Jaiswal, Jaswinder Kaur, Gurjeevan Singh, “Performance Analysis of Topological Variation in Personal Area Network using ZigBee Wireless Sensors”, IJCST Vol.3, Issue 4, Oct- Dec 2012, ISSN: 2229- 4333(Print).