The Implication of Tweet’s Distribution by Quantizing
Stock Values for Inference in the Indian Financial
Market: A Sentiment Analysis Approach
R. V.
Argiddi
Associate Professor Walchand Institute Technology, Solapur, India
S. S. Apte
Professor Walchand Institute Technology, Solapur, India
V. S. Adam
P.G. Scholar, Walchand Institute Technology, Solapur, India.
ABSTRACT
The rise of social networking has changed the behavior of the entire world.In these day’s most of the people put their opinion in the social media so these allow users to access the real-time data from social networks generating the huge amount of data worthy for sentiment analysis and its future prediction.In this paper, we have proposed a promising approach with the help of twitter’s API by collecting the tweets on a daily basis and analyzing them for calculating sentiment out of it. We have proposed here the new method i.e. By quantizing the closing stock values of companies listed in NSE by combining them with sentiment’s derived from tweets of the same date with the help of the most powerful NLP tool LING PIPE and calculate the distribution of each tweet. This has proved to be a one of the best method for predicting the sentiment of company present public’s mind as a result this sentiment is significant for traders who are interested to invest in that company.
1.
INTRODUCTION
It can be seen from last many year's stock market is a big center of attraction to delve into for academics and business researchers. The very famous question is always asked by public i.e. Is it really possible to predict the stock market? We say YES it is possible by taking advantage of technology (social network). As we all know that Twitter is one of the world’s most top rated micro blogging social networking sites.
With the help of Twitter API, tweets from twitter can be collected and tweets database is created used to store tweets. We use the natural language processing tool Ling Pipe, we train them in a particular manner to some extent and when it starts behaving automatically it tag a particular mood one out of it (Alert, Calm, Vital, Sure, Happy, and Kind) and polarity like (Positive, Negative and Neutral) to each tweet. We continue this tagging process for tweets as per date and calculate distribution of 5 series of tweets.As tweet database, we even maintain database for Stock values collected from yahoo finance of a particular company after that continuous three series of closing stock values as per date are taken and quantized which are further allied with calculated distribution of tweets. This processed data are given to classifier as input for classification purpose and final output is generated.
2.
RELATED WORK
“Significance of lingpipe using twitter tweets for stock market prognosis” [1] in this paper, we had given detailed literature survey done on collecting tweets our idea was to collect tweets and pass them through LingPipe which was trained previously and finally classified with the help of SVM and based on this we predict the sentiment of collected tweets.
"Twitter mood predicts the stock market" [2] in this paper authors had given a unique representation of sentiment analysis and its implementation on the stock market.They had collected tweets from twitter with the help of twitter API.They have used two tools Opinion Finder and Google profile of mood sates (GPOMS).Opinion finder finds the positive and negative sentiment from tweets whereas GPOMS finds the sentiment in six dimensions (Alert, Calm, Vital, Sure, Happy, and Kind).The historical stock values from DJIA are collected these stock values are closing stock values of the DJIA. After calculating the sentiment from tweets they are stored in the database. Granger causality and Self-Organizing Fuzzy Neural Network are used to conform the mood states calculated by opinion finder and GPOMS whether they are valid in predicting DJIA values. Their prediction is 86.7% percent correct as they had validated this model for checking and calculating the mood of parliamentary election of USA. “Opinion Mining and Sentiment Analysis on a Twitter Data Stream” [3] in this paper, researchers are discussing that opinion mining and sentiment analysis are becoming popular day by day. Now the days had gone off taking reviews of relatives or friends and then buy the product. This is an era of social networking so under one roof, we lot of reviews. They had collected, they the tweets from Twitter using twitter API and processed based on emotions of tweets as positive, negative and irrelevant with the help of various algorithms of Weka they analyze the data and discuss their application. “Sentiment Analysis and Summary of Twitter Data”, [5] here also tweets are collected and using the API calculate the sentiment and do summarization based on aspect.A different algorithm is used to compare the polarity and summarization of tweets. Here the analysis of hybrid polarity system produces the best results still now.
3.
BACKGROUNG
3.1.
Opinion Finder
[2]It is freely available tool for sentiment analysis, which identifies emotion of sentences (positive or negative). It has provided good results on a large scale tweets prediction whereas it uses OF lexicon for concluding ratio of positive versus negative of a particular day. Positive and negative word list is prepared and working is done along with it and on positive and negative words. If a positive or negative word occurs, then there counter is increased of either positive or negative and finally ratio is calculated.
3.2.
GP-OMS (Google-Profile of Mood
States)
Calm, Vital, Sure, Happy, and Kind).Here psychometric instrument is used to calculate the mood which contains seventy two terms of POMS questionnaire with lexicon of 964 related words and even word occurrence is calculated from a collection of 2.5 billion tweets. This lexicon's are enlarged of 964 terms which allows GPOMS to capture a wide variety of natural mood from twitter further they are mapped to respective POMS mood dimensions. These lexicons are further matched in terms of tweet. Matching tweet a n-gram term is mapped back to its original term with the help of PMOS scoring table to its dimensions. Based on these score the weight is calculated from each tweet.
3.3.
Sentiment Summarization:
Tremendous work has been completed on sentiment summarization[5]. Here main work is to develop summarize method subjective sentences are extracted and these subjective sentences are summarized. The method is derived to generate summaries with the help of classic Natural Language generated pipeline with the content selection, with a planning of sentences and its realization. This methodology generates textual descriptions of available information. Due to this method target system is generated. Here summarization is
done on particular accept and based on the target. The main aim was to summarize the reviews of Hotel and restaurants. Hence the novel approach is introduced for analysis of target oriented sentiment analysis.
3.4.
Algorithm: Stock Market Prediction
Using Event-Based Supervised
Sentiment Learning.
In this algorithm most significant event criteria are selected[4]. Based on this selection we select particular pre, post and contemporaneous tweets. After that, with the help of significant event criteria, labels are assigned based on event for each tweet. When an assignment is over then classifier is trained on these labels and finally sentiment is predicted. This sentiment is aggregated to generate final results.
Position i.e. Long/short is aggregated.
4.
METHODOLOGY
Many researchers have calculated the sentiment out of tweets and predicted stock market index out of it. Here our approaches have extended till particular company’s sentiment prediction by quantizing process.
Fig 1: System Flow Diagram
Above the working flow of the entire concept raw data is taken from twitter using twitter’s API and they are stored in the database simultaneously daily stock values are collected from yahoo finance and stores in the database. Data from tweet DB is retrieved and given to ling pipe where ling pipe is trained at some extent of tweets and further ling pipe behaves automatically as per training it keeps on tagging the sentiment of each tweet. The output of Ling pipe is processed i.e. (Five tweets are converted into 1 output) at the same time closing stock collected are quantized and both distributed tweets and quantized stock values of companies are allied which is further given to the classifier for classification purpose. Then the classification model is created by sorting
correctly/incorrectly classified tweets and as a final point sentiment in particular is calculated
Below are the detailed descriptions of working process
4.1.
Preprocessing
In this approach historical closing prices from National Stock Exchange (NSE) are collected of previous 90 days. Among multiple attributes in historical data, only the adjusted closing prices are considered.
Sometimes the adjusted closing values are missed while collecting, which makes very difficult to process of the particular date to overcome this demerit we have assigned the
Tweet
DB
Daily Stock
Values
Ling
Pipe
Quantized
Direction
Analyse daily values &
tweets
Final
Output
Classifiers(SVM/J48)
nearest neighbor’s value. In processing the missing stock values are adjusted my taking the nearest stock value. In the same manner tweets are collected from twitter using twitter API we have a collected plenty of data (tweets) which is more than enough for processing
4.2.
Filtering
We have filtered the data set in many ways as the data are taken directly from twitter it is not authentic that who had tweeted it. When we have collected data lot of unwanted data was present like non English language tweets, tweets containing??,## , pointers, only url's with no data and various special characters with bad words too.
For filtration purpose we had to fire various queries of different as per detected unwanted data and its repetition .We Felt mandatory to filter it because this unwanted text would create confusion for NLP tool and Classifiers.
4.3.
Data Selection
It is very important phase as good input gives more accuracy we get.So historic tweets and stock values collected are selected from our databases i.e. Tweet database and stock values database as per date
Table 1. Stock Values
Compan
y Infy TCS
Mind
tree Polaris
Mphas is
Date 27/7/14 13/11/1
4 11/1/14 10/5/14 10/5/1
4
Open 53.74 35 625 174.7 393
High 54.84 37 641 178.9 405
Low 53.74 32.1 601 172 390
Close 54.82 36.2 601 176.35 394.6
Volume 280000 0
1466760 0
670290 0
301460
0 49600
AdjClos
[image:3.595.49.288.327.518.2]e 54.82 36.2 271.64 141.94 41.32 From above shown table adjusted (adj close) values are taken they are quantized and then used.
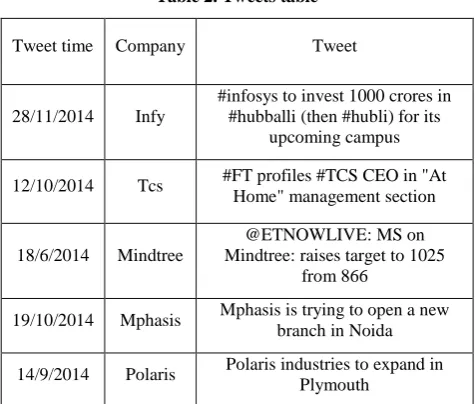
Table 2. Tweets table
Tweet time Company Tweet
28/11/2014 Infy
#infosys to invest 1000 crores in #hubballi (then #hubli) for its
upcoming campus
12/10/2014 Tcs #FT profiles #TCS CEO in "At Home" management section
18/6/2014 Mindtree
@ETNOWLIVE: MS on Mindtree: raises target to 1025
from 866
19/10/2014 Mphasis Mphasis is trying to open a new branch in Noida
14/9/2014 Polaris Polaris industries to expand in Plymouth
Above shown are the tweets and their storage of different companies
Infosys Company is going to invest 1000 cores in Hubli for its campus; the meaning will be that it will be positive tweeting with mood Happy
TCS is going to encourage the “At home” management section, once again, it is positive tweet with calm mood 3. The mind tree company raises the target from 866 to 1025; It is positive tweet with alert mods
4. Mphasis is trying to open the new branch in Noida. It is positive tweet with mood happy
5. Polaris industries is trying to expand its empire, it is a positive move of Polaris and moos is Vital
4.4.
Data conversion
4.4.1.
Converting stock values
Here we convert the data taken from datasets i.e. We quantize the stock values collected ad
The formula is
Change (tn) = close tn – close tn-1
Here we minus today’s closing value of yesterdays value and calculated change is nothing but direction shown below. Dir (t) = high it change (t) > threshold
= low it change (t) < threshold = 0 otherwise
Calculated direction is then compared with the predefined threshold value when the change is greater than threshold, it is considered as high, when change is less than threshold it is low and if none above it is considered as zero.
4.4.2.
Tagging tweets
[image:3.595.48.286.553.755.2]We use here the most powerful NLP tool Ling Pipe.We had trained the Ling Pipe manually with three polarities like (Positive, Negative and Neutral) and five moods (Alert, Calm, Vital, Sure, Happy, and Kind) after that Ling pipe prepares a bag of words and automatically starts tagging the tweets from our database.
Table 3. Output of Ling Pipe
Tweet_id Polarity Mood
487079414409089026 Neutral Alert 487081382061932545 Positive Happy
487088859776163841 Positive Alert 487089037610868736 Positive Happy 487089155550085120 Negative Alert Above tables shows the detailed implementation and output of ling pipe .each and every tweet is identified by unique tweet_id which is tagged with particular polarity as shown.
4.5.
Analyze Daily Values
𝑀𝑜𝑜𝑑 𝑥 =|Tweet x| |tweets|
This formula is used to calculate the ratio of no. of tweet having mood(x) from tweets i.e. Particular mood upon total tweets
[image:4.595.51.548.170.289.2] [image:4.595.332.537.333.457.2] [image:4.595.76.258.374.679.2] [image:4.595.334.520.573.685.2]𝑃𝑜𝑙𝑎𝑟𝑖𝑡𝑦 𝑝 =|tweet p| | tweets |
This formula is used to calculate the ratio of no. Of tweets having polarity (x) from total no. Of tweet.
4.6.
Interpretation Of Generating Results
Table 4. Allied Output of Tweets and Stock Values
0.025641,0.769231,0.025641,0.000000,0.000000,0.179487,1.000000,0.000000,LOW,LOW,HIGH 0.025641,0.769231,0.025641,0.000000,0.000000,0.179487,1.000000,0.000000,HIGH,LOW,LOW 0.025641,0.769231,0.025641,0.000000,0.000000,0.179487,1.000000,0.000000,LOW,LOW,LOW
0.000000,0.653846,0.000000,0.038462,0.000000,0.307692,HIGH,NOCHANGE,LOW
0.210526,0.736842,0.000000,0.000000,0.000000,0.052632,HIGH,HIGH,NOCHANGE 0.051724,0.586207,0.000000,0.293103,0.000000,0.068966,LOW,HIGH,HIGH 0.100559,0.279330,0.039106,0.164804,0.041899,0.374302,NOCHANGE,LOW,HIGH
The above information is the output when we merge the direction obtained from stock values and distribution calculated on tweets.
5.
EVALUATION OF ACTUAL
RESULTS
Below shown are the actual results of Infosys Company
Table 5. Classification using LibSvm of Weka.
Evaluation of test split of
Infy SVM
Correctly Classified
Instances 250 65.7895 %
Incorrectly Classified Instances
130 34.2105 %
Total Numbe
r of Instances 380
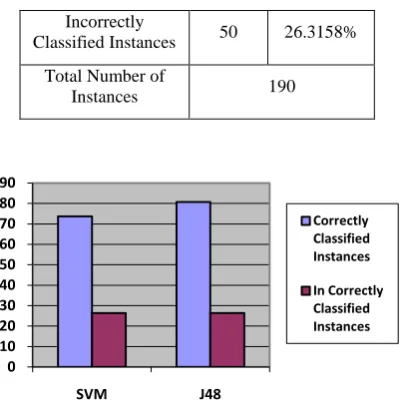
Table 6. . Classificationusing J48 of Weka
Evaluation of test split of
Polaris J 48
Correctly Classified Instances
140 80.6842%
Incorrectly Classified Instances
50 26.3158%
Total Number of
Instances 190
Fig 2: Representation of Sentiment
Above classifiers of Weka has analyzed 380 instances of Infosys company tweets out of it calculated sentiment is as shown, we can say positive sentiment on the next day will be 65.78 % buy LibSVM and by 96.124% J48 positive market of Infosys
Below shown are the actual results of Polaris Company
Table 7.Classification using LibSvm of Weka.
Evaluation of test split of Infy J48 Correctly Classified
Instances 250
96.124 %
Incorrectly Classified
Instances 130
3.876 % Total Number of
Instances 380
8.Classification using J48 of Weka Table.
Evaluation of test split of
Polaris J 48
Correctly Classified
Instances 140 80.6842%
0 10 20 30 40 50 60 70 80 90 100
SVM J48
Correctly classified Instances
Incorrectly
Classified Instances 50 26.3158%
Total Number of
Instances 190
Above classifiers of Weka has analyzed 190 instances of Polaris company tweets out of it calculated sentiment is as shown, we can say positive sentiment on the next day will be 73.68 % buy LibSVM and by 26.31% J48 positive market of Polaris
[image:5.595.68.271.67.271.2]Below shown are the actual results of Mphasis Company
Table 9.Classification using SVM of Weka.
Evaluation of test split of Mpahsis SVM Correctly Classified
Instances 270 60.00
% Incorrectly Classified
Instances 180 40 .00
%
Total Number of
[image:5.595.328.533.84.206.2]Instances 450
Table 10.Classification using J48 of Weka.
Evaluation of test split of
Mpahsis J 48
Correctly Classified
Instances 320 71.111
% Incorrectly Classified
Instances 130 28.888
% Total Number of
[image:5.595.321.526.301.465.2]Instances 450
Table 11.Classification using SVM of Weka.
Evaluation of test split of Mindtree SVM Correctly Classified
Instances 24 58.5366
% Incorrectly Classified
Instances 17 41.4634
%
Total Number of
Instances 41
Above classifiers of Weka has analyzed 380 instances of Mphasis company tweets out of it calculated sentiment is as shown, we can say positive sentiment on the next day will be 60.00 % buy LibSVM and by 71.11% J48 positive market of Mphasis.
Below shown are the actual results of Mindtree Company
Table 12.Classification using J48 of Weka.
Evaluation of test split of
Mindtree J48
Correctly Classified
Instances 30 73.1707 %
Incorrectly
Classified Instances 11 26.8293 %
Total Number of
Instances 41
6.
CONCLUSION
Our main task in this work was to do analysis on collecting historical tweets and stock values, which are further processed to extract the sentiment out of it. By distributing them and quantizing the stock values (multiple days) of particular company which really proved to be a unique approach. With the help of most powerful NLP tool Ling Pipe, which tags the tweets more accurately with correct tagging rate at 96% and further these processed data is classified for final results .With the help of SVM and J48 classified output(which are as shown above ), we can conclude the sentiment of the particular company and finally predict the sentiment of company till the date .This generated sentiment may be used as suggestions for real time traders of NSE
7.
FUTURE WORK
In our research work we had only used twitter for calculating sentiment out of it, but in the future we can use many other social networking sites (Facebook, LinkedIn, Google plus, Pinterest, Flickr, etc.), for collecting as large amount of data more with accuracy. But the collection of data is directly proportional to time and we can increase accuracy with more data.
This study we had done it for only stock market area but it is not limited to it. We can expand it to various areas like rating movies, study the popularity of any latest released product (laptop, mobile,apps,books,etc).
0 10 20 30 40 50 60 70 80 90
SVM J48
Correctly Classified Instances
In Correctly Classified Instances
0 10 20 30 40 50 60 70 80
SVM J 48
Correctly Classified Sentences
[image:5.595.73.261.370.601.2]8.
REFERENCES
[1]. Mr. R. V. Argiddi, Ms. S. S. Apte, Mr. V. S. Adam “Significance of lingpipe using twitter tweets for stock market prognosis”, Volume 4,Issue10,Oct2014
[2]. Johan Bollen, Huina Maoa, & Xiaojun Zeng (2011)"Twitter mood predicts the stock market." Journal of Computational Science, Volume 2, Issue 1.
[3]. BalakrishnanGokulakrishnan, Pavalanathan Priyanthan , ThiruchittampalamRagavan, Nadarajah Prasath, AShehan Perera “Opinion Mining and Sentiment Analysis on a Twitter Data Stream”,The International Conference on Advances in ICT for Emerging Regions,pp.182-188,ICTer2012
[4]. Min Song, Meen Chul Kim , RT2M : “Real-time Twitter Trend Mining System”,International Conference on Social Intelligence and Technology,2013Seyed-Ali Bahrainian, Andreas Dengel, “Sentiment Analysis and Summarization of Twitter Data”
[5]. Seyed-Ali Bahrainian, Andreas Dengel, “Sentiment Analysis and Summarization of Twitter Data”, IEEE 16th International Conference on Computational Science and Engineering,2013
[6]. Masoud Makrehchi, Sameena Shah, Wenhui Liao “Stock Prediction Using Event-based Sentiment Analysis”,IEEE/WIC/ACM International Conferences on
Web Intelligence (WI) and Intelligent Agent Technology (IAT),2013
[7]. Aleksander Bello, Alexandru Cioc, Victor Duan, Archan Luhar, Louis O’Bryan Tweet Rises: “Twitter Sentiment Analysis”
[8]. Saeideh Shahheidari, Hai Dong, Md Nor Ridzuan Bin Daud, Twitter sentiment mining: “A multi domain analysis”,Seventh International Conference on Complex, Intelligent, and Software Intensive Systems,2013 [9]. Sonal Gupta, Benjamin Slawski, Doris Xin, Wenqi Yao,
The Twitter Rumor Network: “Subject and Sentiment Cascades in a Massive Online Social Network”
[10].Rajesh V. Argiddi*1 Dr.Mrs.S.S.Apte, “ Analysis of Fragment Mining on Indian Financial Market”,ijcsit,Volume 205,issue 05,ijcsit2014
[11].Rajesh V. Argiddi1 , Bhagyashri U. Kale, “Study of Optimization in Fragmented Item-sets for Business Intelligence”,ijsr,volume 3,Issue 8,ijsr2014
[12].Pham, Hung and Chien, Andrew and Lim, Youngwhan. "A Framework for Stock Prediction.",ijarcsse,Volume 4,Issue 10,December 11, 2009