Policy for better Air Quality in Asia:
Proposal for a Policy Evaluation Method
for four ASEAN Countries.
Hirota, Keiko
Japan Automobile Research Institute
7 March 2007
Online at
https://mpra.ub.uni-muenchen.de/15081/
- 1 -
Policy for Better Air Quality in Asia
-Proposal for a Policy Evaluation Method for four ASEAN Countries-
Keiko Hirota
Japan Automobile Research Institute, 2530 Karima Tsukuba Ibaraki 305-0822 Japan Tel:+81-29-856-0767, Fax:+81-29-860-2388
- 2 -
AbstractFour ASEAN countries Indonesia, Malaysia, the Philippines and Thailand are facing major air pollution problems due to rapid economic growth, urbanization and motorization. Mortality and respiratory
diseases caused by air pollution are believed to be endemic in cities of these countries. Regulations and standards are the first requirement for reducing emissions from both fixed and mobile sources. In order to
reduce vehicle emissions, governments of the four countries are making efforts to introduce vehicle emission regulations for new vehicles.
This paper attempts to estimate the 2015 car stock by emission regulation levels from past trends. Considering these car stock results, this paper emphasizes monitoring problems such as vehicle
registration systems, inspection and maintenance (I/M) systems and fuel quality monitoring systems for vehicles in use. Monitoring problems in developing countries share similar characteristics such as a
weakness in government initiatives and inadequate operation of government agencies, which results from a lack of human resources and analysis of facilities. Finally, this paper proposes a method to assure air quality improvement under the different shares of emission regulations in these four ASEAN countries
and introduces an example of an evaluation method based on a policy survey to improve air quality.
Key words: Asia, Air Pollution, Environment and Development, Transportation, Regulatory Policies
- 3 -
1 Background of Air Pollution in four ASEAN CitiesFour ASEAN countries have been facing a major air pollution problem due to rapid economic growth,
motorization and urbanization. Figure 1-1 shows GDP per capita[43] and number of vehicle per 1000
people over the period 1985-2002 for Bangkok[4],[47], Kuala Lumpur[54], Jakarta[14], Manila[45], and
Japan[37]. As the first observation, compared to Japan (1975), Bangkok (2002) and Kuala Lumpur
(2002) are already beyond it in terms of vehicle numbers per 1000 people. These four ASEAN cities have
a faster process of motorization in terms of GDP per capita. As the second observation, the national
average level [32][37] follows the city level in accordance with economic growth. In the future, there is a
high probability of achieving at Japanese level (427 units per 1000 people) at the national level in FOUR
- 4 -
●:City level, ▲:National Level
Figure 1-1 GDP per Capita and Number of Vehicle per 1000 people
Data sources: Alfa Research Co.Ltd.,[4],BPS[13][14],National Statistics Office[47],Land Transport Office[45],NSCB[46] JARI[37], JETRO[43], Statistical Bureau[54], UITP[44]
Table 1-1 shows air quality monitoring in large four ASEAN cities using the criteria of WHO
guidelines[22] [57] as of 1990 and the most recent year of 2002-2005[3][8][9][10][11][58][59][60]. The air
pollutants PM10 and NO2 become serious from 1990 to the most recent year. A catalyst, an
after-treatment vehicle technology, can reduce HC, CO, and NOx according to vehicle emission
regulation levels. However, rapid motorization may cancel out the efforts of air pollution reduction policies.
[image:5.595.108.527.134.401.2]- 5 -
and in Kuala Lumpur from 1990 to 2004 [3][54] because lead had been phased out from automobile fuel
in these cities [24][25] (Table 1-1). Lead concentration in air increased in Jakarta from 1990 to
2004[2][15][60] because lead was phased out from automobile fuel in 2006 [27] [29](Table 3-1).
Latest Year(2002-2005)
1990
City CO NO2 PM10 O3 SO2 Lead
Jakarta 2004 E C E C D D
Kuala Lumpur 2004 C D D C B A
Manila 2002 C E E D C B
Bangkok 2005 A D D B C B
City CO NO2 PM10 O3 SOx Lead
Jakarta 1990 C B D C C C
Kuala Lumpur 1990 C C B C B C
Manila 1990 D D D D B C
Bangkok 1990 B B E B B C
A
50 % below from WHO guideline
B
Within WHO guideline
[image:6.595.82.509.232.494.2]C
Within 200 % from WHO guideline
D
Within 300 % from WHO guideline
E
300 % over from WHO guideline
Table 1-1 Air Quality Monitoring in FOUR ASEAN Large Cities
Data sources:ACFA[2], ADB [8] [9][10][11], Alam Sekitar Malaysia Sdn.[3], BPS [15],Hirota[24] [25][27][29], WB,[58][59][60],WHO[57]
According to the World Health Organization (WHO)[57], mortality caused by air pollution in large cities is
estimated to be 800,000 people[22]. Two-thirds of the deaths are concentrated in Asian cities. With these
concerns of mortality and respiratory disease caused by air pollution in large cities, it is an urgent matter
to reduce air pollution in FOUR ASEAN cities. Figure 1-2 shows the 21 literatures from HEI surveys [22]
- 6 -
PM10 increases at 10 ug/m3, mortality change increases at a rate of 0.3% to 1.5% from natural mortality.
When PM10 increases at 10 ug/m3, of respiratory disease change increases at a rate of 1.1% to 4.5%
from the normal probability of respiratory disease. Taking into consideration the future health costs [49],
policy implementation of emission regulations for new vehicles in early motorization reduced the cost of
air pollution reduction. If the cost of air pollution is reduced at present, the cost of health care is reduced
in the future.
4 1.5
0.8
0.6 0.53 0.53 0.5 0.5 0.5
0.3
No.5 No.15 No.16 No.1 No.13 No.20 No.2 No.17 No.14
Change of daily mortality (%)
Change o f M o rt al it y (% ) Literature Number 4.5 4.5 3.5
2.5 2.2
1.6 1.6
1.11
Change of respiratory disease (%)
[image:7.595.112.540.288.598.2]C h an ge of Res p ir at ory D isease (% ) Literature Number
Figure 1-2 Literature Survey in Asia (Total number of literature =21) Change of daily mortality and respiratory disease (%)
by an increase of PM 10 at 10 µg/m3
Data sources: HEI[22]
- 7 -
2. Introduction of Vehicle Emission RegulationsThe introduction of emission and fuel regulations are merely the first step toward political
implementation of air pollution reduction. In recent years, governments in FOUR ASEAN countries have
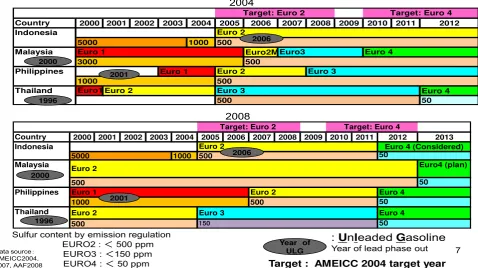
been introducing vehicle emission regulations for new vehicles[7]. Figure 2-1 shows the time schedule of
the vehicle emission regulations and sulfur content for new gasoline-driven passenger vehicles in FOUR
ASEAN countries. The common target is the introduction of EURO 2 by 2008 and EURO4 by 2012[6]. In
fact, the time schedule of 2007 is delayed compared to the time schedule of 2004 [28][38][39].
In order to meet the EURO 2 standard level, it is important to install catalytic converters to meet the
emission regulation level (CO, HC, NOx etc). Since lead in gasoline cause the catalytic converter to
malfunction [19], leaded gasoline in four ASEAN countries have been phased out already [23][24][25]. As
the next step, lowering the sulfur content (below 500 ppm) is the focus for introducing stricter emission
- 8 -
Target : AMEICC 2004 target year
Sulfur content by emission regulation EURO2 : <500 ppm EURO3 : <150 ppm EURO4 : <50 ppm
: Unleaded Gasoline Year of lead phase out
Year of ULG
2004
2008
Data source:
AMEICC2004,
2007, AAF2008
7
Country 2000 2001 2002 2003 2004 2005 2006 2007 2008 2009 2010 2011 2012 2013 Indonesia
5000 1000 500 50
Malaysia Euro4 (plan)
500 50
Philippines
1000 500 50
Thailand
500 150 50
Target: Euro 2 Target: Euro 4
Euro 2 Euro 4 (Considered)
Euro 2
Euro 1 Euro 2 Euro 4
Euro 2 Euro 3 Euro 4
2006
2001 2000
1996
Country 2000 2001 2002 2003 2004 2005 2006 2007 2008 2009 2010 2011 2012
Indonesia
5000 1000 500
Malaysia Euro2M
3000 500
Philippines Euro 1
1000 500
Thailand Euro1 Euro 4
500 50
Euro 3
Euro 3
Euro 1 Euro3
Euro 2
Target: Euro 2 Target: Euro 4
[image:9.595.87.566.124.392.2]Euro 4 Euro 2 Euro 2 2006 2001 2000 1996
Figure 2-1 Time Schedule for Emission Regulations (upper line) and Fuel Quality (lower line)
-Gasoline Passenger Vehicle-
Data Source: Governmental documents, AMEICC 2007 [1] AMEICC 2004[6], AAF[7]
3. Passenger car ownership estimation by emission regulation level
The estimation of passenger car ownership by vehicle emission regulations is a crucial estimation for
the analysis of transportation-related policies and emission levels. This section is an attempt at
methodological amelioration through emission regulations in a cohort model. This section aims to
understand how much the share of vehicle is controlled / uncontrolled by vehicle emission regulations
(Figure 2-1) in the vehicle market in each country.
Previous works take into consideration the physical deterioration of the vehicle such as accidents or
- 9 -
the Japanese market 1965-2000[30]; in response, the rate of car ownership increases without limit in
2030. A cohort model can be applied for a short term estimation and for the country that has growth rate
of car stock. For this cohort model car stock estimation by emission regulation employs a "survival rate"
estimated until 2015. The problem of estimation by the cohort model is non-availability of track record for
scrappage in four ASEAN countries. Conducting a reasonable literature survey on scrappage, the
determinants of scrappage will be the focus. Walkers [56] explained auto dealers are viewed as the
agents making scrappage decisions. A vehicle maintenance expense determines scrappage. As an
empirical proposition, scrappage seem to be decided by weighting the benefits between the scrappage
value and maintenance expenses by owners, which contrasts with previous academic works. Park
[50][51] finds the price of new vehicles and repair costs to be highly significant in explaining total
scrappage. Berkovec [16] also accurately compared the cost of scrappage and vehicle market value.
Greenspan and Cohen [21] introduced a determination of the survival rate with components, which
reflects the physical deterioration and vehicle market value.
In this model, applying the Greenspan and Cohen [21] model's concept, the survival rate is determined
by the elasticity of new car sales unit [20][34][35][36] in terms of scrappage unit (scrappage = car stock of
previous year + new car sales of present year - car stock of present year). The procedure to estimate
survival rates follows Okamoto's model[48]. (Eq 1-Eq 6). Reflecting the slow replacement of car stock in
four ASEAN countries, the maximum length year of a passenger vehicle (M in Eq1) is assumed to be 30
years because vehicles seem to be used between 20-40 years according to an expert opinion in Thailand.
- 10 -
M) -(t t
(t)
=
a
p
Eq 1t: Vehicle age at the year 2005
M: Maximum length of years for a passenger vehicle. (M=30) a: Constant (Elasticity of scrappage in terms of sales in the year t) p: Survival rate p(0)=1, p(M)=0
In order to estimate M and a, Eq1 is converted into log form (Eq 2).
a
p
log
M
-t
t
(t)
log
=
Eq 2In order to yield the value of constant a (elasticity of scrappage in terms of sales in the year t),Eq 2 can be
converted as Eq 3. Supposing M (the maximum length year for a passenger vehicle) is fixed, various
combinations of vehicle age at the year 2005 (t) and survival rate p(t) yields various results of log a.
t
t
M
t
p
a
log
(
)
log(
)
log
=
−
Eq 3In order to yield the value of M (Maximum length of years for a passenger vehicle),Eq2 can be
converted as Eq 4. When log a is fixed, various combination of t and p(t) yields various results of M.
a
log
p(t)
log
t
-t
M
=
Eq 4Average value of various results of log a is expressed as
A
(Eq 5). Average value of various results ofM is expressed as
M
(Eq 6). Average valueA
is supposed to be equal to the fixed value log a. Averagevalue
M
is supposed to be equal to the fixed value M. The simultaneous equations (Eq 5 and Eq6)estimate log a and M.
∑
∑
⎟
⎠
⎞
⎜
⎝
⎛
−
=
t tt
t
p
n
M
t
p
A
log
(
)
1
log
(
)
n
1
- 11 -
∑
∑
⎟⎟
⎠
⎞
⎜⎜
⎝
⎛
−
=
tt
p
t
t
n
A
t
M
)
(
log
1
n
1
Eq 6A
: Average value of various results of log a (elasticity varies by country and by year.)M
: Average value of various results of M (Maximum length year for a passenger vehicle.)n: the number of new car sales
Using of the results of Eq 5 and Eq 6, Figure 3-1 shows the survival curves of four ASEAN countries.
3
Thailand Malaysia
[image:12.595.109.517.266.596.2]Indonesia Philippines
Figure 3-1 Survival Curves of Passenger Vehicle (Maximum length year = 30 years)
By using the survival rate of vehicles in the year 2000 by country, Figure 3-2 shows the estimation of car
stock by vehicle age in four ASEAN countries in the year 2004. Figure 3-3 shows the estimation of total
passenger vehicle stock by emission regulation in four ASEAN Countries with an assumption of new car
- 12 -
Assuming the durability of a vehicle to be 30 years in ASEAN countries, the share of vehicles controlled
by emission regulations (Euro 4) varies by country. While a half of the passenger vehicles are
uncontrolled by emission regulations by the year 2015 in Philippines and Indonesia, a half of the
passenger vehicles are controlled by the year 2015 in Thailand and Malaysia. Assuming less-efficient
present systems are the norm in the future, the number of problems may increase in line with the
motorization process.
Not only implementation of emission standards for new vehicles, but also regular maintenance and
inspection of vehicle with uncontrolled emissions are effective for emission reductions. For example, the
annual passenger vehicle kilometers travelled (VKT) is 20,000-30,000 km in Thailand, which is longer
distance at 2-3 times than that of Japan. Considering the external costs of health effects from air pollution
and global warming effects, improvements of I/M will be an appropriate measures and cost effective
[image:13.595.140.535.483.685.2]measures for emission reduction from vehicles of uncontrolled emissions.
- 13 -
Figure 3-3 Estimation of Passenger Vehicle Stock by Emission regulation in four ASEAN Countries
4. Proposal for Air Pollution Reduction
In this chapter, the method of air pollution reduction will be proposed from a real-world point of view.
Four ASEAN countries have legislation regarding registration and inspection systems. However,
operation of the registration, I/M (inspection and maintenance) systems and fuel quality monitoring
system used in developing countries are observed to share similar characteristics, such as a weakness
of government initiative and inadequate operation by government bodies, which results from shortages of
human resources and analysis facilities[27][31].
A better operation of inspection system enables used vehicles to be regularly checked for defects in
vehicle parts and improve them by exchanging them for better parts and by tuning. A better operation of
inspection system can definitely phase out high-emission vehicles. According to a GTZ report [17],
- 14 -
did pass. As a successful example, in 2000 a voluntary I/M bus project called the "Blue Sky project" in
Jakarta reduced HC by 49%, CO by 53%, soot by 61%, and increased fuel saving by 5%[55][53].
A better operation of I/M system is based on a better operation of registration system. A better operation
of registration confirms the track record of vehicle registration by year, model, and vehicle age, which
assure tax revenue from the vehicle. Less-efficient operation of registration system allows these four
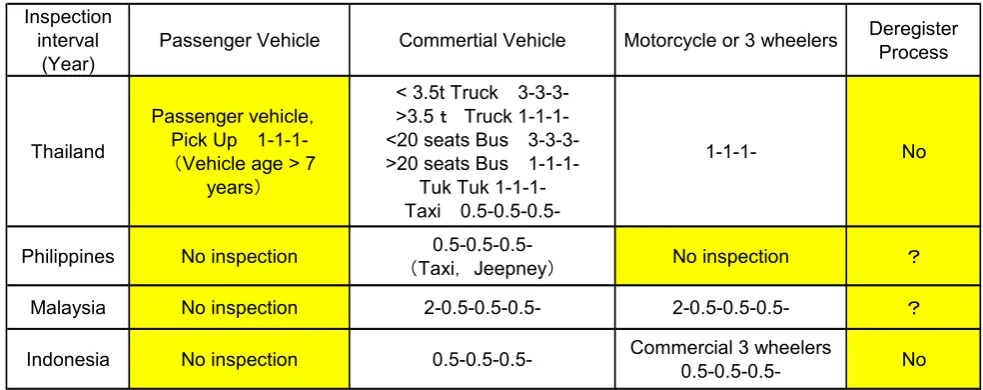
ASEAN countries to keep old vehicles on the road for longer. Table 4-1 shows the type of vehicle
inspections, intervals and deregistration processes. Due to less-efficient operation of registration systems,
the number of inspected vehicles is very limited, so that the system is unable to reflect the overall
emission quality situation in the real world. Less-efficient operation of registration system can hardly
protect consumer rights from recalls and stolen vehicles. The lack of deregistration is another problem
[18][33][42][52] in registration system. Deregistration process can clarify the track record of discarded
vehicle by number and year.
For policy recommendation, operations of registration and deregistration should be improved compared
to that of developed countries. In the future, the better operation of registration system will be essential
for monitoring the vehicle recycle process. It enables us to collect tax revenue properly. It can also
differentiate vehicle tax levels by technical performance.
Another problem is regional differences in technology levels between auto dealers and local factories. In
order to support I/M system, it is necessary to identify the technology level by a nationwide certification
system for engineers, inspectors and mechanics. Four ASEAN countries do not have a nationwide
certification for mechanics so some local private maintenance shops do not have the skill for tuning
- 15 -
maintenance workshop. While car dealers have the knowledge and technology to tune EURO 2 level or
higher vehicles, local factories do not have either knowledge or the technology to tune EURO 2 vehicles.
A nationwide certification system can smoothly guarantee and monitor more stringent emission standards
in the future. With the nationwide certification system, more stringent emission regulation than EURO 2
can be introduced smoothly. The nationwide certification system can create bring a new business of
maintenance shop business.
Inspection interval
(Year)
Passenger Vehicle Commertial Vehicle Motorcycle or 3 wheelers Deregister Process
Thailand
Passenger vehicle,
Pick Up
1-1-1-(Vehicle age > 7 years)
< 3.5t Truck 3-3-3->3.5t Truck 1-1-1-<20 seats Bus 3-3-3->20 seats Bus
Tuk Tuk 1-1-1-Taxi
0.5-0.5-0.5-1-1-1- No
Philippines No inspection (
0.5-0.5-0.5-Taxi,Jeepney) No inspection ?
Malaysia No inspection 2-0.5-0.5-0.5- 2-0.5-0.5-0.5- ?
Indonesia No inspection 0.5-0.5-0.5- Commercial 3 wheelers
[image:16.595.74.566.271.466.2]0.5-0.5-0.5- No
Table 4-1 Vehicle Type for Inspection, Interval* and Deregister Process in four ASEAN Countries
* Valid period until next inspection. Number shows "First inspection year-Second inspection year-Third inspection year". Ex) 1-1-1- : Annual inspection
Data sources: JARI-UN conference [42] AIT[12],Ministry of Industry, Indonesia[18] Aminuddin [33]JASIC[40][41]Ovasith[52]
Hearing from related institutes
The delay of more stringent emission regulation introduction is caused by a short supply of appropriate
fuel quality [28][38]. The more conformed fuel quality (EURO2, 3 and 4), less supply. The following three
examples show the results of fuel quality monitoring. First, the fuel monitoring results for lead content,
obtained by the Ministry of Environment in Indonesia and an Indonesian environmental NGO called
- 16 -
In 2003 and 2004, prior to its introduction, all samples (number of samples = 31 per year) were observed
to meet the lead standard at national level. In 2005, after the introduction of EURO 2, 12 out of 31
samples were noted to have exceeded the lead standard at national level.
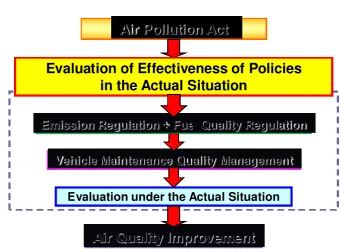
How to assure air quality improvement under the different share of vehicle types in four ASEAN
countries? After an air pollution act, vehicle emission and fuel quality regulations are introduced, and
policies of monitoring such as better operation of monitoring systems like registration, inspection, fuel
quality monitoring and air quality monitoring should be introduced[28][29][31]. Based on a simulation of
emission volume from these policies[5], it is necessary to evaluate if the total emission volume can be
below the standards. (Figure 4-1)
Air Pollution Act
Air Quality Improvement
Vehicle Maintenance Quality Management
Emission Regulation + Fuel Quality Regulation
Evaluation under the Actual Situation
[image:17.595.145.487.391.643.2]Evaluation of Effectiveness of Policies
in the Actual Situation
Figure 4-1 How to Assure Air Quality Improvement?
- 17 -
should be measured as quantitative data. By modeling a typical driving cycle with quantitative data, the
total emission volume in the air quality is estimated in the simulation. From the results of the emission
simulation, the main problem from mobile sources can be estimated. After the problem estimation, a list
of countermeasures can be listed as potential policies. From the list of countermeasures, the potential
policies need to be revised at the activities level and prioritized from the point of cost performance, health
impact and other criteria. Finally, the best solution with regard to the actual situation will be proposed to
support the political recommendation.
5. Conclusion
In order to reduce automobile emissions, governments of four ASEAN countries have been making
efforts to introduce vehicle emission regulations. It is also necessary to adjust the fuel property to render
it suitable for the technology level of the emission reduction equipment that is used for after-treatment.
Vehicle emission performance has detrimental effects on air quality, and consumers then have to cover
the costs related to vehicular problems.
As a first step, this paper is an attempt to estimate passenger vehicle stock by emission regulations in
four ASEAN countries. The estimation of passenger car ownership by emission regulations is successful
in estimating scrappage within the limits of data availability. The results show that early implementation of
emission regulations for new vehicles is important. Taking into consideration a large share of uncontrolled
vehicles in the vehicle market in the estimation results, better operation of fuel quality monitoring systems,
registration systems and I/M systems should support vehicle emission regulations and fuel quality
standards.
- 18 -
improve air quality because four ASEAN countries are faced with different problems due to different
shares of vehicle type and different emission regulation levels.
Fortunately, Japan has many experiences with air pollution and much accumulated know-how. This
knowledge and technology should be transferred to four ASEAN countries to ensure that they do not
- 19 -
Reference
[1]AEM-METI, 2007, Follow-up Document, paper presented at the 10th Meeting of AEM-METI Economic
and Industrial Cooperation Committee Working Group on Automobile Industry, Working Group on
Automobile Industry (AMEICC WG-AI), Jakarta.
[2]Asian Clean Fuel Association (ACFA), 2007, ACFA News, 4.
[3]Alam Sekitar Malaysia Sdn, Air Quality Monitoring in Malaysia, 2006, paper presented at Better Air
Quality 2006 organized by Asian Development Bank, Yogyakarta.
http://www.cleanairnet.org/caiasia/1412/article-71294.html
[4]Alfa Research Co.,Ltd., 2006, Thailand in Figures 2005-2006, 11th Edition, Bangkok, 210-228.
[5]Asian Development Bank, 2002, Indonesian Multisectoral Action Plan Group on Vehicle Emission
Reduction,Reducing Vehicle Emissions, (Discussion Draft) RETA 5937, Aian Development Bank, Manila.
[6]Asian Automotive Federation (AAF), 2004, AAF Proposal of the Fuel Specification, paper presented at
at the 7th Meeting of AEM-METI Economic and Industrial Cooperation Committee Working Group on
Automobile Industry, AMEICC Working Group on Automobile Industry (AMEICC WG-AI), Siem Reap, 7-8.
[7]Asian Automotive Federation (AAF), 2008, Emission & Fuel Schedule, ANNEX 2 WG1 – 2/3 (8th
AAF/TC3), Jakarta.
[8]Asian Development Bank (ADB), 2006, Country Synthesis Report, Urban Air Quality Management:
Indonesia, ADB, Manila, 7-8.
[9]Asian Development Bank (ADB), 2006, Country Synthesis Report, Urban Air Quality Management :
Malaysia, ADB, Manila.
- 20 -
Philippines, ADB, Manila.
[11]Asian Development Bank (ADB), 2006, Country Synthesis Report. Urban Air Quality Management :
Thailand, ADB, Manila.
[12]Asian Institute of Technology (AIT), Registration system in Thailand.
http://www.ait.ac.th/AIT/faculty/living/transpo.html
[13]Badan Pusat Statistik (BPS), 2003 and 2005/2006, Statistical Year Book,BPS, Jakarta.
[14]Badan Pusat Statistik (BPS), 2004, Transportation and Communication Statistics, BPS, Jakarta,
122-123.
[15]Badan Pusat Statistik (BPS), 2004, Environmental Statistics of Indonesia,BPS, Jakarta, 91-96.
[16]Berkovec, J., 1985, Forecasting Automobile Demand Using Disaggregate Choice Models,
Transportation Research-B, 19B-4, 315-329.
[17]Cooperatión Téchnica Alemana (GTZ), 2005, El Impacto Ambiental de la Revisión Téchnica
Vehicular: Au Aporte en el Control de Emisiones Vehiculares Contaminantes, Estudio Realizado para
Gran área Metropolitana de Costa Rica. Periodo, GTZ, San Jose, Costa Rica, 12-20.
[18]Directorate General for Transportation Equipment and ICT industries, Ministry of Industry Indonesia,
2005, Vehicle Registration Procedure, Interview document.
[19]European Automobile Manufacture Association (ACEA), 2006, Worldwide Fuel Charter, Fourth
Edition, 1-41.
[20]FOURIN, Oct. 2007-May.2008, Monthly Report on the Asian Automotive Industry. (in Japanese).
FOURIN, Nagoya.
- 21 -
Board, Washington, D.C. , 1-34.[22]Health Effects Institute (HEI), 2004, Health Effects of Outdoor Air Pollution in Developing Countries
of Asia: A Literature Review, HEI, 2004, 1-69.
[23]HIROTA, K., 2005, Automobile Fuel Quality Improvement (Report of JARI project 2004), paper
presented at the 8th Meeting of AEM-METI Economic and Industrial Cooperation Committee Working
Group on Automobile Industry, AMEICC Working Group on Automobile Industry (AMEICC WG-AI),
Kuching, Malaysia.
[24]HIROTA, K., 2007, Better Air Quality, paper presented at the 10th Meeting of AEM-METI Economic
and Industrial Cooperation Committee Working Group on Automobile Industry, Working Group on
Automobile Industry (AMEICC WG-AI), Jakarta, Indonesia.
[25]HIROTA, K., 2006, Review of Lead Phase Out for Air Quality Improvement in the Third World Cities
Lessons from Thailand and Indonesia; Studies in Regional Science, The Japan Section of the Regional
Science Association (JSRSAI), Tokyo, Vol.36 No.2, 527-541.
[26]HIROTA, K., 2006, Introduction of FQM regulation and system -the Case of Japan, paper presented
at ADB Workshop Developing Fuel Quality Roadmap in Asia, Asian Development Bank, Manila.
[27]HIROTA, K., 2007, Fuel Quality Monitoring System in Asia, JARI Research Journal, JARI, Tokyo,
Vol.29, No.2, 27-30.
[28]HIROTA, K., Report on JARI Thailand Roundtable. -Clean Air, Clean Fuels and Clean Vehicles- JARI
Research Journal, JARI, Tokyo. Vol.29, No.7, 55-58
[29]HIROTA, K., 2008, Report on JARI Indonesia Roundtable. -Efforts for Air Pollution Reduction- , JARI
- 22 -
[30]HIROTA, K., 2007, Passenger Car Ownership Estimation toward 2030 in Japan -BAU Scenario with
Socio-Economic Factors-; Journal of Studies in Regional Science, JARI, Tokyo, Vol.37, No.1, 25-39.
[31]HIROTA, K., 2008, Report on the 10th Meeting of AEM-METI Economic and Industrial Cooperation
Committee Working Group on Automobile Industry (AMEICC WG-AI), JARI Research Journal, JARI,
Tokyo, Vol.30, No.2, 21-26.
[32]International Energy Agency, 2002-2007, IEA Energy Balance Non-OECD Countries, OECD, Paris.
[33]Ishak, Aminuddin, 2001, Vehicle Inspection in Malaysia, presented at GITE Workshop on Inspection
and Maintenance policy in Asia, UN-JARI, Bangkok.
[34]Japan Automobile Manufacturers Association, Inc. (JAMA), 1980-2005, Automobile Statistics of
Developed Countries, JAMA, Tokyo.
[35]Japan Automobile Manufacturers Association, Inc. (JAMA), 1990-2004, Motor Industry of Japan,
JAMA, Tokyo.
[36]Japan Automobile Manufacturers Association, Inc. (JAMA), 2008, World Motor Vehicle Statistics,
Vol.7, JAMA, Tokyo.
[37]Japan Automobile Research Institute, 2007, JARI Database.
[38]Japan Automobile Research Institute, 2008, JARI Indonesia Roundtable, JARI, Jakarta.
http://www.jari.or.jp/en/rt_en/rt0806_en.html
[39]Japan Automobile Research Institute, 2008, JARI China Roundtable, JARI, Shanghai.
http://www.jari.or.jp/en/rt_en/rt0806_en.html
[40]Japan Automobile Standards Internationalization Center (JASIC), 2002, System Related to Motor
- 23 -
[41]Japan Automobile Standards Internationalization Center (JASIC), 2005, The 10th JASIC Asia
Government / Industry Meeting, Kuala Lumpur, Malaysia.
[42]Japan Automobile Research Institute-United Nations, 2001, GITE Regional Workshop on Inspection
and Maintenance Policy in Asia, Bangkok.
http://www.iisd.ca/csd/csd9/24tuesday.html
[43]JETRO database, 2007, JETRO, Tokyo.
http://www3.jetro.go.jp/jetro-file/country.do
[44]Kenworthy, J., and F.B. Laube., 2000, The Millennium Cities Database for Sustainable Transport,
Union Internationale des Transport Publique (UITP), [CD-ROM].
[45]Land Transport Office in Philippines, New Motor Vehicle Registration.
http://www.lto.gov.ph/docreq.html
[46]National Statistical Coordination Board (NSCB), 2003, Philippines Statistical Yearbook, NSCB,Manila,
13-6.
[47]National Statistical Office, Ministry of Information and Communication Technology, 2006, Statistical
Yearbook Thailand, National Statistical Office, Bangkok.
[48]Okamoto, T., T. Miyashita., Y. Ohsawa., and M. Nakamura, Car Demand Forecast (in Japanese),
Sophia University Socio-Economic Research Institute, Tokyo, 147-151.
[49]Ostro, B., 1994, Estimating the Health Effects of Air Pollutants, Policy Research Working Paper, 1301,
Washington D.C., The World Bank.
[50]Park, R. W., 1977, Determinants of Scrapping Rates for Postwar Vintage Automobile, Econometrica,
- 24 -
[51]Park, R. W., 1979, Durability, Maintenance and the Price of Used Assets, Economic Inquiry, 197-217.
[52]Phimphun, O., 2002, A Government Vehicular Agency and a Role to Control Air Pollution,
Engineering and Safety Bureau, Department of Land Transport, Bangkok, Thailand, personal contact.
[53]Sager, H.,2001, Clean Air Project Final Report CAP II, Swisscontact, Jakarta.
[54] Statistical Bureau of Mayalsia, Statistical Yearbook of Malaysia.
[55]Stechdaub and Restiti, 2001, Inspection and Maintenance in Indonesia, paper presented at GITE
Regional Workshop on Inspection and Maintenance Policy in Asia, Bangkok.
[56]Walker, F. V., 1968, Determinants of Auto Scrappage, Review of Economics and Statistics, 503-506.
[57]World Health Organization (WHO), 2002, The World Health Report 2002: Reduction Risk, Promoting
healthy life, WHO, Geneva.
[58]World Bank, 2003, Indonesia Environment Monitor, World Bank, Jakarta, 7-19.
[59]World Bank, 2002, Thailand Environment Monitor, World Bank, Bangkok.