Fruit Fly Optimization Algorithm for Travelling
Salesperson Problem
Nitin S. Choubey,
Ph.D. Professor & Head,Department of Computer Engineering, SVKM’s NMIMS, MPSTME, Shirpur
ABSTRACT
The Fruit-Fly Optimization Algorithm (FFOA) is an algorithm with a potential to solve the complex optimization problems. It is based on the behavior of Fruit-Fly to search for its solution. The search pattern of Fruit Fly, Drosophila, involves two main functions viz Smell and Vision. The paper proposes different variants of Vision function and Smell function of Fruit-Fly and evaluated them for solutions of Travelling Salesperson problem.
General Terms
Algorithm, Optimization, Searching.
Keywords
Fruit-Fly Optimization Algorithm, Travelling Salesperson Problem, Sensitive Vision, Smell Concentration.
1.
INTRODUCTION
[image:1.595.315.537.257.428.2]„Travelling Salesperson Problem‟ (TSP) is to find out the tour of minimum cost [1] which calculates the sum of the cost through the edges on the tour. A Tour is a directed simple cycle that includes every vertex in V. The travelling sales person problem finds application in the various areas ranging from the robot arm motion for tightening screws in assembly line to finding the optimum route to deliver the packets by a delivery van The objective in each of these applications is to get the minimum cost route. It is a typical problem of combinatorial optimization. The problem is already proven in the category of NP-Hard Problem. Potvin [2] presents survey of Genetic Algorithm (GA) approaches for the general TSP. GA Suffers with the problem of premature convergence. An approach to solve the Fruit-Fly algorithm is an intelligent search algorithms based on foraging behaviors of the Fruit-Fly [3], Drosophila (see Fig.1). The application of FFOA varies from several areas such as controlling of PID [4], forecasting power load [5][6], Analysis of service satisfaction in web auction logistics service [7], modeling of financial distress [8] to Vehicle routing problem[9]. Fuqiang[10] introduced improvement in Fruit-Fly Algorithms for bi-variable function. The Fruit-Fly Optimization Algorithm (FFOA) introduced by Pan [8] has immense potential to deal with the variety of complex optimization problems. These processes are Smell and Sensitive Vision. Through Smell process, Fruit-Fly smells the food source available in the surrounding by osphresis organ, which is a function of stochastic in nature, and fly towards the corresponding location.
Fig. 1. The Fruit Fly, Drosophila
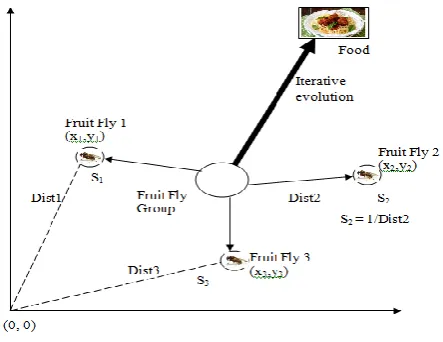
[image:1.595.87.249.693.752.2]Some Fruit-Fly‟s can smell food resources from the distance of 40 KM also [11]. Whereas, through sensitive vision, it try to finds and fly towards a better site with respect to food, it is simulated by following the pattern of the fly which more near to the solution in the swarm. The procedure of a Fruit-Fly group‟s food finding behavior is illustrated in the fig. 2 [3][5]
Fig. 2. Group iterative foraging process of Fruit-Fly.
The procedure of the original FFOA as summarized in Li et.al. [5] is given below.
Step 1: Randomly initialize the location of the Fruit-Fly swarm.
Step 2: Each individual searches for food in a random direction and distance around the swarm location using osphresis to generate a new population. Step 3: Evaluate all the new individuals.
Step 4: Identify the best Fruit-Fly with the maximum smell concentration value (i.e. the best objective), and then the Fruit-Fly group flies towards the best location utilizing vision.
Step 5: End the algorithm if the maximum number of iterations is reached; otherwise, go back to Step 2. The paper proposes different variants of Vision and Smell functions and present their comparison for the case of Travelling Salesperson Problem [12].
2.
PROPOSED FFOA FOR TSP
The proposed FFOA for TSP is given below
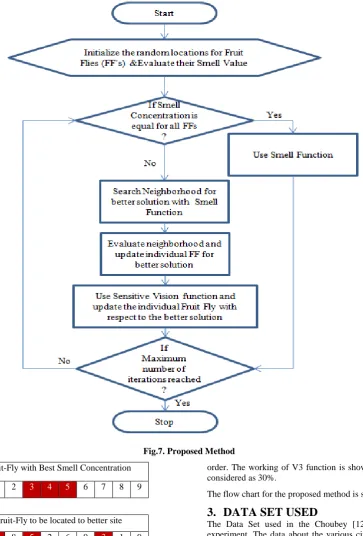
1. Initialize the random Fruit Fly/Solutions swarm and evaluate the distance travelled (Smell Concentration Value) over the cities with the individual fly instance.
value in the neighborhood, Repeat Step 3, 4 & 5 Otherwise.
3. Search the neighborhood for better solution by Smell function.
4. Evaluate the neighborhood and update individual Fruit Fly with respect to the new solutions.
5. Use Sensitive Vision function and update the individual Fruit Fly with respect to the better solution (Fly with Maximum Smell Concentration Value).
6. If the maximum number of iterations is reached “End the Process”, go to step 2 otherwise.
Each Fruit-Fly is represented as a solution to the TSP. The encoding used for the Fruit-Fly is the sequence of the cities visited. The smell concentration is the cost of traveling from the initial city to the same city by visiting all the cities in the sequence. The sample sequence for nine cities is given in Fig. 3.
[image:2.595.332.521.127.275.2]1 2 3 4 5 6 7 8 9 Fig.3. Encoding Scheme
2.1
Smell Functions
The Smell function is considered randomly generated variant of the Fruit-Fly encoding with Bit Mutation Operator. The bit mutation operation is shown in Fig.4. Here, two cells from the randomly selected locations in the encoding are swapped with each other. Two different variant of the neighborhood search are proposed for implementation of the Smell function. The first variant, Best Neighbor Method (S1), NN number of different version of the Fruit-Fly‟s are generated and the Fruit-Fly is updated with the best amongst the entire versions. In the second version, Incremental Neighbor Method (S2), NN number of different versions is generated and the Fruit-Fly is location is updated, wherever a better neighbor is found. The immediate next neighbor after updating Fruit-Fly is obtained from the newly updated Fruit-Fly.
1 2 3 4 5 6 7 8 9
[image:2.595.80.248.294.322.2]1 2 7 4 5 6 3 8 9 Fig. 4. Bit Mutation Operator
2.2
Sensitive Vision Functions
The Sensitive Vision Function is represented by replacing the „Vr‟ proportion (10%-50%) of the Fruit-Fly with Best Smell Concentration in the remaining Fruit-Flies. Vr is considered as
the perception of the Fruit-Fly with Best Smell Concentration by the other Fruit-Flies available in Swarm. Higher value of Vr may lead to Local Optima convergence. Three different versions of this vision functions are proposed for the implementation of Sensitive Vision Function.
Fruit-Fly with Best Smell Concentration 0 1 2 3 4 5 6 7 8 9
Fruit-Fly to be located to better site 7 4 8 5 2 6 0 3 1 9
Updated Fruit Fly
[image:2.595.333.521.417.580.2]7 4 8 5 0 6 1 3 2 9 Fig.5. Sensitive Vision Function, V1
2.2.1
V1 FUNCTION
Initial cells proportionate to „Vr‟ are selected from the Fruit-Fly with best smell concentrations and replace with their respective locations in each Fruit-Fly in the same order. The working of V1 function is shown in Fig.5. „Vr‟ is considered as 30%.
2.2.2
V2 FUNCTION
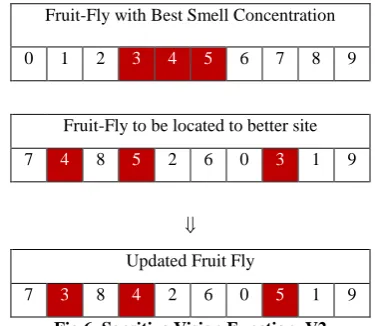
Cells, in proportionate to „Vr‟, starting with random location are selected from the Fruit-Fly with best smell concentrations and replace with their respective locations in each Fruit-Fly in the same order. The working of V2 function is shown in Fig.6. „Vr‟ is considered as 30%.
Fruit-Fly with Best Smell Concentration 0 1 2 3 4 5 6 7 8 9
Fruit-Fly to be located to better site 7 4 8 5 2 6 0 3 1 9
Updated Fruit Fly
[image:2.595.85.249.490.560.2]Fig.7. Proposed Method
Fruit-Fly with Best Smell Concentration 0 1 2 3 4 5 6 7 8 9
Fruit-Fly to be located to better site 7 4 8 5 2 6 0 3 1 9
Updated Fruit Fly
7 3 4 5 8 2 6 0 1 9 Fig.8. Sensitive Vision Function, V3
2.2.3
V3 FUNCTION
Cells, in proportionate to „Vr‟, starting with random location are selected from the Fruit-Fly with best smell concentrations and replace in the same sequence, starting with the first cell from the contents of the source, in each Fruit-Fly in the same
order. The working of V3 function is shown in Fig.8. „Vr‟ is considered as 30%.
The flow chart for the proposed method is shown in fig. 7.
3.
DATA SET USED
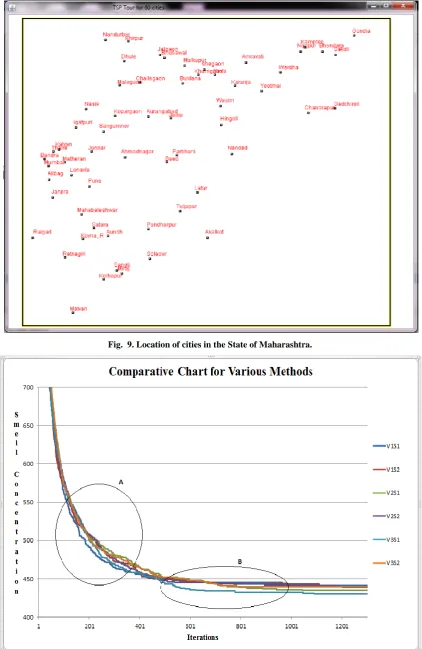
The Data Set used in the Choubey [12] is used for the experiment. The data about the various cities in the State of Maharashtra from India is used in the experiment. The data (Latitude & Longitude) about the location of the cities is taken from http://www.mapsofindia.com/lat_long/ Maharashtra/. The data set of the cities used for experiment is given in Fig. 9.
4.
EXPERIMENTAL SETUP AND
RESULT ANALYSIS
Fig. 9. Location of cities in the State of Maharashtra.
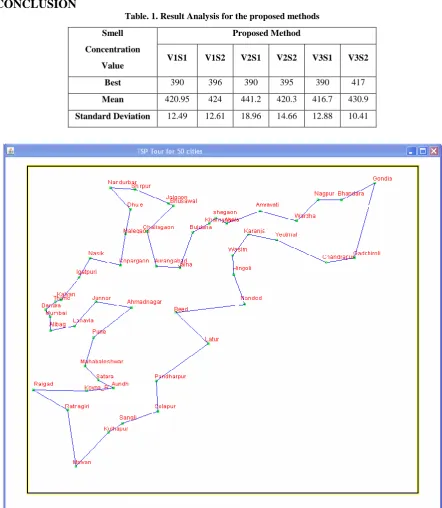
Fig. 10 shows the comparison of Result obtained by the variants used in experiment. The average of fifteen consecutive runs is considered for the purpose of comparison. Further result analysis with Best, Mean and Standard Deviation values for the proposed methods is shown in table 1. It is found that the Sensitive Vision V1 with the Smell Function approach, Best Neighbor Method S1 has found to be the best in searching through solution space (as shown in fig.10-A) where as The Sensitive Vision V3 with the Smell Function approach, Best Neighbor Method S1 is found to converge to the better solution (as shown in fig.10-B) for the city samples selected in the experiment. The result obtained for 50 (fifty) Number of Cities is shown in fig. 11. The methods found to converge at local optima.
5.
CONCLUSION
[image:5.595.75.518.226.735.2]Two variants of Sensitive Vision and Three variants for Smell functions have been proposed in the paper. It is found that the smell function Best Neighbor Method (S1) has resulted in to earlier convergence as compared to the Incremental Neighbor method. The Sensitive Vision function V1 and V3 found to be comparatively effective in exploration of the search space and finding global optima respectively. The methods discussed in the paper have been applied to the instances of small number of cities. The future work can be extended for application of these methods for complex scenario, for finding the appropriate rate for Vr and the suitable value for neighborhood (NN) to be searched in making the Smell function more effective. It is also suggested to work on avoiding the local optima convergence.
Table. 1. Result Analysis for the proposed methods
Smell
Concentration
Value
Proposed Method
V1S1 V1S2 V2S1 V2S2 V3S1 V3S2
Best 390 396 390 395 390 417
Mean 420.95 424 441.2 420.3 416.7 430.9
Standard Deviation 12.49 12.61 18.96 14.66 12.88 10.41
6.
REFERENCES
[1] Horowitz E., Sahani S, and Rajasekaran S, 2007, Fundamentals of Computer Algorithm, University Press, 2007.
[2] Potvin J.Y., 1996, Genetic algorithms for the travelling salesman problem, Annals of Operations Research, 339-370, 1996.
[3] Peng Zhang, Ling Wang, 2013, An Improved Fruit Fly Optimization Algorithm for Solving Lot-streaming Flow-shop Scheduling Problem, The 3rd International Workshop on Advanced Computational Intelligence and Intelligent Informatics, Shanghai, IWACIII 2013. [4] Han J, Wang P, Yang X., 2012, Tuning of PID controller
based on fruit fly optimization algorithm. International Conference on Mechatronics and Automation (ICMA), 2012, 409-413.
[5] Li H., Guo S., Li C., Sun J., 2013, A hybrid annual power load forecasting model based on generalized regression neural network with fruit fly optimization algorithm. Knowledge-Based Systems, 2013, 37: 378-387.
[6] Li H., Guo S., Zhao H., Su C. & Wang B., “Annual Electric Load Forecasting by a Least Squares Support Vector Machine with a Fruit Fly Optimization Algorithm”, Energies 2012, 5, 4430 - 4445, doi: 10.3390 / en 5114430.
[7] Lin S. M., 2013, Analysis of service satisfaction in web auction logistics service using a combination of fruit fly optimization algorithm and general regression neural network. Neural Computing & Applications, 2013, 22(3-4): 783-791.
[8] Pan W T., 2012, A new fruit fly optimization algorithms: taking the financial distress model as an example. Knowledge-Based Systems, 2012, 26(2): 69–74. [9] Sandeep Kumar, Vineeta Bassi, “Modified Fruit Fly
Min-Max Single Depot Vehicle Routing Algorithm (MFFVRP)”, Proceedings of 6th
International Conference, Bangalore, India, June 2014, 67-72. [10]Fuqiang Xu & Youtian Tao, “The Improvement of Fruit
Fly Optimization Algorithm- Using Bivariable Function as Example”, Proceedings of the second International Conference on Computer and Information Application (ICCIA-2012), 2012, 1516-1520.
[11]Chen P. W., Lin W. Y., Huang T. H. & Pan W. T., “Using Fruit Fly Optimization Algorithm Optimized Grey Model Neural Network to Perform Satisfaction Analysis fore-Business Service”, Applied Mathematics & Information Sciences, 7 No 2L, 459-465, 2013. [12]Choubey N. S., 2012, Solving TSP using DARO,