Munich Personal RePEc Archive
Evaluating the Efficiency of Vietnamese
Banking System: An Application Using
Data Envelopment Analysis
Ngo, Dang Thanh
University of Economics and Business, Vietnam National
University-Hanoi
10 May 2010
Online at
https://mpra.ub.uni-muenchen.de/27882/
Evaluating The Efficiency Of Vietnamese Banking System
An Application Using Data Envelopment Analysis
♣WP.2010.03
Dang-Thanh, Ngo♥
Abstract
Over the last twenty years in Vietnam, the financial system in general and the banking system in particular had been transferred from a monopoly system into a diversified system which allows all participants to compete fairly and effectively.
Within these past years, the banking system in Vietnam did gradually developed in number of banking institutions, size of the banking sector in the economy, amount of credits for the economy, and amount of other banking services as well.
Along with the development of the banking system in number, size, asset value, deposit, credit and debit account, ATM/POS, interest rates, etc. which attracted more and more customers using the banking’ services; the efficiency of the banking system also has been increasing.
So far, there is still a lack of research on the efficiency of the banking sector in Vietnam over the decades. Several researches were conducted, however, due to the data limitation, these researches were just small steps at the big front gate. This paper, which focuses on evaluating the efficiency of bigger sample size of Vietnamese commercial banks in the year of 2008, tends to make a contribution to this progress.
The DEA approach allows this paper to evaluate the efficiency of 22 Vietnamese commercial banks in using their inputs in 2008 (these banks were ranked top in the banking industry in Vietnam – VNR5001 in 2009). After analyzing, the research comes to a conclusion
that although the efficiency of these banks is averagely high, however, there is still an opportunity to improve this indicator.
This paper is a development from Ngo (2010b).
PhD Candidate, Center for Banking Studies, Massey University, New Zealand.
1 VNR500 is the Vietnam Top 500 Largest Enterprises by Revenue Ranking Board, similar to the Fortune 500 Model.
1. Introduction
Along with its integration into the World Trade Organization (WTO), the banking system of Vietnam is having a lot of changes. These changes were the results of the financial liberalization which was started from the early of the nineteen nineties (Ngo, 2004). Over these last twenty years in Vietnam, the financial system in general and the banking system in particular has been transfer from a monopoly system into a diversify system which allow all participants to compete fairly and effectively. More banks were established (included foreign banks and branches), and more banking services were provided. In overall, the customers now are having a lot more opportunities in satisfying their needs.
Although there were many positive changes had been made to the banking sector, however, there were several negative ones as well. The positive side may include the freedom of banks in their decisions and activities, the increasing of deposit over Gross Domestic Products (GDP), the increasing in number of foreign financial and banking institutions in Vietnam, etc. The negative side may include the number of bankruptcy institutions, the unstable of the system (proofed by the liquidation crisis at the end of 2008 or the high non-performance loans ratio), etc. Thus, it is important to answer the question of what is the current efficiency of the banking system in Vietnam, and from that, a clearer view on the Vietnamese banking system will be revealed.
So far, there is still a lack of research on the efficiency of the banking sector in Vietnam over the decades. It was not only the lack of research from foreign researchers, which of course feel difficult in accessing the data of Vietnamese banks (it is always difficult to get any data from any financial institutions because these data are confidential – except things from the Annual reports), but also was the lack of research from Vietnamese ones as well. Therefore, the aim of this paper is to provide an empirical research on the efficiency of the Vietnamese banking system in the year of 2009 in order to get a brief view of how efficient the banking system is, and what need to change to improve the performance of this sector.
This paper will be structured as follows: Section 2 gives an overview on the banking system of Vietnam over the past twenty years; Section 3 describes the literature on measuring efficiency of the banking sector in Vietnam, which is still limited; Section 4 describes the methodology of using nonparametric approach in measuring efficiency; Section 5 expresses the data which is used for the research; Section 6 presents the empirical results of the research and the conclusions will be made in Section 7.
2. Overview of the Vietnamese banking system
tool. Just after 1986, changes were made in the banking system’s operations, and the new mechanism of banking operations was built up and gradually improved.
Almost economists agreed that the financial liberalization was started from May 1990, when the two important Decrees were announced: one was the Decree on the State Bank of Vietnam; and the other was the Decree on Banks, Credit cooperative and Financial companies2
. These two Decrees in fact divided the Vietnamese financial system from monopoly (or one-tier) system into two-tier system, in which SBV now mainly acted as a central bank, while other banks and financial companies can have independently freedom to be established, acted and even closed. Since then, the financial and banking system developed rapidly, which made the number of banking institutions in Vietnam reached 95 at the end of 2008 (beside 5 State-owned Commercial Banks and 1 Social Bank, 89 were private commercial banks in which 5 were foreign fully owned and 39 were foreign branches)3
.
{Figure 1 here}
Within these past years, the banking system in Vietnam did gradually developed in number of banking institutions, size of the banking sector in the economy, amount of credits for the economy, and amount of other banking services as well. At the end of 2008, the amount of capital mobilized through the banking sector was 22.87 percent (it was in fact nearly 50 percent in 2007, but decreased in 2008 due to the effect of global financial crisis), in which capital mobilized through State-Owned Commercial Banks (SOCBs) was decreasing and capital mobilized through other commercial banks was increasing (SBV, 2008); hence, the amount of domestic credits that banking sector provided to the economy was nearly comparable with total GDP (ADB, 2009). Table 1 will show some of the development of the Vietnamese banking sector over this period.
{Table 1 here}
The increasing of total liquidity of the economy (SBV’s definition), or broad money M2 (ADB’s definition) over total Gross Domestic Product showed that the financial deepening was raised rapidly, account for more than the GDP itself at the end of 31st December 2008. More
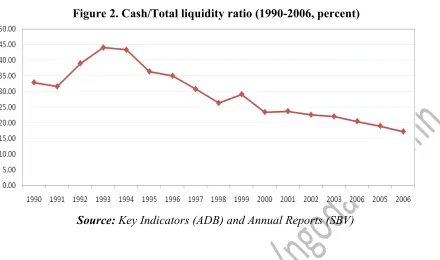
important, ratio of cash over total liquidity was reduced in the mean time, which proofed that financial activities regarding cash were being replaced by activities regarding non-cash payments such as ATM/POS, checks, credit and debit cards, banking transactions, online payments, etc. (see Figure 2). This fact, so far, was the result of the development of the banking system in Vietnam in providing banking services to customers as well.
{Figure 2 here}
2 However, as Nguyen (2008) suggested, the starting point may be earlier, from 1988. And as for Le (2006), banking
reform/liberalization had been undertaken since 1986.
3http://www.sbv.gov.vn/en/Baocaothuongnien/html/2008/en/index.htm For a detail list (in Vietnamese), go to
3. Literature review on measuring efficiency of banking system in Vietnam
On the development and liberalization of the Vietnamese banking system as well as its efficiency, only a few researches were conducted so far.
Firstly, there are the Annual Reports from SBV4. In these reports, the World and
Vietnamese economy are both concerned, in which the Vietnamese indicators such as production, export and import, labor and employment, inflation and monetary policy, etc. are more focused. However, these statistical data is at a macro-level, therefore only show the general situation of the Vietnamese financial market at national level, not at sectoral or institutional level. Therefore, it is difficult to make conclusion on the efficiency of individual bank or of the banking system in Vietnam.
Secondly, there are reports of global institutions such as the World Bank (WB), the International Monetary Fund (IMF), the Asian Development Bank (ADB), World Development Indicator (WDI), etc. including the Annual Reports from WB and IMF5, or Key Indicators from
ADB6. Despite the fact that these data may useful in researching about the banking sector in
Vietnam, efficiency aspect is totally not noticed.
Thirdly, researches from individual researchers and non-profit institutions are highly concerned. These researchers usually dig into the liberalization process of the Vietnamese financial system as well as banking sector (Le, 2006; Ngo, 2004, 2009a); or focused on measuring the efficiency of the Vietnamese commercial banks (Ngo, 2010b; V. H. Nguyen, 2007); or even tried to use bootstrapping technique to improve the Malmquist productivity index for these banks (X. Q. Nguyen & DeBorger, 2008).
In his discussion paper, Le (2006) argued that numbers of banking regulations had been issued since 2005 in order to improve the soundness of the banking system and equitize (privatize) the big SOCBs in Vietnam. However, due to the poor sequencing banking reforms, “Vietnam’s banking system is quantitatively and qualitatively inadequate” (Le, 2006). Hence, the efficiency of Vietnamese banking system in Le view was not high as of 2006. This was supported by Nguyen (2007).
In 2007, Nguyen conducted a research on 13 commercial banks in Vietnam for the period of 2001-2003. This research focused on the efficiency performance of these 13 Vietnamese commercial banks in terms of efficiency change, productivity growth, and technological change. In result, the author found that these banks were inefficiency in both allocative (regulatory) and technical (managerial capacity) matter, in which the technical inefficiency was more serious. It meant the problem of increasing the efficiency in using inputs of Vietnamese banks is more
important than the problem of increasing efficiency in choosing the right mix of these inputs (V. H. Nguyen, 2007).
There was also a discussing paper which was presented at the “Asia-Pacific Productivity Conference 2008” concerning the efficiency and productivity of 15 commercial banks in Vietnam (included 4 of 5 SOCBs) by Nguyen and DeBorger (2008). The authors argued that their paper “is the first effort to study efficiency and productivity indices for commercial banks in Vietnam” which showed that the productivity of these banks is on a trend of decreasing (X. Q. Nguyen & DeBorger, 2008). However, as they concluded, the bootstrapping result proved that this trend is not significant, and therefore, more details studies are needed as well.
Despite these results, it is clear that future researches on the Vietnamese banking system are still in need, especially in efficiency and performance aspect. Only by improving efficiency, the banking sector of Vietnam can compete fairly with foreign banks in the integration process and in implementing the WTO accessing commitment.
4. Methodology
Efficient or efficiency is a term which is used popularly in many aspects such as economics, technology, social science, etc. In economics, a firm or company is efficient if it can maximize its output using a certain inputs, or in another saying, it reaches the Pareto optimal7. In
the easiest way of understanding, efficiency can be viewed as productivity and is measured by the ratio between output(s) and input(s) which is/are used to produce them.
In Out
P= (1)
in which
P: Productivity (or Efficiency)
Out: Output variables (such as quantity, revenues, profit, etc.)
In: Input variables (such as wages, cost, expense, etc.)
Efficiency, however, is not only productivity but also economy, or value-for-money (SNZ, 2010). Researchers always regard it as economic efficiency, which includes technical efficiency and allocative efficiency (Hall & Lieberman, 2006)8.
There are two ways to measure the efficiency of a bank: parametric and nonparametric approaches. Each approach has its own advantages and shortcomings compare to the other.
The parametric approach tends to focus on production function or cost function of banks, in which the estimated function through regression model can be viewed as an optimal function of the banking system (Banker & Maindiratta, 1988). Thus, it is possible to calculate the
7http://en.wikipedia.org/wiki/Pareto_efficiency 8
efficiency of a certain bank by compare its production or cost level to that optimal level. This parametric estimate bases on a regression model with certain confidence intervals and deviations, therefore, is statistically recognized. In their survey, Berger and Humphrey (1997) summarized that, within the period of 1992-1997, there was about more than 52 percent of researchers preferred using parametric approach in measuring the efficiency of the financial institutions9.
This included Mester (1993); Berger and DeYoung (1996); Peristiani (1997); etc. At the same time, however, the assumption of this estimation10 is very often not tenable, especially when the
scale of measurement (sample size) is small. In this situation, the nonparametric approach was preferred.
The nonparametric approach tends to envelop data collected from sampled financial institutions in order to estimate the optimal production or cost level of the whole sample, then scores each institution by comparing its current level with the optimal one. This approach, therefore, is more flexible compare to parametric approach in analyzing efficiency base on multiple inputs and outputs data (Farrell, 1957; Charnes, Cooper, & Rhodes, 1978; Färe, Grosskopf, & Lovell, 1994; Thomas & Tripe, 2007; etc.) This paper will try to apply the Data Envelopment Analysis (DEA) which is belonged to nonparametric approach to evaluate the efficiency of twenty-two Vietnamese commercial banks in the year of 2009.
Farrel (1957) extended the equation of (1) to the situation of multiple inputs and outputs variables. In this situation, assumed that each Decision Making Unit (DMU) could use x inputs to produce y outputs. Hence, the efficiency of an individual DMU will then generally be defined by the equation:
∑
∑
= k k k m m m x v y uEF (2) or
k k m m x v x v x v y u y u y u EF + + + + + + = ... ... 2 2 1 1 2 2 1 1 (2’) in which
EF: efficiency
u: output weight of y, hence, 0 ≤ um≤ 1
v: input weight of x, hence, 0 ≤ vk≤ 1
For a set of n DMU, the efficiency of the j-th DMU (1≤j≤n)can be calculated by:
9
It was 68 parametric researches out of 130 researches on financial institutions of 21 countries over the period.
10
∑
∑
= k kj k m mj m j x v y uEF (3) or
kj k j j mj m j j j x v x v x v y u y u y u EF + + + + + + = ... ... 2 2 1 1 2 2 1 1 (3’)
By calculating the efficiency of each DMU, DMUs with most efficient (classified as 100% efficient or 1.00 efficiency score) will form a frontier of the envelop sample, and the rest DMU will then are relatively inefficient (lower than 1.00 efficiency score).
Charnes, Cooper and Rhodes (1978) developed the model of Farrel by assumed that there was a constant returns to scale (CRS) situation under an input orientation. In this case, a certain
j0-th DMU can maximize its efficiency by solving the following mathematical problem:
0
,
max uv EFj
subject to (4)
EFj ≤ 1, 1 ≤ j ≤ n
0 ≤ um, vk ≤ 1
where
∑
∑
= k kj k m mj m j x v y u EF 0 0 0To avoid the infinity results in solving this problem11, we can set the weighted sum of
inputs equals to 1, and then (4) can be rewritten into this problem:
) ( max 0 ,
∑
m mj m vu u y
subject to
∑
= k kj kx v 1 0 (5)EFj ≤ 1, 1 ≤ j ≤ n
0 ≤ um, vk ≤ 1
In solving this DEA problem in (5), some computer programs were developed, such as DEA-solver, Onfront, DEAP, etc. (Hollingsworth, 2004); of which DEAP 2.112 will be use in
this paper.
5. Data on Vietnamese banks
11 For a result which is calculated by a ratio of A over B, then if (A*,B*) is a solution, then (αA*,αB*) also is a
solution, etc.
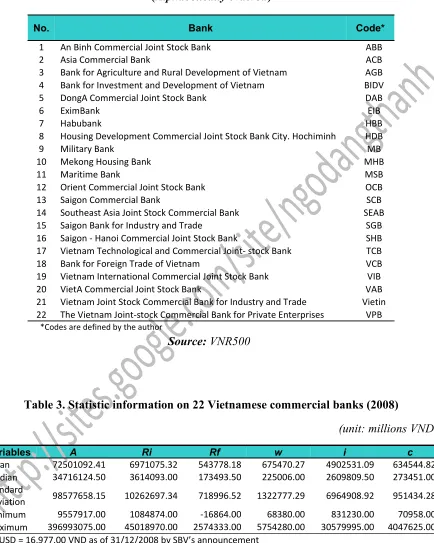
Within more than 90 banks in Vietnam nowadays, the difference between capital, labor force, location, etc. are varies and their availability are also differ. Hence, this research will focus on analyzing twenty-two commercial banks which stand on the top 50 largest enterprises in banking, financial and securities industry of the VNR-500 in the year of 200913 (Table 2 provides
the list of these 22 banks).
{Table 2 here}
The inputs and outputs variables of the research will then be chosen regarding their important to the banking activities. Hence, outputs will then include total asset (A), interest and similar income (Ri), and other incomes (Rf, relates to income from fees and commission, income from dealing with foreign currencies and gold, income from investments or securities, etc.). The main inputs will then include wages (w), interest and similar expenses (i), and other expenses (c, relates to fees and commission expenses, general and administration expenses, expenses on investment activities, etc.). Due to the lack of data, data for all of these banks in 2009 is uncompleted, therefore, this study will focus on the year of 2008.
{Table 3 here}
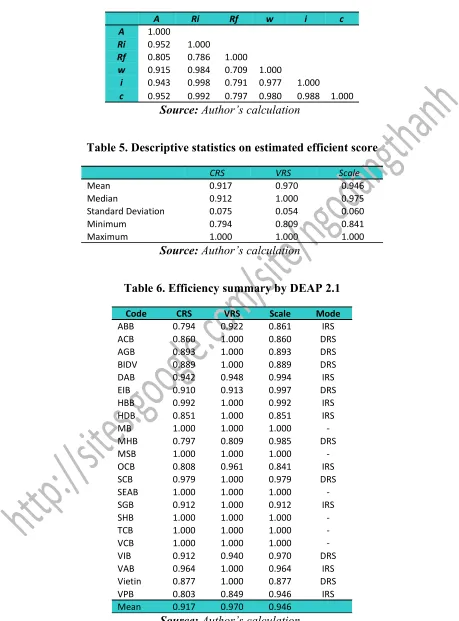
Table 4 shows the correlation between the inputs and outputs, proofs that they have a strong relation between each other (with lowest correlation score is 0.786 between Ri and Rf).
{Table 4 here}
6. Empirical results
Concerning the management and control power of banks regarding their inputs and outputs, an input-orientated DEA under variable returns to scale (VRS) condition was used in analyzing the efficiency of these 22 Vietnamese commercial banks. The results after running DEAP 2.1 shows that the average efficiency score of these banks is relatively high, which means they are mainly producing close to the frontier. Under CRS analysis, the mean efficiency score is 0.917 while it is 0.970 under VRS analysis, and that makes the mean of Scale efficiency is 0.946 (see Table 5).
{Table 5 here}
Out of 22 banks analyzed, there are 8 banks getting the advantage of increasing returns to scale, 6 banks are producing on the efficient frontier, and another 8 banks are having decreasing returns to scale. This can lead to a conclusion that while 36 percents of these banks are currently smaller than requirement, another 36 percents are bigger than what they need (see Table 6).
{Table 6 here}
At individual bank level, the most inefficient bank in CRS is ABB (scores 0.794) while the most inefficient one in VRS is MHB (scores 0.809). Hence, in order to reach the frontier (input-orientated), these banks will need to decrease the usage of its three main inputs while unchanged or even increases the outputs. For example, ABB can decrease their wage by 7,202 million VND, interest expenses by 95,443 million VND and other costs by 13,943 million in order to get a 21,202 million VND increase in other incomes. Meanwhile, MHB also can decrease 47,932 million VND in wage, 595,730 million VND in interest expenses and 47,931 million VND in other expenses to get 14,202,892 million VND increase in total assets and 55,089 million VND increase in other incomes. This simple example shows that, the most inefficient input of these two banks (as well as for other banks) is the interest and similar expenses (i), meaning most of Vietnamese commercial banks are now over-acted in their lending activities.
{Table 7 here}
7. Conclusions
This paper presented an analysis on the efficiency of 22 Vietnamese commercial banks in the year of 2008 using the data envelopment analysis (DEA) approach through an input-orientated angle and under an variable returns to scale condition. The data was collected through the 2008 Annual Reports of these banks in three major inputs (wage, interest expenses and other expenses) and three major outputs (total assets, interest incomes and other incomes). With a bigger sample size and better range of choosing input and output factors (compare to previous researches), this paper brings a clearer and deeper analysis on the Vietnamese banking system (in term of efficiency) with a more recently information.
The result after running a DEAP 2.1 computer program shows that the average (mean) of the efficiency scores of these banks is close to optimal score, which means they are producing close to the frontier. However, this does not mean they are ‘truly efficient’ but only ‘relatively efficient’ compare to each other. Future research on cross-sectional aspect such as comparing with foreign banks and branches in Vietnam, or with foreign banks in other countries in the region, or compare with the efficiency in other industries within the country, etc. will then still are very important.
References
ADB. (2009). Key Indicators: Asian Development Bank.
Banker, R. D., & Maindiratta, A. (1988). Nonparametric Analysis of Technical and Allocative Efficiencies in Production. Econometrica, 56(6), 17.
Charnes, A., Cooper, W. W., & Rhodes, E. (1978). Measuring The Efficiency Of Decision Making Units.
European Journal of Operational Research, 2, 15.
Coelli, T.J. (1996), A Guide To DEAP Version 2.1: A Data Envelopment Analysis (Computer) Program, CEPA Working papers No. 8/96, University of New England.
Färe, R., Grosskopf, S., & Lovell, C. (1994). Production Frontiers. New York: Cambridge University Press. Farrel, M. J. (1957). The Measurement Of Productive Efficiency. Journal of the Royal Statistical Society,
120(3), 37.
Hall, R. E., & Lieberman, M. (2006). Microeconomics: Principles and Applications (3rd ed.): Thomson South-Western.
Hollingsworth, B. (2004). Non parametric efficiency measurement. The Economic Journal, Volume 114, Issue 496, 5.
Le, K. N. (2006). Sequencing banking reforms in transition economies: Vietnam Discussion paper. Washington State University. Retrieved from http://lknlit1.googlepages.com/2007-10-05-SBR_luu.pdf
Ngo, D. T. (2004). Financial liberalization progress in Vietnam – Reality and Solutions. Master, University of Economics and Business, Vietnam National University, Hanoi.
Ngo, D. T. (2009a). Financial liberalization in the Socialist oriented market economy in Vietnam. In V. D. Pham (Ed.), Socialist orientation in developing the market economy in Vietnam – Facts and solutions. Hanoi: Vietnam National University Publishing House.
Ngo, D. T. (2010b). Evaluating Vietnamese Commercial Banks Using Data Envelopment Analysis Approach (Vietnamese). SSRN eLibrary.
Figure 1. Structure of Vietnamese financial system
Figure 2. Cash/Total liquidity ratio (1990-2006, percent)
Source: Key Indicators (ADB) and Annual Reports (SBV)
Table 1. Some developments of Vietnamese banking system (1998-2008, percent)
Index 1998 1999 2000 2001 2002 2003 2006 2005 2006 2007 2008
Total liquidity
growth rate 25.6 39.3 56.2 25.5 17.6 24.9 29.5 29.7 33.6 46.0 20.3
Domestic
credit/GDP 22.44 22.39 35.15 39.73 44.78 51.65 60.75 69.78 75.00 96.20 95.00
Total
liquidity/GDP 28.4 35.7 50.5 58.1 61.4 67.0 74.4 82.3 94.8 117.9 109.8
Finance/GDP 1.74 1.87 1.84 1.82 1.82 1.77 1.78 1.80 1.81 1.81 1.84
Deposit/GDP 11.17 15.45 20.25 22.62 24.47 32.99 38.48 44.85 53.49 n.a n.a
Cash/Total
liquidity 26.33 29.13 23.42 23.70 22.56 22.03 20.49 18.99 17.21 n.a n.a
[image:13.612.77.530.354.648.2]Table 2. List of 22 top VNR-500 banks in Vietnam
(Alphabetically ordered)
No. Bank Code*
1 An Binh Commercial Joint Stock Bank ABB
2 Asia Commercial Bank ACB
3 Bank for Agriculture and Rural Development of Vietnam AGB
4 Bank for Investment and Development of Vietnam BIDV
5 DongA Commercial Joint Stock Bank DAB
6 EximBank EIB
7 Habubank HBB
8 Housing Development Commercial Joint Stock Bank City. Hochiminh HDB
9 Military Bank MB
10 Mekong Housing Bank MHB
11 Maritime Bank MSB
12 Orient Commercial Joint Stock Bank OCB
13 Saigon Commercial Bank SCB
14 Southeast Asia Joint Stock Commercial Bank SEAB
15 Saigon Bank for Industry and Trade SGB
16 Saigon - Hanoi Commercial Joint Stock Bank SHB
17 Vietnam Technological and Commercial Joint- stock Bank TCB
18 Bank for Foreign Trade of Vietnam VCB
19 Vietnam International Commercial Joint Stock Bank VIB
20 VietA Commercial Joint Stock Bank VAB
21 Vietnam Joint Stock Commercial Bank for Industry and Trade Vietin
22 The Vietnam Joint-stock Commercial Bank for Private Enterprises VPB *Codes are defined by the author
[image:14.612.95.529.109.652.2]Source: VNR500
Table 3. Statistic information on 22 Vietnamese commercial banks (2008)
(unit: millions VND*)
Variables A Ri Rf w i c
Mean 72501092.41 6971075.32 543778.18 675470.27 4902531.09 634544.82
Median 34716124.50 3614093.00 173493.50 225006.00 2609809.50 273451.00
Standard
Deviation 98577658.15 10262697.34 718996.52 1322777.29 6964908.92 951434.28
Minimum 9557917.00 1084874.00 -16864.00 68380.00 831230.00 70958.00
Maximum 396993075.00 45018970.00 2574333.00 5754280.00 30579995.00 4047625.00
*: 1 USD = 16,977.00 VND as of 31/12/2008 by SBV’s announcement
Table 4. Correlation between inputs and outputs of 22 banks in 2008
A Ri Rf w i c
A 1.000
Ri 0.952 1.000
Rf 0.805 0.786 1.000
w 0.915 0.984 0.709 1.000
i 0.943 0.998 0.791 0.977 1.000
c 0.952 0.992 0.797 0.980 0.988 1.000
[image:15.612.74.533.86.707.2]Source: Author’s calculation
Table 5. Descriptive statistics on estimated efficient score
CRS VRS Scale
Mean 0.917 0.970 0.946
Median 0.912 1.000 0.975
Standard Deviation 0.075 0.054 0.060
Minimum 0.794 0.809 0.841
Maximum 1.000 1.000 1.000
Source: Author’s calculation
Table 6. Efficiency summary by DEAP 2.1
Code CRS VRS Scale Mode
ABB 0.794 0.922 0.861 IRS
ACB 0.860 1.000 0.860 DRS
AGB 0.893 1.000 0.893 DRS
BIDV 0.889 1.000 0.889 DRS
DAB 0.942 0.948 0.994 IRS
EIB 0.910 0.913 0.997 DRS
HBB 0.992 1.000 0.992 IRS
HDB 0.851 1.000 0.851 IRS
MB 1.000 1.000 1.000
-MHB 0.797 0.809 0.985 DRS
MSB 1.000 1.000 1.000
-OCB 0.808 0.961 0.841 IRS
SCB 0.979 1.000 0.979 DRS
SEAB 1.000 1.000 1.000
-SGB 0.912 1.000 0.912 IRS
SHB 1.000 1.000 1.000
-TCB 1.000 1.000 1.000
-VCB 1.000 1.000 1.000
-VIB 0.912 0.940 0.970 DRS
VAB 0.964 1.000 0.964 IRS
Vietin 0.877 1.000 0.877 DRS
VPB 0.803 0.849 0.946 IRS
Mean 0.917 0.970 0.946
Table 7. Projection summary for ABB and MHB
(unit: millions VND)
ABB Original value Radial
movement
Slack movement
Projected value
A 13494125.000 0.000 0.000 13494125.000
Ri 1494819.000 0.000 0.000 1494819.000
Rf 73958.000 0.000 21202.830 95160.830
w 92362.000 -7202.188 0.000 85159.812
i 1223980.000 -95443.305 0.000 1128536.695
c 178813.000 -13943.450 0.000 164869.550
MHB Original value Radial
movement
Slack movement
Projected value
A 35162410.000 0.000 14202892.705 49365302.705
Ri 3548887.000 0.000 0.000 3548887.000
Rf 129432.000 0.000 55089.265 184521.265
w 250680.000 -47932.284 0.000 202747.716
i 3115600.000 -595730.903 0.000 2519869.097
c 250674.000 -47931.136 0.000 202742.864