Munich Personal RePEc Archive
Measuring the Effects of Technology
Change in Multiple Markets :
Application to the Greek Cotton Yarn
Industry
Bullock, David S. and Dadakas, Dimitrios and Katranidis,
Stelios D.
University of Illinois, University of Ioannina, University of
Macedonia
2009
Online at
https://mpra.ub.uni-muenchen.de/67204/
Measuring the Effects of Technology Change in Multiple Markets
Application to the Greek Cotton Yarn Industry
By
David S. Bullock
University of Illinois, Professor, Department of Agricultural and Consumer Economics, Mumford Hall, 1301 West Gregory Drive, Urbana, IL 61801-3605, USA, [email protected]
Dimitrios Dadakas
University of Ioannina, Lecturer, Department of Economics, Panepistimioupoli, 45110, Greece, [email protected]
and
Stelios D. Katranidis,
University of Macedonia, Professor, Department of Economics, 156 Egnatia Street, P.O.Box 1591, Thessaloniki 54006, Greece, [email protected]
Abstract
Complications arise in the estimation of welfare changes in vertically and horizontally linked markets when technology affects production. Past research has dealt with these complications using single-equation models and dual approaches. We briefly discuss some of the limitations of these approaches, which include the single-equation approach’s poor statistical reliability, and the dual approach’s difficulties in incorporating expectations, dynamics, and expert advice. We propose a method that adapts
Just, Hueth, and Schmit’z (2004) partial-equilibrium sequential integration approach to the case of prices changing because of technological change. Our approach addresses some of the limitations of the single-equation and dual approaches. Our methods can be applied to the estimation of welfare changes in either vertically or horizontally linked markets, when technology improvements and policy-induced multiple price changes affect the markets. This is a common occurrence in economic problems related to the estimation of welfare changes in agricultural and industrial commodities. We apply our method in an empirical study of the vertically linked market for Greek cotton.
Keywords: Single-Market Approach, Dual Approach, Multi-Market Approach, Technology, Bootstrap
JEL: D6, F1, C0
*Bullock and Dadakas share lead authorship.
Measuring the Effects of Technology Change in Multiple Markets
Application to the Greek Cotton Yarn Industry
Abstract
Technology changes in one market often lead to price changes in other markets. For
example, such price changes can occur when markets are horizontally linked through
demand substitutability or complementarity, or vertically linked through input and
output market relationships. But the existing literature on the welfare effects of
technological change often fails to consider that technological change in one market
can change prices in other markets. Two methods of measuring the (producer) welfare
effects of technological change appear in the literature. The first, which Alston, Norton,
and Pardey (1998, p. 505) call the “single-equation supply” method, involves
estimating the sizes of geometric areas behind the supply curves in the market directly
affected by the technology change. Alston, Norton, and Pardey (1998) present both the
theory that underlies the single-equation supply methodology, and a thorough
discussion of its application. Griliches, (1957, 1958) used this method in his studies of
the welfare effects of hybrid corn technology. Scores of articles have followed; fairly
recent examples are Giannakas and Fulton (2000); Moschini, Lapan and Sobolevsky
(2000); Gotsch and Burger (2001); Perrin and Fulginiti (2001); Berwald, Carter, and
Gruyère (2006); Demont, Oehmke and Tollens (2006); Frisvold, Reeves, and Tronstand
(2006); and Hareau, Mills, and Norton (2006). Older articles using the single-equation
approach to examine welfare changes from technology or policy are Babcock and
Foster (1992), Cooke and Sundquist (1993), Gisser (1993), Constantine, Alston, and
Smith (1994), Byerlee and Traxler (1995), McCorriston and Sheldon (1994), Moschini
and Sckokai (1994), Schmitz, Boggess, and Tefertiller (1995), Sumner and Wolf
For reasons to be explained, we will sometimes refer to the single-equation supply
method of measuring the welfare effects of technological change as the shutdown price
method, where here we use a term from Just, Hueth, and Schmitz’s (2004, pp. 78-81)
analysis of changes in multiple prices without a technology change. A well-recognized
limitation of the shutdown price method is that the estimates derived from the method
can lack statistical reliability. This occurs because with the shutdown price method it
is often necessary to extrapolate the econometric estimation of the supply function to
regions outside the range the data. Just, Hueth, and Schmitz (2004, pp. 284-292) have
provided a helpful discussion.
Dual approaches provide the second method of estimating the producer welfare
effects of technology change. Dual approaches have frequently been used in
agricultural economics to estimate various technology parameters, for example the
factor biases of technology change (e.g., Belinfante 1978; Antle 1984; Coelli 1996).
But fewer studies have used dual approaches to estimate the effect of technology change
on producer welfare (Shumway, 1983).
The dual approach and the single-supply equation approach have their own
advantages and disadvantages. The limitations presented in dual and single-supply
approaches guide our own theoretical/empirical work. We adapt a partial-equilibrium,
multi-market, sequential integration approach which allows us to measure the welfare
effects of technological change in markets where price-interrelations exist. We
concentrate on the estimation of producer welfare changes in the vertical market for
Greek cotton and adapt our model so that it allows us to estimate the combined effects
of technology advances and input/output price changes on the welfare of producers
within vertically linked markets. We then discuss how ignoring the effects of
extrapolate estimations outside the range of the available data, and it does not require
the estimation of a profit function or a cost function. Our approach can deal with the
complexity of the price-interrelations in the markets affected by technological change.
Moreover, our approach can be adapted to the study of various economic problems
where vertical and/or horizontal markets result in price-interrelations between the
markets and technology is an important factor. Expert advice about the size of
economic curve shifts is easily incorporated with our approach. This is the case with
many economic problems related to industrial and agricultural economics.
While there are scores of articles in the literature that employ the single-equation
supply method, articles that examine or provide applications of multi-market theory are
fewer. Examples of general equilibrium multi-market studies are presented by
Thurman (1991), Thurman and Wohlgenant (1989), Thurman and Easley (1992),
Bullock (1993b), Canning and Vroomen (1994), and Brannlund and Kriström (1996).
Examples of the partial equilibrium multi-market approach which we employ in this
study, other than the main contributions by Just and Hueth (1979) and Just, Hueth, and
Schmitz (1982; 2004) who developed the theory, are limited and include European
Commission (2000), Gillig, Griffin, and Ozuna (2001), Jeong, Garcia and Bullock
(2003), and Dadakas and Katranidis (2008; 2010). None of these studies however
incorporate the effect of technology in the analysis.
2. Background of the Markets we Study
We study the vertical market for Greek cotton that consists of the market for cotton
yarn (final market) and the market for labor input (intermediate market). The Greek
cotton yarn industry has gone through major changes over the last three decades. A
quota regime that had been in place since 1974 (Multi Fiber Agreement – MFA,
(T&C) products. Discussions about trade liberalization started during the GATT
Uruguay Round negotiations (1987), and were completed by 1995 with the signing of
the Agreement on Textiles and Clothing (ATC, 1995-2005). The ATC required the
elimination of quota restrictions, which were still in place from the MFA regime, by
the year 2005. Fifty one percent (51%) of existing quotas were to be eliminated
gradually by the end of 2004, and the remaining 49%, all at once, on January 1, 20051.
The ATC affected cotton yarn producers’ welfare in most developed countries.
World prices for T&C products decreased, and countries with low labor costs were able
to exploit significant comparative advantage in the production of T&C products. These
developments also affected Greek producers of cotton yarn, who experienced a
substantial reduction in production, exports and domestic prices of their products,
which plummeted as early as 1987. Historically, domestic prices stood higher than the
respective international ones2. The gap between domestic and international prices
narrowed and producers lost part of the surplus that was annually transferred to them
during the MFA regime. The effect of the narrowing gap in domestic vs. international
prices is the first component of the welfare effect that our model captures.
Other international developments, not related to the liberalization of trade in T&C
products, caused Greek producers to also face a widening gap between the domestic
and international cost of labor3. Greece’s labor costs were triple those of other major
yarn exporting countries during the period of our study. The increasing gap between
1 When the ATC was nearing its 2005 completion and most of the quotas were already released
competition intensified. Producers found themselves struggling to compete in the international markets
as exports from China grew by 100%. Taking advantage of China’s WTO accession agreement, both the US and the EU restricted the rate of growth until the year 2008. The EU came to an agreement with China whereas the US imposed import growth quotas, thus allowing for a more gradual transition towards free trade.
2 International prices for cotton yarn are defined as the export weighted average export-price of the 8
highest-volume, yarn-exporting countries in the world.
3 The international cost of labor is defined as the export-weighted cost paid to labor in the world’s eight
domestic and international labor costs is the second component that we must account
for with our welfare change measure. As the gap historically increased, i.e. as domestic
prices became relatively higher, the competitiveness of Greek producers in the
international markets was weakened4.
Apart from the changing prices of yarn and labor, cotton yarn producers’ welfare
was also affected by the adoption of new technologies. During the last three decades
significant advances were made in the production of T&C products. When the
discussions for trade liberalization started in 1987, producers realized they would have
to confront lower prices and increased competition for their products in international
markets, so they invested heavily in new technologies. Some segments of the textile
industry were automated with the use of precision cutters, and investments were also
made in new machinery.
Automation and investment characterized the T&C industry not only in Greece but
in most developed countries as well. Characteristic of the R&D is the case of the US,
where segments such as industrial fabrics, carpets and specialty yarns were completely
automated. Investment in biotechnology research was leading the way to new sources
of fibers, such as corn, and to improvements in existing fibers. Some fibers introduced
had built-in memories of color and shape, as well as antibacterial qualities (US
Department of Labor). Innovations allowed countries such as the US and the EU to
compete with low-labor cost countries in the international markets specializing in
segments of T&C products that can be completely automated.
4 The other major input in the production of cotton yarn is cotton lint. In the market for cotton lint there
The diffusion of technology benefited producers in Greece, as well as producers in
other cotton yarn exporting countries. The important role of R&D suggests that a model
for the estimation of welfare changes that does not include the effects of advancing
technologies might provide biased estimates, especially after 1987, when heavy
investments and research characterized the industry.
Each one of these three concurrent developments had an impact on the welfare of
producers of Greek cotton yarn. First, producers suffered losses from the decrease in
the gap between domestic prices and international prices of yarn, which was a direct
effect of trade liberalization. Second, domestic wages increased relative to the
respective international wages. These increases are tied to domestic and international
policies but are not tied to the liberalization of trade. Domestic producers lost
competitive gains from the increase in the gap between the domestic and international
costs of labor. Third, producers benefited from the changes in production technologies,
which decreased their costs.
3. Theory: An Application to the Vertical Market for Cotton Yarn
Complications arise in the estimation of the welfare changes due to the combined nature
of the price changes and the linkages that exist in the vertical market for yarn, cotton
lint, and labor. In this section, we use line integral theory to compare the two existing
methods of measuring the producer welfare effects or technological change, and then
3.1. Using Line Integral Theory to Understand the Challenge at Hand
We start with the representative producer’s maximization problem. We use a
superscripted index, k = 0, 1, where k = 0 denotes an initial state of trade protection,
relatively low Greek labor costs, and an original technology, and k = 1 denotes a
subsequent state with liberalized trade, relatively high Greek labor costs, and a new
technology. The producer solves the following profit maximization problem:
,
max , ,
c l
k k k k
y y c c c l l
q q p f q x T p q w q ,
where pky is the price of cotton yarn, fy is the cotton yarn production function, pckis the
price of cotton lint, wlk is labor’s wage, qc is the quantity of cotton lint, ql is the yarn
producers’ demand for labor, and T represents technology. As labor demanded by the
Greek cotton yarn industry makes up only a small fraction of the total demand for labor
in Greece (or even more narrowly defined, industrial labor) we can safely assume that
any changes in demand from the cotton yarn industry did not impact wages. The
solution to the profit maximization defines a (maximized) profit function
pky,p w Tck, lk, k
, a yarn supply function qsy pky,p w Tck, lk, k , a cotton lint derived
demand function qcd pky,p w Tck, lk, k , and a yarn producers’ derived demand for labor
function qld pyk,p w Tck, lk, k , all for k = 0, 1.
Due to the changes in prices from
p w0y, l0
to
p w1y, 1l
and the annualimprovements in technology from Ti1 to Ti for any given year, the change in
quasi-rents is equal to,
(1)
1 1 1
0 0 0 1
, , , i , , , i
y c l y c l
p p w T p p w T
,
(2) 1 1 1 0 0 0 1
, , , i , , , i
y c l y c l
p p w T p p w T
, , , , , ,
y c l y y c l c
y c
C
p p w T dp p p w T dp
p p
y, c, l,
l
y, c, l,
.l
p p w T dw p p w T dT
w T
The right-hand side of (2) is a line integral, with C being an arbitrary piecewise
smooth path of integration in 4, with endpoints
0 0 0 1
, , , i
y c l
p p w T and
1, 1, 1, i
y c l
p p w T (Kaplan 1984, pp. 292-293, especially equation (5.48)). The challenge
in empirical work is estimating the quantity represented on both sides of equation (2).
The first two integrals on the right-hand side are estimable via econometric analysis of
supply and demand function, since by Hotelling’s lemma the
p
and - w
functions are identical to output supply and derived input demand functions. Assigning
a value to the third integral is more involved. The chief difficulty is estimating the term
T
, which is the marginal effect of a technology change on profits with prices held
constant. Hotelling’s lemma is of no help in the estimation of
T
.
3.2 Three Approaches to Addressing the
T
Term
Two methods have been used in the literature to address the problematical
T term
discussed in the previous section: the dual approach and the single-equation (or
approach, which has advantages over the other two approaches in certain
circumstances. We call this approach the sequential approach.
3.2.1 The Dual Approach
The dual approach provides one conceivable way to estimate the
T term. To
estimate
T econometrically with a dual approach, it is generally not sufficient to
simply estimate input and output share functions. Rather, it is necessary to estimate a
system of equations involving the (.) function itself along with the share functions.
But this is rarely done in applied studies, perhaps due to data limitations, or perhaps
due to doubts that economic profits can be accurately observed in the data by
subtracting accounting revenues minus accounting costs. More frequently, cost
function approaches are used to estimate systematically the input demand and output
supply functions, and at times the cost function itself has been used in the estimation
process. But in general the cost function itself is not estimated with the input demand
equations, again perhaps due to lack of confidence that economic costs can be well
captured by observed accounting costs.
In general the dual approach offers various advantages in estimating output supply
and input demand functions. These advantages are well documented in the literature.
For our particular case of estimating the welfare effects of technological change, an
advantage of the dual approach is that it does not require estimation of output supply or
input demand functions well beyond the observed ranges of the prices and quantity
3.2.2 The Single-equation (or Shutdown Price) Approach
This difficulty in econometric estimation is an important reason why empirical studies
in agricultural economics have only rarely attempted to use dual approaches to estimate
the producer welfare effects of technological change. Instead, as we will explain, the
conventional method of dealing with the non-observability of the
T
term has been
to take the line integral in (2) over a “shutdown price path of integration,” which is
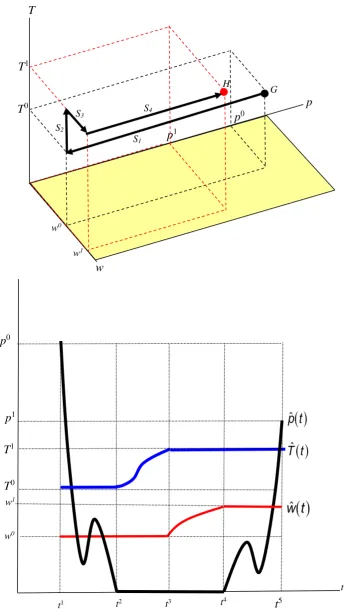
illustrated in the top panel of figure 1. The endpoints of any path of integration used
must be (p0, w0, T0) and (p1, w1, T1), which are points G and H. A convenient path of
integration is the one defined parametrically by functions p t
, w t
, and T t
in thebottom panel, which generate a path in which one variable changes at a time, while all
others are held constant. The path so defined is made up of four “straight-line” sub
-paths, S1, S2, S3, and S4. Because along sub-paths S2 and S3 the output price is zero, if
we assumed this causes the firm to shut down5, then we can assume
, , ,
y c l
p p w T
T
is zero all along these sub-paths. Along sub-paths S1 and S4, the technology level
remains constant. In essence, by taking the convenient “shutdown” path of integration,
we have gotten rid of the problematical term
py,p w Tc, l,
T
.
5This scenario implies that a firm’s major source of revenues originates from the output product for
t
p0
p1
T0 T1
t1 t2 t3
w0
w1
[image:13.595.115.467.73.687.2]
Figure 1. A shutdown path of integration
t4
w0
w
p T
T0
p1 T1
p0
w1
S1
S2
S4
S3
G H
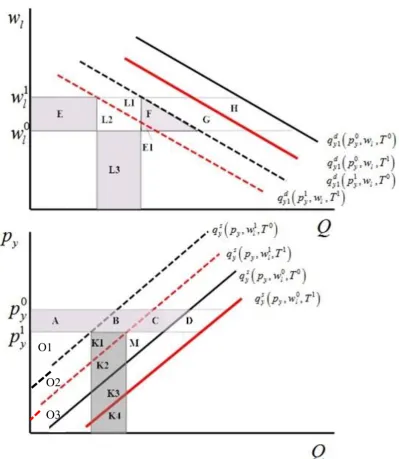
The result is that we can measure ∆, which is area A–B in figure 2. (See Bullock
and Minot (2006) for a fuller discussion of the shutdown price approach, though in the
context of consumer theory.).
Applying the shutdown price method to the Greek cotton yarn market, we can
obtain a producer welfare change measure for the concurrent changes in prices of yarn,
the labor wage, and advances in technology with the following integral:
(3)
1
0
0
0 0 1 1
0
, , , ,
y
y
p
s s
y y l y y y l y
p
q p w T dp q p w T dp
,where T0 Ti1 and T1Ti. The single-market approach requires quantity data from
the output (yarn) market only.
Using figure 3, the welfare effect from the single-market analysis is equal
[image:14.595.109.502.154.453.2]to -(A+B+C+K1+K2+M+O1+O2+O3) + (O1+O2+K1) = -(A+B+C+M+K2+O3). The Figure 2. B–A is the shutdown-price measure of producer welfare change when technology and prices all change.
a
b
welfare change estimate requires the use of the areas M, K2 and O3, which are usually
out of the range of observed price changes. Consequently, the single market approach
requires estimation of the area under the supply curve for which researchers usually do
not have any information for (See Just et. al. 2004, chapter 9, for a thorough theoretical
presentation, Vestergaard, 1999, for an application using the single-market approach).
Using the single-market approach as we move away from the mean value of observed
price changes, the confidence interval for the predicted values of quantities supplied
increases, welfare results are less accurate and should be interpreted with caution (Just
et. al. 1982; 2004)6.
6 A formal empirical comparison of the single and the multi-market approaches to welfare change
An advantage of the single-supply-equation approach is that it can be more easily
used to model dynamics, expectations, and risk than can the dual approach. As Alston,
Norton and Pardey (1998, p. 113) write, “The key issues in supply-response analysis
were identified sixty years ago … as being how to deal with expectations and dynamics;
these issues continue to be difficult. The virtue of the single-equation models is that
[image:16.595.97.497.72.532.2]they allow considerable flexibility in the treatment of these topics.” In addition, the
Figure 3. Welfare measures in (quantity, price)-space O1
O2
single equation approach allows for easier incorporation of “expert” advice about the
nature of the cost and supply changes brought about by the technological change. In
this vein, Alston, Norton, and Pardey (1998, p. 505) write, “There is little point in
proceeding with an econometric analysis unless 25 to 30 years of data are available on
quantities (and, perhaps, also prices of outputs and inputs, along with data on research
and extension expenditures going back a further 20 years or so… .) When adequate
time-series data are not available, an economic surplus approach can be used that relies
on experimental data and the opinions of scientist and extension workers to estimate
the per unit cost changes (or yield improvements) … .” Just has made similar points:
“If models of excessive generality are used to analyze production problems, then the
ability to communicate about them is reduced. Communication becomes difficult
between economists and non-economist providers of information as inputs to economic
analysis” (Just 2000, p. 151). “This cuts communication between empirical production
economists and the very disciplines that have scientific information that should be
incorporated into production studies” (Just 2003, p. 149).
A key piece of information needed to use the shutdown price approach to measure
producer welfare change is the size of the shift (either horizontal or vertical) in the
supply curve due to the technology change. This shift is called the “k-shift” in much of
the literature, including in Alston, Norton, and Pardey (1998). The horizontal k-shift is
distance ab in figure 2. The vertical k-shift is area ac. Often, economists seek the
3.2.3 A Sequential Approach
To overcome some of the problems presented in the single-market approach we next
present a sequential approach towards the estimation of the welfare changes. Because
the line integral in (2) is path independent, we can choose a convenient path that allows
us to easily convert the line integral into the sum of four definite integrals. This is a
path that sequentially changes the variables one at a time from their initial levels to their
subsequent levels. The order in which we change the variables of integration is
arbitrary. We choose to change py from py0 to py1, holding the other variables constant
at their initial levels, then to change pc from pc0 to pc1, holding py at its subsequent level
and wl and T and their initial levels, then to change w holding py and pc at their
subsequent levels and T at its initial level, then finally to change T holding the other
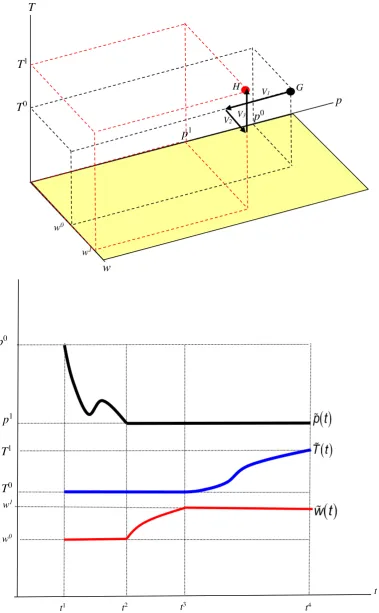
variables at their subsequent levels. We illustrate this path of integration in figure 4,
where we do not feature pc because we are limited to three dimensions in the diagram,
t
p0
p1
T0 T1
t1 t2 t3 t4
w0
w1
[image:19.595.100.480.76.690.2]
Figure 4. A sequential path of integration
V1
V2 V3
w0
w
p T
T0
p1 T1
p0
w1
V1
V2
V3
Using definitions in Kaplan (p. 275), the line integral over the sequential path
chosen can be converted into the sum of four “sequential” definite integrals shown in
equation (4).
(4)
1 1
0 0
0 0 1 1 0 1
, , , , , ,
y c
y c
p p
i i
y c l y y c l c
y c
p p
p p w T dp p p w T dp
p p
1 0 11 1 1 1 1 1
1 , , , , , , i l i l w T i
y c l y y c l
l
w T
p p w T dw p p w T dT
w T
The second integral in (4) is equal to zero as initial prices and final prices of cotton lint
are equal. Since there is no intervention in the cotton lint market domestic prices equal
world prices and there is no price-induced welfare effect to producers7. The remaining
terms, combined with the results from Hotelling’s Lemma and the envelope theorem,
provide us with a measure of the welfare change for producers of yarn:
(5)
1 1
0 1
0 0 1 1 1 1
, , , , , , l y y l w p
s i d i
y y c l y l y c l l
p w
q p p w T dp q p p w T dw
1
1 1 1 1
, , , .
i
i
T
i y c l T
p p w T dT
T
Because the shutdown-price method usually requires extrapolation of supply curve
estimates beyond the data range, it is desirable to seek out another way to deal with the
last integral on the right-hand side of (4). To do so, first we refer to the Fundamental
Theorem of Calculus, which implies that it can be rewritten:
7 Domestic and international prices were equal throughout the period we examine. Minor differences are
(6)
1
1 1 1 1 1 1 1 1 1 1 1
, , , , , , , , , .
i
i
T
i i i
y c l y c l y c l
T
p p w T dT p p w T p p w T
T
The definition of the profit function implies,
(7)
1 1 1
1 1 1 1
, , , i , , , i
y c l y c l
p p w T p p w T
1 1 1 1 1 1 1 1
, , , , , ,
s i s i
y y y c l l y y c l
p q p p w T w q p p w T
1 1 1 1 1 1 1 1 1 1
, , , , , , .
d i d i
y l y c l l l y c l
p q p p w T w q p p w T
Rearranging the right-hand side of (7) and substituting the result into (6) gives us,
(8)
1
1 1 1 1
, , ,
i
i
T
i y c l T
p p w T dT
T
1 1 1 1 1 1 1 1, , , , , ,
s i s i
y y y c l y y c l
p q p p w T q p p w T
1 1 1 1 1 1 1 1
, , , , , , .
d i d i
l l y c l l y c l
w q p p w T q p p w T
Finally, substituting (8) into (4) gives us,
(9)
1 1
0 1
0 0 1 1 1 1
, , , , , , l y y l w p
s i d i
y y c l y l y c l l
p w
q p p w T dp q p p w T dw
1 1 1 1 1 1 1 1
, , , , , ,
s i s i
y y y c l y y c l
p q p p w T q p p w T
1 1 1 1 1 1 1 1
, , , , , , .
d i d i
l l y c l l y c l
w q p p w T q p p w T
The first integral in (9) is represented by –(A+B+C) using figure 3, measured behind
supply curve
0 0
, ,
s
y y l
q p w T , which is conditioned on initial labor costs and
technology. The second integral, which must be subtracted, is (E+L2+L1+E1+F), the
area behind the labor demand curve d1
1, , 0
y y l
q p w T , which is conditioned on the final
price of yarn and initial technology. The third term on the right-hand side of (8) is
(L1+L2+L3). In sum, the change in producer quasirents is represented by
-(A+B+C+D) - (E+L1+L2+E1+F) + (K1+K2+K3+K4) - [- (L1+L2+L3)]
With equation (9), we have dealt with the problematical
T
term in (4), and
provided an estimable measure for the change in producer’s welfare. Unlike dual
approaches, our method does not require estimation of the profit or cost function along
with the output supply and input demand functions. It also allows use of “expert”
advice, because two types of “k-shift” are key to its implementation. The first is a k
-shift in the supply function, appearing in the third term on the right-hand side of (9):
1 1 1 1 1 1 1
, , , , , ,
s i s i
y y c l y y c l
q p p w T q p p w T . The second is a k-shift in the labor demand
function, appearing in the fourth term on the right-hand side of (9):
1 1 1 1 1 1 1
, , , , , , .
d i d i
l y c l l y c l
q p p w T q p p w T Unlike the shutdown price method, our
measure does not require integration all the way down the supply curve. This means
that in general we are not extrapolating beyond the range of our data, and so our method
does not involve the same types of problems with statistical inaccuracy that are
encountered when the conventional method is used.
4. Econometric Analysis
To discuss/compare the reliability of the estimated welfare changes implied by equation
(9) we also estimate a model that does not incorporate technological advances in the
specification. The simplified measure, which uses Just, Hueth, and Schmitz’s (2004)
sequential integration method, and is discussed in detail in Dadakas and Katranidis
(10)
1 1
0 1
0 1
, , .
y l
y l
p w
s d
y y l y l y l l
p w
q p w dp q p w dw
The theoretical conclusion with respect to the statistical reliability of welfare estimates
in single market models vs. multi-market models presented in Just, Hueth and Schmitz
(1982; 2004) was empirically investigated by Dadakas and Katranidis, (2008)8.
However, there is no formal comparison of the effect that the inclusion of technological
changes have on the statistical reliability/bias of the results within the bounds of our
approach, that is the multi-market approach. Other than an initial theoretical discussion
presented by Bullock (1993a)9, we are aware of no study that attempts to estimate the
welfare effects of changes in technology and input prices using a sequential approach.
For our purposes we compare two models. We use a Multi-Market Technology
Inclusive (MMTI) model as the base model (equation (9)) but we also estimate a
Multi-Market Technology Exclusive (MMTE) model (equation (10)) so as to compare the two
welfare effects and determine whether bias is created due to the omission of technology
in the theoretical/empirical development of the model. Deviations of the two
measurements are expected if new technologies affect production.
The estimation of the MMTI model requires a supply function for yarn and a
derived demand function for labor (equations 11 and 12),
8 Dadakas and Katranidis (2008) present and compare the statistical properties of the welfare estimates
derived from equivalent equations 3 and 10, that is the single-market approach and the multi-market model. Their model however does not include the effects of technology.
9 Bullock (1993a) examined the welfare effect of technology change when two output markets and hence
(11) qsy 0 1py t, 2pc t, 3qsy t, 1 4wla T5 a T6 2a D7 1a D8 2a
(12) qld 0 1py t, 2pc t, 3ql td, 1 4wl5T6T2
The effect of technology is represented with variables T and T2 measured as a simple
time trend. pck represents the price of cotton-lint. The first dummy variable (D1) assigns
the value 1 to the years prior to the signing of the MFA agreement (1974) to capture
structural changes in the supply of yarn due to the changing regime. The second
dummy (D2) assigns a value of 1 to the years immediately prior to the 1987 Uruguay
Round of trade negotiations and the 1995 Agreement on Textiles and Clothing (only
the years 1986 and 1994 are assigned a value of 1), when domestic intervention prices
reached local peaks and global troughs, respectively, also representing structural breaks
in the data10. In the supply equation, we adopt a partial adjustment framework with
lagged supply entering the equation as an explanatory variable, while in the demand
equation habitual consumption requires the use of past year’s demand as an explanatory
variable.
To assure that the profit function is well-defined and the line integral path
independent we impose the following symmetry restriction (Young’s theorem) ,
(13)
s d
y l
y l
q q
p w
which is equivalent to
1
411. This restriction is necessary in empirical work toassure that the welfare change estimates from all possible paths are equal. The results
10During these years the observed shift in trend in prices in the domestic market followed the shift in
trend in the international markets with a one year lag. A possible explanation is that expectations and
adjustment to trade liberalization, which affected Greece’s composition of imports/exports, as well as production levels, had a delayed effect in the domestic market as Greece, historically, enjoyed a very high level of protection offered by the MFA regime.
11 Had we included in the analysis cotton lint, i.e., if the domestic prices of cotton-lint and the
are then used in combination with equation (9) to estimate the welfare changes. The
welfare effects from additional corner paths were estimated to assure that all
estimations were done properly and that equality of the welfare effects estimated from
different paths holds. These, however, are not presented in detail.
The MMTE model uses equations (11) and (12) for the econometric estimation
together with restriction (13). It does not include the technology variables
2
,
T T .
Equation (10) is used for the estimation of the welfare changes.
The data for our statistical analysis came from the Greek Ministry of Agriculture,
the World Textile Demand (ICAC, 2003), ICAP, ILO, the Feenstra and Lipsey (2005)
database, and the Annual Statistics of the Greek Industry. The CPI index (1987 = 1)
was used as the numéraire commodity and all measures were transformed to metric.
The world prices for labor and the world prices for cotton yarn, i.e. the upper limits of
the integrals in equations (9) and (10), are a weighted-average estimate from the eight
largest volume-exporting countries in the world. All estimation were made in Greek
drachmas and results were converted to US dollars. Our statistical sample included
data from 1970 to 2001, a total of 32 observations. Welfare changes were estimated
only up to the year 2000 due to data limitations not allowing us to complete world prices
of labor and cotton yarn after that year (one of the limits of each integral in equations
(9) and (10)).
The next step in the analysis requires we compare the welfare effects from the two
models to infer on the bias created by omitting technology in the specification of the
model. The point estimates of the annual welfare changes provided by the two models
do not allow formal tests for the bias created. We thus need to assign statistical
properties to our point estimates and retrieve a mean and a variance for our welfare
estimates. We employ non-parametric bootstrap analysis (Efron 1993; Kling and
Sexton 1990) and compare the welfare effects from the MMTI and the MMTE models.
We estimate the difference in the “mean welfare change” obtained from the bootstrap,
as follows,
,
1 1
, ,
1000 1000
i i
MMTI MMTE MMTI j j MMTE j j
i i
W a a
.Where i is the number of the bootstrap sample estimated and j the coefficient included
in the regressions. Hence, we examine whether the size of WMMTI MMTE, statistically
deviates from zero. Significance would indicate that there is bias created by the
omission of technology in the estimation of the welfare changes. The expected value
of this measure is equal to zero when there are no technological improvements
associated with the welfare change.
5. Welfare and Bootstrap Analysis
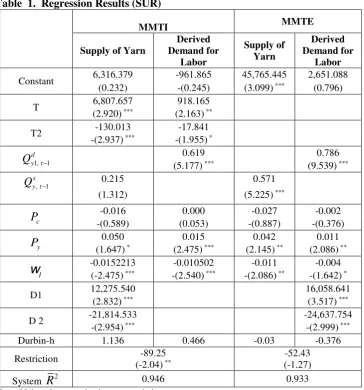
Regression results are presented with the help of table 1. The MMTI model explains
94.6% of the variability, while the MMTE explains 93% of the variability of the
dependent variables. The Durbin-h test was not statistically significant and all the
Table 1. Regression Results (SUR)
MMTI MMTE
Supply of Yarn
Derived Demand for Labor Supply of Yarn Derived Demand for Labor
Constant 6,316.379 -961.865 45,765.445 2,651.088
(0.232) -(0.245) (3.099) *** (0.796)
T 6,807.657 918.165
(2.920) *** (2.163) **
T2 -130.013 -17.841
-(2.937) *** -(1.955) *
1, 1 d y t
Q 0.619 0.786
(5.177) *** (9.539) ***
, 1 s y t
Q 0.215 0.571
(1.312) (5.225) ***
c
P -0.016 0.000 -0.027 -0.002
-(0.589) (0.053) -(0.887) -(0.376)
y
P 0.050 0.015 0.042 0.011
(1.647) * (2.475) *** (2.145) ** (2.086) **
wl -0.0152213 (-2.475) *** -(2.540)-0.010502 *** -(2.086)-0.011 ** -(1.642)-0.004 *
D1 12,275.540 16,058.641
(2.832) *** (3.517) ***
D 2 -21,814.533 -24,637.754
-(2.954) *** -(2.999) ***
Durbin-h 1.136 0.466 -0.03 -0.376
Restriction -89.25
(-2.04) **
-52.43 (-1.27)
System R2 0.946 0.933
Note: Values in parenthesis are t-statistics
*** significant at α=0.01, ** α=0.05, *α=0.1
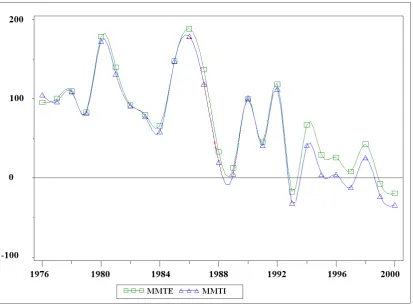
The pattern of welfare changes estimated with equations (9) and (10) shows
declining transfers to Greek producers throughout the period 1975-2000 (figure 5).
Although the estimated welfare effects barely differ until 1992, thereafter the MMTI
model produces substantially lower welfare estimates12. An explanation for the
deviation in the two welfare measures is that the high costs of labor combined with
expectations for decreased product prices, due to the impending 1995 liberalization of
trade, led to investments and innovations for new labor saving technologiesintended to
assist producers to compete in the international markets effectively. Since the MMTE
model does not account for these changes it cannot differentiate the pre- and post-1991
welfare results to producers due to changes in technology. Thus the MMTE model
overestimates the true welfare effects after 1992. The differences peak after the final
signing of the 1995 Agreement on Textiles and Clothing (ATC), when quotas were
gradually eliminated and prices of cotton yarn products decreased.
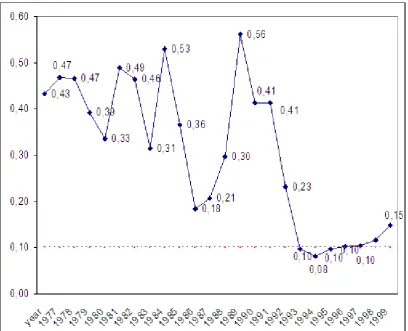
Using the shift method (Noreen, 1989) to obtain the bootstrapped welfare estimates
of the MMTI and the MMTE models, we examined the differences in the two welfare
measures. Figure 6 plots the α-levels for which the differences in the MMTI and the
[image:28.595.112.526.291.596.2]The analysis suggests that results do not differ significantly for most of the years
we study. Statistically significant differences are observed for the years 1994-1999,
consistent with the observations made with the help of figure 4. We believe that the
non-significant differences during 1999-2000 are related to China’s upcoming entry to
the WTO that resulted in an increased world demand for cotton products. During this
period, innovations and the adoption of new technologies resulted in bias in the welfare
effects estimated from the MMTE model. Such differences are expected to be stronger
for countries such as the US and the EU where the majority of R&D in Textiles and
Clothing is conducted. Greece’s benefit from new technologies originates mainly from
[image:29.595.112.521.74.405.2]diffusion and not from R&D per se.
6. Conclusions and Applications
Various approaches are available in the literature to estimate the impact of technology
changes on the welfare of producers. When these changes are combined with
policy-induced price-changes in vertically or horizontally linked markets we need to examine
all changes at the same time and take into account the complexity of price relations
between markets. Unfortunately, the commonly used single-market approach and dual
approaches cannot be considered as a panacea for all economic problems. The
limitations presented by the statistical reliability of the welfare results in single-market
approaches (Just, Hueth and Schmitz 1982;2004; Dadakas and Katranidis, 2008) and
the struggle of dual approaches with dynamics and expectations (Alston, Norton, and
Pardey, 1998) prompt us to adapt our approach so that it can deal with the intricacies
of the markets in this research. We provided an extended application of a model first
presented by Bullock (1993a). The model allowed us to estimate the price-induced
welfare changes in a multi-market setting inclusive of the effects of technology. Our
main conclusion suggests that when new technologies affect production, the model used
to estimate the welfare changes must account for the effects of technology to avoid
biasing the results.
Our model can be applied to welfare change estimation problems, in either
vertically or horizontally linked markets, when price-policy affects concurrently two or
more prices and at the same time technology affects production. Our model provides
researchers with a viable and valuable alternative in many situations, such as estimating
welfare changes when economic research is related to agricultural and industrial
economics where linked markets, multiple price changes and technology improvements
Current research is directed towards a simulated formal comparison of the welfare
effects estimated via the multi-market sequential approach we presented in this article
and the dual approaches. Since in many cases researchers will have the option to use
either the multi-market approach or a profit function our next research endeavors are
directed to the statistical properties of the welfare effects from each method to examine
which method provides more efficient/reliable estimates. Another line of research will
concentrate on the costs of equipment, machinery and training associated with the
implementation of new technologies, investment costs as well as welfare analysis
7. References
Alston, J.M., G.W. Norton, G.W., and P.G. Pardey, P.G., (1998). Science under
Scarcity: Principles and Practice for Agricultural Research Evaluation and
Priority Setting. The Hague, Netherlands: International Centre for National
Agricultural Research (ISNAR).
Antle, J.M., (1984). The Structure of U.S. Agricultural Technology, 1910-1978.
American Journal of Agricultural Economics, 66: 414-421.
Babcock, B.A. and Foster, W.E., (1992). Economic Rents under Supply Controls with
Marketable Quota. American Journal of Agricultural Economics, 74:630-637.
Belinfante, A., (1978). The Identification of Technical Change in the Electricity
Generating Industry. In Fuss, M. and McFadden, D. (eds.), Production Economics:
A Dual Approach to Theory and Applications. North-Holland Publishing
Company, Amsterdam.
Berwald, D., Carter, C.A., Gruyère G.P., (2006). Rejecting New Technology: The
Case of Genetically Modified Wheat. American Journal of Agricultural Economics,
Brannlund, Runar, Bengt Kristrom, (1996). Welfare Measurement in Single and
Multimarket Models: Theory and Application. American Journal of Agricultural
Economics, 78 (1996):157–65.
Bullock, D.S., (1993a). Multimarket Effects of Technological Change: Comment,
Review of Agricultural Economics, Sep., vol. 15, is. 3, p. 603-608.
Bullock D.S., (1993b). Welfare Implications of Equilibrium Supply and Demand
Curves in an Open Economy. American Journal of Agricultural Economics, vol.
75, Feb., p. 52-58.
Bullock, D.S., Minot, N., (2006). On Measuring the Value of a Nonmarket Good Using
Market Data. American Journal of Agricultural Economics, 88: 961-973.
Byerlee, D., Traxler, G., (1995). National and International Wheat Improvement
Research in the Post-Green Revolution Period: Evolution and Impacts. American
Journal of Agricultural Economics, 7:268-278.
Canning, P. N., Vroomen, H., (1994). Welfare Impacts of a Trade Restriction: An
Equilibrium Approach and Application in the Potash Industry. USDA-ERS
Coelli, T.J., (1996). Measurement of Total Factor Productivity Growth and Biases in
Technological Change in Western Australian Agriculture. Journal of Applied
Econometrics, 11:77-91.
Constantine, J.H., Alston, J.M., Smith, V.H., (1994). Economic Impacts of the
California One-Variety Cotton Law. Journal of Political Economy, 102:951-974.
Cooke, S.C., Sundquist, W.B., (1993). The Incidence of Benefits from U.S. Soyban
Productivity Gains in a Context of World Trade. American Journal of Agricultural
Economics, 75:169-180.
Dadakas, D. Katranidis, S.D., (2008). Single versus Multi-Market Approach:An
Application to the Greek Cotton Market. Atlantic Economic Journal, 36 (2008):
469–81.
Dadakas D., Katranidis S.D., (2010). The Effects of Trade Liberalization in Textiles
and Clothing on the Greek Market for Cotton yarn: A Multi-Market Analysis.
Review of International Economics, 18(1) 138-152.
Demont. M., J.F. Oehmke, and E. Tollens, (2006). Alston, Norton, and Pardey
Revisted: The Impact of Bt Maize in Spain. Working Paper 2006/89, Kotholieke
Universiteit Leuven, Faculty of Bioscience Engineering, April. Available on the
Efron B., Tibshirani R.J., (1993). An Introduction to the Bootstrap, Chapman and Hall,
New York.
European Commission Directorate-General for Agriculture (ECDGA), (2000). Impact
Analyses for Agenda 2000 Decisions for CAP Reform: Overview, Brussels:
ECDGA.
Feenstra R. C., Lipsey R.E., Deng H., Ma A.C., Mo H., (2005). World Trade Flows:
1962-2000, Working Paper 11040, National Bureau of Economic Research,
January.
Frisvold, G.B., Reeves,J.M., Tronstad., R., (2006). Bt Cotton Adoption in the United
States and China: International Trade and Welfare Effects. AgBioForum, 9(2):
69-78. Available on the World Wide Web: http://www.agbioforum.org.
Giannakas, K., Fulton, M., (2000). Efficient Redistribution Using Quotas and
Subsidies in the Presence of Misrepresentation and Cheating. American Journal of
Agricultural Economics, 82:347-359.
Gillig, Dhazn, Wade L. Griffin, Teofilo Ozuna Jr., (2001). A Bioeconomic Assessment
of Gulf of Mexico Red Snapper Management Policies. Transactions of the
Gisser, M., (1993). Price Support, Acreage Controls, and Efficient Redistribution.
Journal of Political Economy, 101:584-611.
Gotsch, N., Burger, K., (2001). Dynamic Supply Response and Welfare Effects of
Technology Change on Perennial Crops: The Case of Cocoain Malaysia. American
Journal of Agricultural Economics, 83:272-285.
Griliches, Z., (1957). Hybrid Corn: An Exploration in the Economics of Technological
Change. Econometrica, 25(October): 501-522.
Griliches, Z., (1958). Research Costs and Social Returns: Hybrid Corn and Related
Innovations. Journal of Political Economy, 66(1958): 418-431.
Hareau, G.G., Mills, B.F., and Norton, G.W., (2006). The Potential Benefits of
Herbicide-resistant transgenic rice in Uruguay: Lessons for Small Developing
Countries. Food Policy, 31: 162-179.
Jeong, K.S., Garcia, P., and Bullock, D.S., (2003). A Statistical Welfare Analysis of
the Japanese Beef Liberalization. Journal of Policy Modeling, 25:237-256.
Just R.E., and Hueth D.L., (1979). Welfare Measures in a Multimarket Framework.
Just R.E. , Hueth D.L. and Schmitz A., (2004). The Welfare Economics of Public
Policy: A Practical Approach to Project and Policy Evaluation, Edward Elgar
Publishing Inc., Cheltenham, UK.
Just R.E., Hueth D.L. and Schmitz A., (1982). Applied Welfare Economics and Public
Policy, Prentice-Hall, New York.
Kaplan, W., (1984). Advanced Calculus. Redwood City, California: Addison-Wesley
Publishing Company.
Kling, C.S, Sexton, R.J., (1990). Bootstrapping in Applied Welfare Analysis. American
Journal of Agricultural Economics, 72, 406-418.
McCorriston, S., Sheldon, I.M., (1994). Selling Import Quota Licenses: the U.S.
Cheese Case. American Journal of Agricultural Economics, 76:818-827.
Minot, N., and Goletti, F., (1998). Export Liberalization and Household Welfare: The
Case of Rice in Vietnam. American Journal of Agricultural Economics,
80:738-749.
Moschini, G., H.E. Lapan, and A. Sobolevsky, (2000). Roundup Ready Soybeans and
Moschini, G., Sckokai, P., (1994). Efficiency of Decoupled Farm Programs under
Distortionary Taxation. American Journal of Agricultural Economics,
76:362-370.
Noreen, E.W., (1989). Computer Intensive Methods for Testing Hypothesis: an
Introduction, NY: John Wiley & Sons.
Perrin, R.K. and L.E. Fulginiti, (2001). Technological Change and Welfare in an Open
Economy with Distortions. American Journal of Agricultural Economics, 83(2)
May: 455-464.
Schmitz, A., Boggess, W.G., Tefrtiler, K., (1995). Regulations: Evidence from the
Florida Dairy Industry. American Journal of Agricultural Economics, 77:5,
1166-1171.
Shumway, C.R., (1983). Supply, Demand, and Technology in a Multiproduct Industry:
Texas Field Crops. American Journal of Agricultural Economics, 65:4, 748-760.
Sumner, D.A., Wolf, C.A., (1996). Quotas without Supply Control: Effects of Dairy
Quota Policy in California. American Journal of Agricultural Economics,
78:354-366.
Thurman, W.N., (1991). Applied General Equilibrium Welfare Analysis. American
Thurman, W N., Easly, J. E., (1992). Valuing Changes in Commercial Fishery
Harvests: A General Equilibrium Derived Demand Analysis. Journal of
Environmental Economics and Management, 22 (1992):226–40.
Thurman W.N., Wohlgenant, M.K., (1989). Consistent Estimation of General
Equilibrium Welfare Effects. American Journal of Agricultural Economics,
71:1041-1045.
Vestergaard N., (1999), Measures of Wlefare Effects in Multiproduct Industries: the
Case of Multispecies Individual Quota Fisheries. Canadian Journal of