Two Modifications of Weight Calculation of the Non-Local
Means Denoising Method
Musab Elkheir Salih, Xuming Zhang*, Mingyue Ding
School of Life Science and Technology, Huazhong University of Science and Technology, Wuhan, China Email: *[email protected]
Received 2013
Abstract
The non-local means (NLM) denoising method replaces each pixel by the weighted average of pixels with the sur- rounding neighborhoods. In this paper we employ a cosine weighting function instead of the original exponential func- tion to improve the efficiency of the NLM denoising method. The cosine function outperforms in the high level noise more than low level noise. To increase the performance more in the low level noise we calculate the neighborhood si- milarity weights in a lower-dimensional subspace using singular value decomposition (SVD). Experimental compari- sons between the proposed modifications against the original NLM algorithm demonstrate its superior denoising per- formance in terms of peak signal to noise ratio (PSNR) and histogram, using various test images corrupted by additive white Gaussian noise (AWGN).
Keywords: Non-Local Means; Singular Value Decomposition; Weight Calculation
1. Introduction
Image denoising is one of the most important techniques and necessary preprocessing steps in image processing and computer vision. Denoising is to remove unwanted noise to enhance and restore the original image. Many methods for image denoising have been suggested, and a review of them can be found in [1]. Among them that paper also proposes the NLM denoising method, which gives state-of-the-art results. This method replaces each pixel with a weighted average of other pixels with similar neighborhoods. The basic idea is that images contain re- peated structures, and averaging them will reduce the noise [2]. This new concept for image denoising is popular in other image processing areas, such as texture synthesis, where a new pixel is synthesized as the weighted average of known image pixels with similar neighborhoods [3-5].
The issue of measuring similarity between pixels, or patches is a hot topic in many applications of image processing, machine learning, computer vision, informa- tion retrieval and document clustering. Document clus- tering is the measuring of similarity between documents. In this the document is mapped into the vector space, and similarity is measured by the angles between the vectors using cosine function. The smaller the angle between two documents, the larger the cosine of the angle is and the higher the similarity is; and vice versa [6]. So the cosine is a decaying function of the angle between two docu-
ments.
The original NLM filter uses the exponential decaying function as a weighting function for the similarity mea- surement and weight calculation. In compare to cosine function the exponential function decays faster than co- sine function and this will reduce the effect of averaging of the NLM filter. Because of this, we proposed a NLM denoising method using the cosine function. The outper- formance of cosine function mainly appears in high level noise. To increase the performance more in the low level noise we combine the cosine weighting function and SVD. The SVD belongs to a class of dimensionality re- duction techniques that deal with the uncovering of latent data structures and often associate noise to the least im-portant components. Dimensionality reduction is a noise reduction process. Removing noise before calculate the similarities between patches around the pixels will en- hance the weight calculation and increase the perfor- mance of NLM algorithm.
The rest of this paper deals about the following. Sec- tion II introduces the classical NLM algorithm. In section III, the proposed method followed to modify the classical NLM algorithm is introduced. In this, we use a cosine weighting function for the weight calculation, then com- bine the cosine function with SVD in the low level noise. The results & discussions for four test images at various noise levels are shown in Section IV. Section V con- cludes the paper and proposed future work for more im- provement to the NLM denoising method.
2. Non-Local Means Filter
The NLM method [1,7] estimates the intensity of each pixel x in the noisy image u by a weighted average of all of the pixel intensities in the image (as a convention, we will refer to the pixel being denoised at any given time as the “pixel of interest” (POI), denoted x, and denote all other pixels as y). The weights w(x, y) reflect the proba- bility that the POI (x) has the same intensity value as the pixel is being compared to (y). This probability is based on the similarity between the neighborhoods around x
and y.
The weighting function can be considered as a de- creasing function depending on the similarity of the patches around the POI. If a particular local difference has a large magnitude then the value of w(x, y) will be small and therefore that measurement will have little effect on the output image. A small neighborhood, or “patch”, around each pixel is used to compute the L2 norm. The weighting factor w(x, y), is then a normalized weighted Gaussian function of this L2 norm. Consider a discrete noisy image u = f + n, in which n is AWGN. The NLM filter is written as
where,
where Nd(y) represents the square patch of size (2d + 1)
× (2d + 1) centered at x, and W is a normalizing term,
W(x) =
(
,)
vw x y u
∑
. The parameter h will be referred to as the filter parameter that controls the decay of the exponential expression in the weighting scheme. This parameter is typically controlled manually in the algo- rithm. Choosing a very small h leads to noisy results identical to the input, while very large h gives an overly- smoothed image [8].3. Methodology
3.1. Weight Calculation Using Cosine Function
The L2 norm of the difference between two pixels was used as input to the cosine function instead of the expo- nential function. Figure 1(a) demonstrates the behavior of the two functions to an arbitrary input. The exponen- tial function was decayed faster than cosine function, which lead to finishing the weight to zero value instantly for dissimilar patches, or to a very small weight values even for the little bit dissimilar patches. This fast decay reduced the effect of averaging and smoothing of the NLM filter. On the other side, the cosine function’s de- cay was slower than exponential function, and so it gave a considerable weight values for the dissimilar or the
little bit dissimilar patches instead of zero or small values. Because of this, our proposed method was based on us- ing the cosine function instead of the exponential one. For more investigation of different decay behaviors of the two decreasing functions, we calculated the weight corresponding to the dissimilarity measurement of all 7 × 7 patches in 13 × 13 search window around the pixel (20, 20) in the left top smooth sky background region of the house image corrupted by white Gaussian noise, with standard deviation (σ) = 40, shown in Figures 1(b). It appears that cosine function has given higher suitable weight values while the exponential function has given small weight values.
This is the major advantage of using cosine function and results shown in Figures 1(c), (d) proved this. This advantage has an important effect in the weight calcula- tion of the NLM denoising algorithm, so the cosine func- tion was more robust weighting function, and we used it in NLM algorithm denoising for an efficient implemen- tation of this algorithm.
3.2. Weight Calculation in the Reduced Dimensional Space Using Singular Value Decomposition
In 1965 G. Golub and W. Kahan introduced the SVD as a decomposition technique for calculating the singular val- ues, pseudo-inverse and rank of a matrix [9]. The tech- nique decomposes a matrix A into three new matrices
where:
U is a matrix whose columns are the eigenvectors of the AAT matrix. These are termed the left eigenvectors.
S is a matrix whose diagonal elements are the singular values of A. These are ordered in decreasing order along
Figure 1. (a) Exponential and cosine weighting function; (b) Dissimilarity measurement of the pixel (20, 20) of house image; (c) and (d) Weight calculation using exponential func- tion and cosine function corresponding to similarity mea- surement respectively.
( )
( ) ( )
f x, y w x, y u y y
=
∑
(
)
( )
2(
( )
)
(
( )
)
22
1 1
, exp d d
w x y u N x u N y
W x h
−
= −
T
[image:2.595.309.532.511.678.2]the diagonal of S, i.e. s1 > s2 > s3 > ··· sn.
V is a matrix whose columns are the eigenvectors of the ATA matrix. These are termed the right eigenvectors. When computing the SVD of a matrix is desirable to reduce its dimensions by keeping its first k singular val- ues.
T
K K K K A =U S V
This process is termed dimensionality reduction, and
AK is referred to as the rank k Approximation of A, or the
“Reduced SVD” of A. If we eliminate dimensions by keeping the three largest singular values, this is a rank 3 approximation [10]. The top k singular values are se- lected as a mean for developing a “latent semantics” re- presentation of A that is now free from noisy dimensions. This “latent semantics” representation is a specific data structure in low-dimensional space in which documents, terms and queries are embedded and compared. This hidden or “latent” data structure is masked by noisy di- mensions and becomes evident after the SVD. We re- placed the distances
( )
(
)
(
( )
)
22
1 d d
u N x u N y
h
− −
(3) by
( )
(
)
(
( )
)
22
1 d d
u P x u P y
h
− −
(4)
where Pd represents the projections of Nd onto the low- er-dimensional space determined by the SVD. If Nd is a particular row in A, then the weights for Ndare just the corresponding row in U multiplied by diagonal elements of S. The weights for Nd are referred to as projection of
Nd into the k-dimensional space. Better denoising is ob- tained when similarity between pixels is computed using the dimension reduction introduced by the SVD.
4. Experiment Results and Discussions
In the experiment, the size of patch, search window, h
parameter values and rank k Approximation were se- lected corresponding to the best PSNR value. Our pro- posed NLM algorithm was applied on four test images (Lena, Cameraman, Pepper, and House); Using a 256 × 256 image size for all the images, and a 128 × 128 image size for Lena image. The test images were corrupted by
AWGN with zero mean at σ = 10 (low noise level), and 40 (high noise level). The results were shown using PSNR in decibels (dB) and histogram to demonstrate the superior performance of the proposed method in noise reduction. We used the PSNR measurement defined as
2
10 log MAX
PSNR
MSE
=
where, MSE is Mean Square Error, and MAX is maxi-
[image:3.595.310.538.614.735.2]mum intensity value.
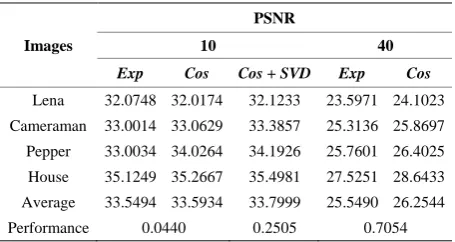
Table 1 lists The PSNR comparison results. Using co- sine function produces better PSNR values when com- pared to the original NLM algorithms for all the different noise levels. The average performance is high (0.7054 dB) for the all images corrupted by a high level noise, while it is low (0.0440 dB) for the all images corrupted by low level noise.
That means the cosine function outperforms in the high level noise and this because of the dissimilarity be- tween patches will increase more than in the low level of noise the and so the exponential function will give zero or small weight values while cosine weight function will give them more and suitable weight values. This is useful, and it enhances the effect of averaging and smoothening of the NLM filter.
The results show that the most cosine function supe- riority, where the performance is (1.12 dB), mainly ap-
pears in the noisy (AWGN) house image, (σ = 40). To
increase the average performance for the images cor- rupted by low level noise, which is low as we mentioned previously, we combined the SVD with cosine function to calculate the distances between the pixels in the low dimensional space rather than the full space. The results showed an increased accuracy over using the full space. The average performance increased form (0.0440 dB to 0.2505 dB). This is because the hidden or “latent” data structure is masked by noisy dimensions and becomes evident after the SVD. And similarity computed in low- er-dimensional space becomes more accurate because SVD remove noisy dimensions.
Although we only applied the SVD on images cor- rupted by low level noise to increase the performance of the algorithm; but also it will work for images corrupted by moderate level noise. Because the noise will increase more than in the low level of noise but SVD will remove it and the weight calculation will be more efficiency. Our method works well for all the images, but it works better for images (House and Pepper) which have a smooth region more than images (Lena and Cameraman) which have more details.
Table 1. Performance of the original nonlocal means de- noising algorithm and the modified algorithm.
Images
PSNR
10 40
Exp Cos Cos + SVD Exp Cos
Lena 32.0748 32.0174 32.1233 23.5971 24.1023 Cameraman 33.0014 33.0629 33.3857 25.3136 25.8697 Pepper 33.0034 34.0264 34.1926 25.7601 26.4025 House 35.1249 35.2667 35.4981 27.5251 28.6433 Average 33.5494 33.5934 33.7999 25.5490 26.2544 Performance 0.0440 0.2505 0.7054
(a) (b) (c) (d)
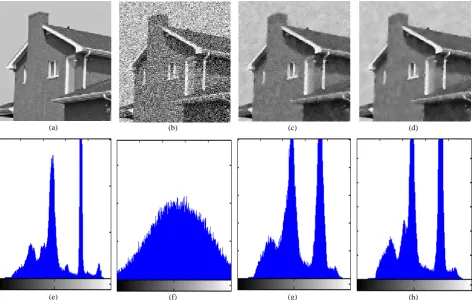
[image:4.595.63.536.85.385.2](e) (f) (g) (h)
Figure 2. Histograms of the: (a) Original image (b). Noisy image. (c) and (d) Denoised image by nonlocal means denoising algo- rithm using exponential and cosine function respectively.
Figure 2 shows, that using exponential or cosine func- tions with the NLM filter retrieves a similar histogram and distinguishes three main peaks of the histogram of the original image. However, the cosine function in- creases the sharpness of the peaks and the contrast be- tween them, because there is a small peak appears in the histogram of the filtered image using the cosine function and do not appear when using exponential function.
5. Conclusion and Future Work
This work shows that using cosine weighting function and computing the similarity in lower-dimensional space increases the effect of averaging and denoising perfor- mance of the NLM denoising algorithm, in low and high level noise especially for smooth images. The next work is seeking for another and most appropriate weighting function that will enhance this filter even for images containing more details. Furthermore, it will be very suitable if we use the weighting function locally instead of globally to suit the structure of the image. By selecting a function preserves the edges for image with high details, and for a smooth region choosing a function preserves the smoothness. Also a future work is to find another robust dimensionality reduction method to remove the noisy dimensions instead of SVD. This will be a good
direction to improve the efficiency of NLM algorithm.
References
[1] A. Buades, B. Coll and J.-M. Morel, “A Review of Image Denoising Algorithms, with a New One,” SIAM Journal on Multiscale Modeling and Simulation, Vol. 4, No. 2, 2005, pp. 490-530.
[2] W. Jin, et al., “Fast Non-Local Algorithm for Image De- noising,” 2006 IEEE International Conference on Image Processing, 2006, pp. 1429-1432.
[3] A. A. Efros and T. K. Leung, “Texture Synthesis by Non- parametric Sampling,” Proceedings of the IEEE Interna- tional Conference on Computer Vision, Corfu, Greece, September 1999, pp. 1033-1038.
[4] Y. Wexler, E. Shechtman and M. Irani, “Space-Time Video Completion,” Proceedings of the IEEE Interna- tional Conference on Computer VisionPattern Recogni- tion (CVPR), 2004.
[5] L. Yatziv, G. Sapiro and M. Levoy, “Light Field Comple- tion,” Proceedings of the IEEE International Conference on Image Processing, Singapore, 2004.
[6] J. Zeng, et al., “A Matching Method Based on SVD for Image Retrieval,” 2009, pp. 396-398.
and Movie Denoising,” International Journal of Comput- er Vision, 2007, to Appear.
[8] J. Orchard, et al., “Efficient Nonlocal-Means Denoising Using the SVD,” ICIP 2008, 15th IEEE International Con- ference on Image Processing, 2008, pp. 1732-1735.
[9] G. Golub and W. Kahan, “Calculating the Singular Val-
ues and Pseudo-Inverse of a Matrix,” SIAM Journal on Numerical Analysis, Vol. 2, No. 2, 1965.
[10] E. Garcia, “SVD and LSI Tutorial 3: Computing the Full SVD of a Matrix,” 2006.