DEVELOPMENT OF METHODS
FOR THE DETERMINATION
OF THE HIGH TEMPERATURE W
THERMAL DIFFUSIVITY OF UC
iliii
:
l?i§li IlliiliiliiS
MUSTACCHI and S. GIULIANI
r;$*'\
1963 ¿M
SÉ SÉS
Wmtë-Nuclear Research Center ra Establishment - Italy
Physical Chemistry Service
i
f™
wm
m
LEGAL NOTICE
This document was prepared under the sponsorship of the Commission of the European Atomic Energy Comm
Neither the EURA' behalf :
unity (EURATOM).
ATOM Commission, its contractors nor any person acti ι acting on their
lÜHt'i
Io — Make any warranty or representation, express or implied, with respect to the accuracy, completeness, or usefulness of the information contained in this document, or that the use of any information, apparatus, method, or process disclosed in this document ma; not infringe privately owned rights; or
2° — Assume any liability with respect to the use of, or for damages resulting from the use of any
ÍM
%n
The a u t h o r s '
m
Mi
report can be obtained, at the price of Belgian Francs 60, PRESSES ACADÉMIQUES EUROPÉENNES, 98, Chaussée de Charleroi, Brussels 6.
Please remit payments :
— to BANQUE DE LA SOCIÉTÉ GÉNÉRALE (Agence Ma
•1
Campagne) Brussels — account No. 964.558; —
— New York — account No. 121.86;
London E. C. 2,
— to BELGIAN AMERICAN BANK and TRUST COMPANY — New York — account No. 121.86;
— to LLOYDS BANK (Foreign) Ltd 10 Moorgate
giving the reference : " E U R 337.e — Development of Methods for the Determination of the High Temperature Thermal Diffusivity of U C " .
••tiisaiiSffiffiJ
HI'
ρ
■äs»
Ê
m
EUR 337.e
DEVELOPMENT OF METHODS FOR THE DETERMINATION OF THE HIGH TEMPERATURE THERMAL DIFFUSIVITY OF UC
by C. MUSTACCHI and S. GIULIANI
European Atomic Energy Community — EURATOM Joint Nuclear Research Center
Ispra Establishment (Italy)
Materials Department — Physical Chemistry Service Brussels, August 1963, pages 27 + figures 11.
A simple modulated electron gun is used to determine the thermal diffusivity of uranium carbide in the range 1000° to 2000 °C. Both a sine wave and a pulse techniques are applied to thin wafer shaped samples of carbide. Temperature of the hind face is detected by means of a photocell-oscilloscope arrangement. Arc-cast carbide yielded a value .049=fc .004 cm2 sec-1 for thermal diffusivity in the range in question.
Values for emissivity, electrical and thermal conductivity were measured or derived for uranium carbide.
EUR 337.e
DEVELOPMENT OF METHODS FOR THE DETERMINATION OF THE HIGH TEMPERATURE THERMAL DIFFUSIVITY OF UC
by C. MUSTACCHI and S. GIULIANI
European Atomic Energy Community — EURATOM Joint Nuclear Research Center
Ispra Establishment (Italy)
Materials Department — Physical Chemistry Service Brussels, August 1963, pages 27 + figures 11.
A simple modulated electron gun is used to determine the thermal diffusivity of uranium carbide in the range 1000° to 2000 °C. Both a sine wave and a pulse techniques are applied to thin wafer shaped samples of carbide. Temperature of the hind face is detected by means of a photocell-oscilloscope arrangement. Arc-cast carbide yielded a value .049± .004 cm2 sec-1 for thermal diffusivity in the range in question.
Values for emissivity, electrical and thermal conductivity were measured or derived for uranium carbide.
EUR 337.Θ
DEVELOPMENT OF METHODS FOR THE DETERMINATION OF THE HIGH TEMPERATURE THERMAL DIFFUSIVITY OF UC
by C. MUSTACCHI and S. GIULIANI
European Atomic Energy Community — EURATOM Joint Nuclear Research Center
Ispra Establishment (Italy)
Materials Department — Physical Chemistry Service Brussels, August 1963, pages 27 + figures 11.
A simple modulated electron gun is used to determine the thermal diffusivity of uranium carbide in the range 1000° to 2000 °C. Both a sine wave and a pulse techniques are applied to thin wafer shaped samples of carbide. Temperature of the hind face is detected by means of a photocell-oscilloscope arrangement. Arc-cast carbide yielded a value .049± .004 cm2 sec-1 for thermal diffusivity in the range in question.
EUR 337.e
EUROPEAN ATOMIC ENERGY COMMUNITY - EURATOM
DEVELOPMENT OF METHODS
FOR THE DETERMINATION
OF THE HIGH TEMPERATURE
THERMAL DIFFUSIVITY OF UC
by
C. MUSTACCHI and S. GIULIANI
1963
Joint Nuclear Research Center Ispra Establishment - Italy
I N D E X
1 — SCOPE OF THE RESEARCH
2 — HIGH TEMPERATURE CONDUCTIVITY MECHANISMS
3 — CHOICE OF A METHOD OF MEASUREMENT
4 — EXPERIMENTAL SETUP
4.1 — Electron gun 4.2 — Power supplies 4.3 — Modulation 4.4 — Phase analysis 4.5 — Samples
5 — EXPERIMENTAL PROCEDURES
5.1 — Amplitudes
5.2 — Output face phase shift 5.3 — Differential phase shift 5.4 — Pulse lag
6 — RESULTS
6.1 — Calibration runs 6.2 — Uranium carbide
APPENDIX I — Transfer function of hollow cylinder
APPENDIX II — Transfer functions in plane geometry
APPENDIX III — Determination of other physical constants
DEVELOPMENT OF METHODS FOR THE DETERMINATION OF THE HIGH TEMPERATURE THERMAL DIFFUSIVITY OF UC
SUMMARY
Asimple modulated electron gun is used to determine the thermal diffusivity of uranium carbide in the range 1000° to 2000°C. Both a sine wave and a pulse techniques are applied to thin wafer shaped samples of carbide. Temperature of the hind face is detected by means of a photocell-oscilloscope arrangement. Arc-cast carbide yielded a value .049= .004 cm2 sec- 1 for thermal diffusivity in the range in question.
Values for emissivity, electrical and thermal conductivity were measured or derived for uranium carbide.
1 — SCOPE OF THE RESEARCH
As a first step in a comprehensive research program to investigate gap or contact conduc tance between a UC fuel pellet and metal clad, it was felt necessary to determine the UC thermal conductivity in the full range of temperatures encountered in an operating reactor.
Preliminary data on fission gas release from sintered and fused UC pointed out to operating temperatures as high as 1600°C with fairly substantial retention of said gases.
However, no measurements of thermal properties of UC are available beyond 800"Ci1). Further, no reliable method is known for extrapolating thermal conductivity of UC to high temperatures.
These facts led us to aim at the development of methods suitable for a quick determination of ceramic fuels conductivity in the range 1000 to 2000 °C.
2 — HIGH TEMPERATURE CONDUCTIVITY MECHANISMS
In order to evaluate the uncertainties in the extrapolation of low temperature data, a simple analysis of the contribution of different phenomena to heat transport in UC is given hereafter.
The three main mechanisms of heat transport through solids are : a) migration of electrons or holes
b) lattice vibrations propagation
c) transparency of electromagnetic radiation.
The contribution of mechanism a) can be estimated by means of the Wiedemann-Franz relation
γ = 2 K*/e*
where ρ = electrical resistivity
Τ = temperature, degrees Kelvin ΛΊ = thermal conductivity
Κ = Boltzmann constant
e = electronic charge
is reported to increase linearly with temperature, it may be expected that ΑΊ at 800°C will be but little different than at 100°C. This means that at least in the range 100 to 800°C (4) the contri bution of mechanism a) is but little affected by temperature and ranges from 50 to 60% of overall thermal conductivity (*).
As to mechanism b), its contribution is (5) : 3 Kiv K2 =
σ
where / is the phonon mean free path ν = sound velocity
C = lattice constant
With high impurity levels, / approaches C. Call / = « C to measure the mean free path in lattice parameter units
3Kvn
K2 C
2
With a modulus of elasticity 222 106 kg/cm2 (*) and a density d = 13,6, the velocity of sound is
ν = —pS = 4,000 m/sec. a
With a lattice constant C = 5 Å (6) = 5 X 10"10 m
3 χ 1,4 χ ΙΟ"23 χ 4,000« „ w nnrn w
fa = -τ?(5 X 10"ΤΤΓΓΤ^Γ^ 10)2 = 6 7 H — °C X m = .0067«°C X cm
It may be expected (7) that η decreases from, say 20 at ambient temperature to a value
of 2 or 3 at temperatures in excess of 1000°K.
The lattice contribution to thermal conductivity would then be about. 13 wl°C cm at 100 °C and .02 vv/°C X cm at 1000°K.
By summing the contributions of mechanism a) and b), we can account for the whole thermal conductivity at ambient temperature, i.e.
K=K! + K2= . 1 4 + . 1 3 = .27M'/cm°C
and we might expect a conductivity at 1500°K.
K= . 1 4 + .02 = .16M'/cm°C.
At higher temperatures, we must, however, take into consideration mechanism c). To evaluate an order of magnitude for this mechanism, we can use a simplified Genzel model (8) as proposed
by earlier workers (810). In this model, radiation has an average absorption coefficient charac
teristic of the transparent regions of the infrared spectrum, say a = . 1 cm 1.
A photon undergoes a random walk with a scattering process at each crystallite boundary. The effective mean free path is given by (9)
a' = (a/d)1'2
where d is the mean diameter of the crystallites. The contribution to heat transport will be
3 a
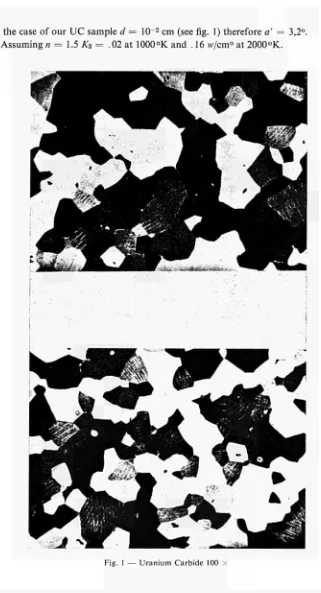
In the case of our UC sample d = IO-2 cm (see fig. 1) therefore a' = 3,2°.
[image:11.595.111.432.55.648.2]Assuming n = 1.5 K3 = .02 at 1000°K and . 16 M'/cm° at 2000°K.
Fig. 1 — Uranium Carbide 100 χ
3 — CHOICE OF A METHOD
In order to select a method best adapted to the problem on hand, we had to meet the following specifications :
a) Small amounts ( < 5 g) of material must be sufficient to enable one to handle reasonable amounts of activity in the case of irradiated UC.
b) Measurements must be performed in a high vacuum, because of the high chemical reactivity of UC in the range of temperature 1000-2000 °K.
c) Direct temperature measurements and the use of thermocouples have to be avoided as far as possible, since no material is reportedly compatible with UC beyond 1500°K, at least as far as relying upon failsafe thermocouple performance.
Because of end effects in small samples and the necessity of using thermocouples, spec. (*)
and (3) rule out any steady state method, be it longitudinal or radial.
We are left with a choice among the several transient methods consisting in an analysis of the transfer function, temperature vs. power input in a sample.
This power input function can be a sine wave, a square wave or a pulse.
As for temperature measurements we chose an optical method using a photoconductive cell as a sensing device and for heating, after examining the possibility of using an arc image furnace, a laser flashhead or a high frequency generator (induction furnace), we finally selected an electron gun system on account of the relative ease of modulating the power input.
As far as the geometry of the sample is concerned, two shapes were investigated : the hollow cylinder and the thin wafer. The transfer functions for both cases are given in Appendices I and II. Calculation and plots made with the help of the Ispra IBM 7090 computer showed that a better sensitivity was to be expected in the wafer geometry. Further, this geometry leads to simpler sample preparation and electron gun design.
Summarizing the specifications :
— UC wafers are 1 to 3 mm thick and about 12 mm dia.
— Electron gun heating is performed in a vacuum better than 10~5 mm Hg.
— Modulation of power input is obtained by control of the electron beam, thus allowing a wide range of input wave forms.
— A photoresistive cell is used to measure temperature variations.
4 — EXPERIMENTAL SETUP
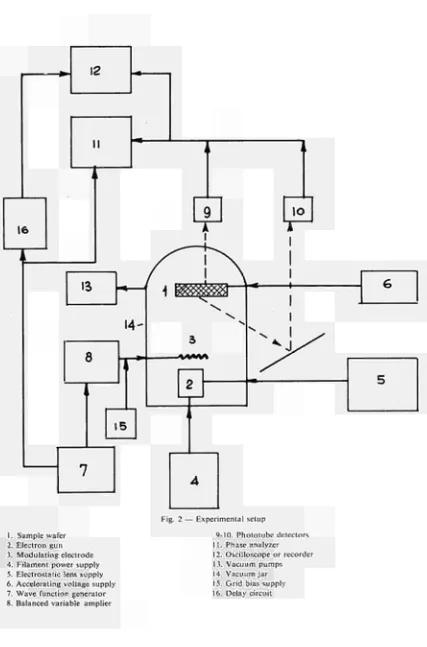
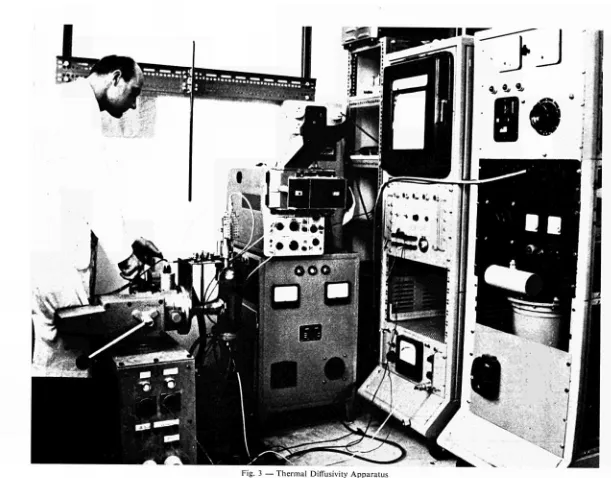
The scheme of the apparatus is given in fig. 2 and its overall setup in fig. 3.
4.1 — Electron gun
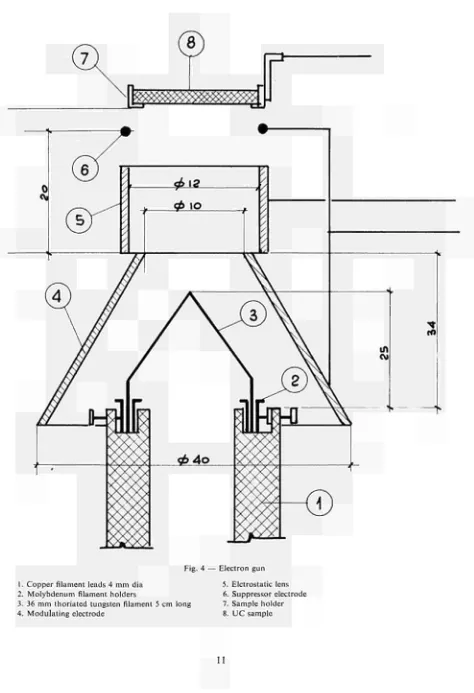
Following Pierce's advice (*), a trial-and-error construction was made. After a number of changes the gun attained a relative peak of selection and looked somewhat as shown in fig. 4 and 5.
Fig. 2 — Experimental setup
1. Sample wafer 2. Electron gun 3. Modulating electrode 4. Filament power supply 5. Electrostatic lens supply 6. Accelerating voltage supply 7. Wave function generator 8. Balanced variable amplier
9-10. Phototube detectors 11. Phase analyzer
8
Fig. 4 — Electron gun
1. Copper filament leads 4 mm dia 2. Molybdenum filament holders
3. 36 mm thoriated tungsten filament 5 cm long 4. Modulating electrode
5. Elctrostatic lens 6. Suppressor electrode 7. Sample holder 8. UC sample
'... ..: Fig. 5 — Electron gun
A thoriated tungsten filament behaves as a point source. Electrode (4) is used both for focusing the beam and for modulating the beam current. It is generally operated with a fixed negative bias of — 80 V on which a modulation is superposed with a maximum amplitude of
150 V. Electrode (5) is a nickel cylinder biased at +2500 V to cause a slight convergence of the beam. Suppressor electrode (6) is a molybdenum wire fit to prevent overheating and melting of sample holder (7). It is electrically connected to electrode (4).
The system as described resulted in a perveance of about 1.4 χ 10~7 amp χ volt-3'2 and an amplification factor 50 to 100 when operated with an accelerating voltage of 5 KV and a filament heating power of 60 W.
The electron spot is fairly uniform and covers the whole target. Some filament sputtering, especially when vacuum is not better than 10-5 blackens the vacuum jar and causes shift in the absolute measurements of radiation without affecting the linearity of response of the photodiodes.
4.2 — Power supplies
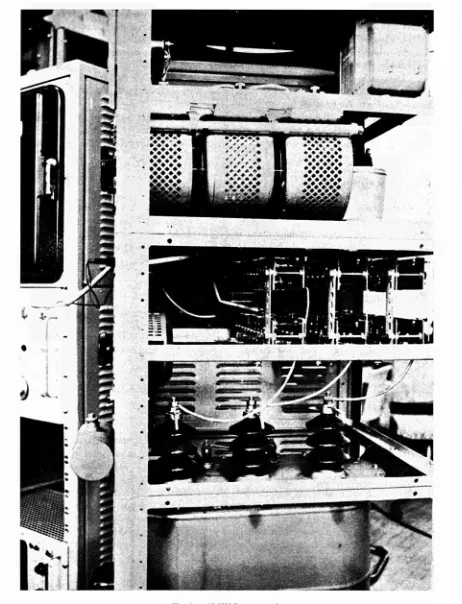
We used an unstabilized selen;um rectifier liable to give up to 20 V and 50 A to heat the filaments. A conventional G. M. power supply was used for the lens (max. 3000 V 10 ma). As to the accelerating DC supply, nothing suitable was found on the market and we built a 10 KV 500 ma max. rectifier using silicium diodes (fig. 6). This unit was voluntarily overdesigned to obtain an all-purpose HT source for future use.
4.3 — Modulation
Modulation was achieved by means of a wave function generator operated in the range .01 cps. to 100 cps. If the wave shape was to be a single pulse, a variable delay circuit was inserted between the oscilloscope trigger and the wave generator. This delay circuit provided us with a reference line for intensities measured on the oscilloscope.
4.4 — Phase analysis
Phase lags were determined with three different systems :
— Nyquist plots were made using a Solartron Resolved Component Indicator which indicated values for the component in phase and at 90 degrees to the modulating signal. Unfor tunately, at frequencies below 5 cycles the system was too unstable to yield accurate results.
— A Tetronix 502, dual beam oscilloscope with a Polaroid camera was used to take pictures of both the modulating signal and the output with fairly reproducible results.
— A home-made analyser is currently being tested. It consists in a pulse generator, a pulse counter, a sinus wave generator and two flip-flop circuits. One flip-flop triggers the counter circuit when the modulating sinus passes by the zero reference line. The other flip-flop stops the counter when the output signal passes through the same reference line. Phase lags are read directly on the counter in degrees of angle.
4.5 — Samples
Vacuum melted UC pellets 1/2" dia. and one-and-half inch long were obtained from the Parsons Co. These samples were delivered in an as-cast condition and titled 4.8 wt. percent C*. 1.
i
[image:18.595.92.554.89.693.2]%
Fig. 6 — 10 KV Power supply
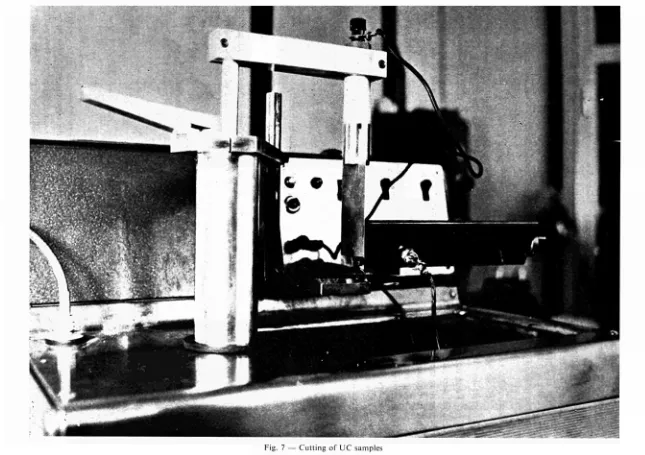
Crystallites were fairly uniform in size (10~2 cm) and showed tiny speckles of uncombined carbon (see fig. 1). Wafers 1 to 3 mm thick were spark-cut in a kerosene bath to prevent oxidation of the samples. The sparking electrode was a brass plate . 3 mm thick (fig. 7). It underwent a linear consumption of the same order as that of the sample but left no undesired contamination on the wafer itself.
The samples were also planed by electro-sparking in kerosene, then thoroughly washed in acetone before insertion in the vacuum jar holder. At the end of this preparation UC averaged a content of 2 ppm H2, 90 ppm O2 and about 500 ppm N2.
5 — EXPERIMENTAL PROCEDURES
Four different methods were tested. Whatever method was used, after mounting the sample, necessary adjustments had to be made in electrode potentials to focus the spot without overheating the holder. Albeit electrode distances were found non-critical, centering of the system had to be done accurately.
For every run a calibration was made of the photocell output vs. sample temperature. The latter was measured by means of an optical pyrometer, correcting readings with an emissivity
. 9 (see Appendix III).
Since darkening of the jar would prevent temperature readings at later stages of the run, a calibration was made of the power input vs. temperature.
5.1 — Amplitude method
The amplitude method makes use of relation (2) of Appendix II, namely
/"(—τ-) = — \/\2/2x -\/w-\- constant
frequency is varied between, say, .01 cps. and 100 cps. At each frequency the amplitudes At0 and Δ t\ of the temperature fluctuations on the hind and front faces are measured on the oscillo scope trace. A plot is made of
1 At0 re
logio -j~t vs V7
the slope of such a plot will be
Thermal diffusivity is obtained as :
*/> _5 9/ i v
(2,3)2 S2 \S
Once again we notice that since the slope alone is necessary, the absolute value of tempe rature fluctuations or the relative efficiency of either phototube system is not necessary. However, by means of the aforesaid temperature calibrations, a check was made to be sure that temperature fluctuations did not exceed 10°C and therefore, temperature could be considered constant in that interval.
5.2 — Output face phase shift method
t a n g ÔQ
This method makes use of relation (4), Appendix II, i.e.
¿>(tgß tg/?5) + laß tgB tghß + 2ß2(tgß + tg/;5)
b(tgB + tghß) + laß - Iß2 . (tgB - tghß)
Here again frequency is varied between .01 cps. and 100 cps. and the phase lag between electron modulation and output face temperature is measured as described in 4.5. The major uncertainty in this method is the determination of factor a. One way to overcome this difficulty is (12) the determination of the frequencies for which the phase lag is π/4 and π/l. The ratio of these
frequencies yields a value for a.
However, a flexus in the plot <5o vs. \/f around So = π/2 prevents a precise determination of / (π/2). This happens especially with materials of low diffusivity (a < . 1 cm2 sec1).
For this reason although this method was fully successful with metals, it yielded poorly reproducible results for UC.
5.3 — Differential phase shift method
This method, derived from relations (3) and (4) of Appendix II, largely eliminated the difficulties of method 5.2.
Two photocells and a mirror are used to measure simultaneously the temperature fluc tuations on both faces of the wafer.
This method is fairly insensitive to the value of a (see Appendix II) and therefore requires one datum alone at a single frequency. The results obtained had very good reproducibility.
5.4 — Pulse lag method
This method is based on relation (1) Appendix II :
α = 1.38/2/π2/ι/ 2
A square pulse of 10 to 25 msec duration is impressed upon the grid. A picture is taken of the oscillogram of the hind face temperature. The time Γ1/2 required for temperature to attain one half of its maximum value is determined.
One requirement in this method was that in order to approximate a Dirac delta function heating, the pulse duration Γ must be much smaller than ti¡2, that is
1,38 I2
Τ < —
^ π2 2α
2 5 X ÍO^2 Χ π2
with Τ = 2.5 χ 10~2 sec, α1/2 must be > — —— α
1.38
that is : 1 > .18 χι<2
with α of the order of .04 cm2 sec 1 α1·2 <ξ .1
1 > .036 cm.
A check was also made on one hand of the maximum temperature increase at the front face (to avoid melting or phase changes) and on the other hand the temperature increase on the hind face, to make it negligible as compared with operating temperatures. The temperature history at distance Λ: from the surface due to a pulse of energy/(i) is given by
1 Γ / ( ' - z) e xP ( - *2/4 · z)dz
T(x, t)
Γ Δ
Ja
Z)C(Tia)1/2 J ζ1'2
where D = density C = specific heat α = diffusivity
With a square pulse of duration a and height h
= h for 0 < ί < a
Λ ) = 0 t>a
TYP. A l ff{tz)dz Ih
-7 ( 0 , 0 = DCa(n*W J - Ι Ϊ 7 2 — = DC^oc)V2 ^ l ~ ^
the total pulse energy is E = ah, therefore IE
T ^ = D C a ^ ^ W t - V t - a )
Using the measured static characteristics of the experimental arrangement with an accele ration potential 3 KV, a = 25 χ IO-3 sec a pulse height 150 V, the pulse energy is calculated to be 2.55 joule/cm2; therefore, with D = 3.5, C = .2 joule/g°C, α = .05 cm2 sec- 1
Γ(0, i) = 173 (y'/ - V t - .025)
which has a maximum at / = .025 sec equal to 27.3 °C. This very low temperature increase guarantees that no melting or phase change will occur.
As to the hind face, its maximum temperature raise is given by £
Δ Τ —— with E = 2.25 joule/cm2, 1 = . 3 cm
D and C as above 2 55
ΔΤ = — == 3.15°C
3 χ 13.5 χ .2
This is in fact the temperature variation on which we currently based our measurements in this method. Reproducibility was very good.
6 — RESULTS
6.1 — Calibration runs
No reliable ceramic material with known thermal diffusivity between 1000 and 2000 °K was available. For this reason, calibration runs were made using Nickel, Molybdenum and Niobium samples with the following results :
IO
.o9
-.od ■
.07
-.06 ■
•05 .
.04
-.OJ ·
.02
-01
-d.
cmz s e c
r- y \S \
- 1
JC j^S \ x \ x \.s \^s \
NCA¿.C'j> Fßuro REF I
I I
F U S E P U C
T H E R M A L t>»FFos»viTY
( T l p i c a \ r u n )
PIÖ.Ö
A^3> 6
O
D
°
0
Δ
1 1 1
0
Δ°·
1
□ 4 , M P U T O t s í METHO t)
Δ. O U T P U T PHASE SHIFT
• MFFERENTI4.l_ Ρ Η / Λ Ε SWIFT O PUI-6E L A S
ρ
Λ 4° π
Α ·Q ° *
Ι ι *
2οο 4 ° ° ö o o 6 ο ο ΙοοΟ ι2οο Ι4οθ
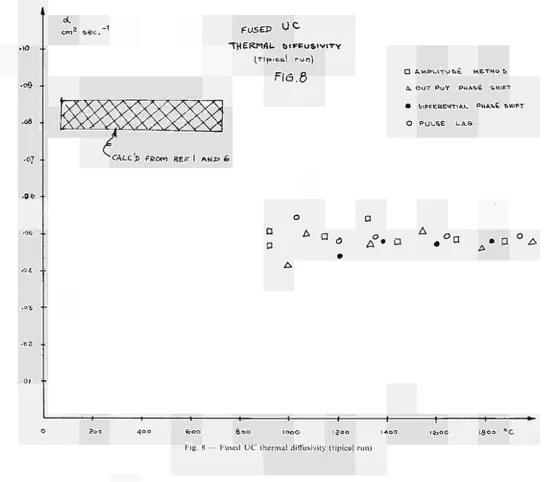
Fig. 8 — Fused UC thermal diffusivity (tipical run)
[image:23.842.167.725.47.529.2]Temperature °C 1200 1200 1750 1500 Material Nickel Molybdenum Molybdenum Niobium Thermal Diffusivity
cm2 sec- 1
Measured .046± .005 .307± .010 .200="= .025 .266± .025 Calc'd from
published data (1(i)
.048
.302
.230
.247
The value of the standard deviation is based on about 10 measurements for each point, repeated with the four methods described. A xi square test showed a reliable stochastic spread of results.
6.2 Uranium carbide
About one hundred independent measurements have been performed so far on about ten different samples, using all four methods. Temperature was kept in the range 1100 to 1700°C. Results show that the thermal diffusivity of UC in this range is practically constant at a value
.049± .004 cm2 sec"1 (fig. 8).
The main source of error was the disuniformity of the sample thickness. In fact, the standard deviation in the measurements can well be attributed to this factor alone.
The calculation of thermal conductivity is given in Appendix III.
APPENDIX I
Transfer function of hollow cylinder
Assuming a hollow cylinder long enough to neglect radiation from the inner surface and thin enough to treat it in slab approximation, the usual Fourier equation
ST ocA*T = —
dt
(1)
is to be solved with boundary conditions
ÖT
ÔT
R in wt at ΛΓ = 0
ôx ST x=\
where R
Κ Κ
a. = thermal diffusivity
A = radiation coefficient = 4 σ ε Τ3
Q — power modulation amplitude / = sample thickness.
Using a solution 7"= imaginary part of u(x)eiwl = Im[u(x)eiwt] equation (1) becomes
and Μ = Λ eax + Be-ax
U" - i— u = 0 α
where a =
2 a (1 + 0 = ( i + 0
if T= Im{W)
then W = (A eax + Be~ax) eiwl (2)
Boundary conditions lead to
lm [a (A - B) eiwt] = R sin wt = Im [Reiwt]
or A(A-B) = R
and SIm[Aeal + Be'»1] eiwt = ST=lm [a(Aeal B e -a l) em l)
or a (Aeal Be~al) = S(Aeal + Be~al)
(3)
(4)
Combining (3) and (4)
R
0 (a + S)e~al
a (a 5) e»1
a -A
{a-S)eal ~(a + S)e-"l\
R 0
a — a
(a-S)e<" -{a + S)e~al
Substituting in (2) and taking the imaginary part we obtain an analytical expression for Τ ol' the type T— X cos wt + Y sin wt
The ratio — gives the phase lag which will be ò
tang^
cos a sin ha + sin a cos ha — S sin α cos ha sin α cos ha — cos a sin ha + S cos a cos ha
APPENDIX II
Transfer functions in a plane geometry
This case has been extensively treated elsewhere (u· 12- 13> 14< 1 5). We shall, however, report the results
which we used currently.
Pulse input
If a pulse of heat is applied on one face a slab of thickness / temperature history at the rear lace will be
7r2 tti τ=τ0 + Ατ l + 2 ^ ( - l ) » exp
β a.t
where To i the initial temperature and Δ Τ is the maximum temperature raise. For T= Το+Δ Vi π2α ί / /2= 1.38 then a. = 1.38 /2/jt2 t.
where / is the time elapsed until temperature has reached one half of its maximum value.
(1)
Sine input
Using a sine wave with frequency ƒ :
2 π to modulate input power and calling Δ Τ» and Δ 7Ί the
amplitudes of temperature fluctuations on the hind and front faces respectively, it can be shown that
Δ T0'
In
Δ Tx \/'fi/2 \/ w + constant
provided the frequency is high enough to enable higher armonics to fade out.
On the other hand, the phase relations are (12)
2fl3Qi + 2 ß2t f Q2/ ( l + r ) + 6 ß Q 3 / r
and
tang <5i
tang òs
2aBiQo + b([+2r)BQl/r + ab O2/O + r ) + 2 ß3ß3
b{tgB~tgbB) + 2aB tg Β tg h Β + 2 β2 (tg Β + tg bB)
¿>(tg Β + tg bB) + 2a Β 2 ß2( t g Β - tg h Β)
δι
y.
vhere òo = phase shift between beam modulation and output face temperature phase shift between beam modulation and input face temperature thermal diffusivity
κ ÕT) 1 ÕQ^
~κ Ur ι
b = μ
ι ÕQ
H ÕT 1 ÕQ Έ ~ÕT
T - T o T=Ti.
T=To T=T.
(3)
(4)
Β = / y,H'/2a
Qo = cos Ifi Β cos2 Β + sin Λ2 B sin2 Β
Q\ — cos h Β sin bB + sin bB -r cos ß sin S Q2 = cos Λ2 ß sin2 ß + sin b2 Β cos2 ß Ö3 = cos /¡ß sin IÌB — cos ß sin ß
For frequencies high enough both δι and όο tend to increase linearly with B, i.e. with the square root of
frequency. However, while ôo is a monotonie function, δι is not, and therefore is less susceptible of yielding simple measurement techniques. In fact, δα — δι is the most useful datum, since with an uncertainty on the value of a as high as .05 ^ o ^ .5, the error on Β calculated from δα — δι is less than 5% and the error on diffusivity no more than 10%.
K) OJ
UoW
3oo .
2 β ο .
2οο .
l 6 o .
loo .
5ο·
2°-Ι (.<*>
1 ar
-ί-
Α
Ο
— ι ο Η 1 loo UC ELCCTRlCAI. RESISTIVITYeoo i o o 4oo
O
-+-Λ
I B
σ
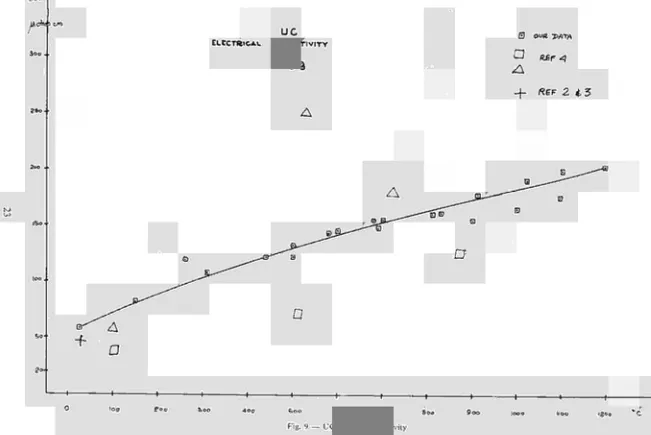
[image:27.842.98.749.54.489.2]1 1 — βοο 6οο 7°ο 8οο Fig. 9 — UC electrical resistivity
— » —
9oo
EJ OUR -jffir/Ί
-f- «FF
2 4, 3
t o
o
I
X
α-APPENDIX III
Determination of other physical constants
In the course of the thermal diffusivity measurements, other physical properties were determined by direct measurements in the same assembly or in specially made assemblies.
Emissivity
The slope of the temperature vs. power input curve to the UC wafers yielded a value for thermal diffu sivity, namely .91 + .005 for . 6 5μ in good agreement with previously published data (17) with no measurable
variation between 1000 and 2000°K.
Thermal conductivity
This property can be obtained from
ΑΓ = α Ο ρ
with C = . 1 2 7 + .0476 Χ 10-3Γ—^— ( T i n °K) (18)
and ρ — 13.6
between 1000 and 2000°K we shall have a near-constant value of K= .12 Wcm-1 °C_ 1
which may be accounted for by electron transport alone (see section 2).
Electrical conductivity
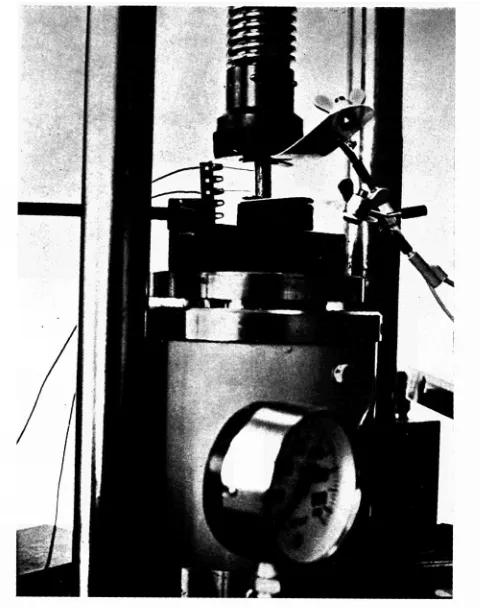
Two assemblies were used to determine this property. One operating at room temperature is of conven tional design and is shown in fig. 11. The other required an inert atmosphere for high temperature runs. A silica refractory tube with an Argon flow allowed measurements with good reproductibility (fig. 10).
These results are consistent with other published data (2>3).
Fig. 11 — Room temperature electrical resistivity measurement
REFERENCES
(!) A.C. SECREST Jr., et al. : "Preparation and Properties of Uranium Monocarbide Castings" BMI-1309 (Jan. 2, 1959).
(2) Progress Relating to Civilian Applications During June, 1959, BMI-1357.
(3) Progress Relating to Civilian Applications During May, 1959, BMI-1346.
(4) A. ACCARY, R. CAILLÂT : "Development of Ceramic Fuel Elements in France" from "Nuclear Fuel
Ele-ments - Rheinold Publishing Corp., N. Y. (1959).
(5) R . M . POWERS, et al.: The effect of solid solution additions on the thermal conductivity of UO2", SCNC
-317 (Nov., 1960).
(6) A. BOETTCHER and G. SCHNEIDER : "Some properties of Uranium Monocarbide", A/Conf. 15/P/964.
(7) O. KUBACHEWSKI and E.L. EVANS : "Metallurgical Thermochemistry", John Wiley and Sons, Inc., N. Y.
(1958).
(8) E. GENZEL, Z. Physik, 135, 177 (1953).
(9) M. GUTLER, et al. : "Thermal Conductivity of Reactor Materials", GA-1939 (Jan. 30, 1961).
(10) W . D . KINGERY : "The thermal Conductivity of Ceramic Dielectrics" from Progress in Ceramic Science, 2,
182 (1962).
(n) H.S. CARSLAW and J.C. JAEGER : "Conduction of heat in solids", 2nd edition Oxford at Clarendon Press,
(1959).
(12) R . D . COWAN : "Proposed method of measuring thermal diffusivity at high temperature", LA-2460, Nov.,
1960.
(13) E.L. WOISARD : "Pulsed method for the Measurement of Thermal Diffusivity of Metals", Journ. of Applied
Physics, 32, Jan., 1961.
(14) W.J. PARKER, et al. : "Flash method of determining Thermal Diffusivity, Heat Capacity and Thermal
Conductivity, / . of Appi. Physics, 32, 1679, Sept., 1961.
(15) J.B.J. FOURIER : "Extrait d'un Mémoire sur le refroidissement du globe terrestre", Bull. Sci. de la Société
Philomathique de Paris, (1820).
(10) R.P. TYPE, "Preliminary measurements on the thermal and electrical conductivities of Molybdenum, Niobium,
Tantalium and Tungsten", from "Niobium, Ta, Mo, W", edited by A.G. Quarrel-Elsevier, 1961.
(17) G.A. HAAS and J.T. JENSEN, Jr. : "Thermionic Properties of U C " , Journal of Appi. Physics, 31, 1231, July,
1960.
(18) A.B. TRIPLER, Jr., et al.: "Further Studies of Sintered Refractory Uranium Compounds", BMI-1313 (Jan., 27,
1959).
mm
tòíWfiliíajjili
i l Hl
lil
..'t*" '" '
o
ö
!ZJ
>
o
o
LO LO
•O
η
• ein IB ;íi ι