D’Souza, Dean and Booth, R. and Connolly, Monica and Happé, F. and
Karmiloff-Smith, Annette (2016) Rethinking the concepts of “local or global
processors”: evidence from Williams syndrome, Down syndrome, and Autism
Spectrum Disorders. Developmental Science 19 (3), pp. 452-468. ISSN
1363-755x.
Downloaded from:
Usage Guidelines:
Please refer to usage guidelines at or alternatively
Rethinking the concepts of “local or global processors”:
Evidence from Williams syndrome, Down syndrome, and Autism Spectrum Disorders
Dean D'Souza1, Rhonda Booth2, Monica Connolly1, Francesca Happé3 & Annette Karmiloff-Smith1*
1Birkbeck Centre for Brain and Cognitive Development, University of London, 32 Torrington
Square, London WC1N 7HX, U.K.
2Institute of Child Health, University College London, 30 Guilford Street, London WC1N
1EH, U.K.
3Social, Genetic and Developmental Psychiatry Research Centre, Institute of Psychiatry,
Individuals with neurodevelopmental disorders cannot simply be characterised as
having a local or global processing style
Cross-syndrome/cross-task/cross-modality comparisons reveal why
Abstract
Both Williams syndrome (WS) and Autism Spectrum Disorder (ASD) have been
characterised as preferentially processing local information, whereas in Down syndrome (DS) the reported tendency is to process stimuli globally. We designed a syndrome, cross-task comparison to reveal similarities and differences in local/global processing in these disorders. Our in-depth study compared local/global processing across modalities (auditory-verbal/visuo-spatial) and levels of processing (high/low) in the three syndromes. Despite claims in the literature, participants with ASD or WS failed to show a consistent local processing bias, while those with DS failed to show a reliable global processing bias. Depending on the nature of the stimuli and the task, both local and global processing biases were evident in all three neurodevelopmental disorders. These findings indicate that
individuals with neurodevelopmental disorders cannot simply be characterised as local or global processors.
[135 words]
Keywords: Autism Spectrum Disorder, Down syndrome, local/global processing, Weak Central Coherence, Williams syndrome
*To whom correspondence should be addressed: Prof. Annette Karmiloff-Smith, Birkbeck Centre for Brain & Cognitive Development, 32 Torrington Square, London WC1N 7HX, U.K. Tel: (+44)7903701136
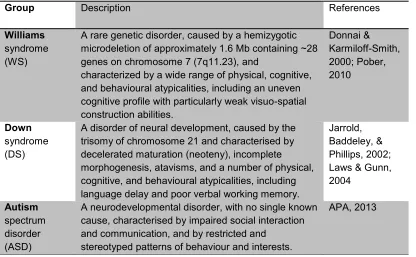
The world is perceived as hierarchically organized. For instance, visual scenes comprise global percepts (e.g., trees) that are composed of local details (leaves). The ability to process and integrate information at both global and local levels makes it possible to build up context, discover structure, make classifications, and form generalizations over a wide range of contexts. This ability develops early. For instance, Slater and colleagues (1991) demonstrated that even neonates have the capacity to make local information (line segments) cohere into unified wholes (angles, shapes). However, in three neurodevelopmental disorders, namely, Williams syndrome (WS), Down syndrome (DS), and Autism Spectrum Disorder (ASD), local processing (also sometimes referred to as a piecemeal or detailed-focused information processing style) and global processing (also sometimes referred to as a holistic processing style) are purported to be dissociated (see Table 1 for a description of these
neurodevelopmental disorders). In both WS and ASD, the processing of local detail is
reported to predominate over the processing of global properties (e.g., Bellugi, Lichtenberger, Jones, Lai, & St. George, 2000; Brosnan, Scott, Fox, & Pye, 2004; Farran, Jarrold, &
global figure composed of smaller local forms (e.g., a ‘D’ made up of small ‘Y’s). While chronological-age and mental-age matched controls copied the figures accurately, individuals with WS tended to produce only the local forms of the figures, and individuals with DS only the overall global shape.
– Table 1 here –
It has not hitherto been established as to how or why these biases emerge, although impairment of the dorsal visual pathway may account for some of them. In typical
development, local-global processing increases in proficiency and changes over time.
Converging paradigms indicate a developmental shift from an initial global processing bias in infancy to a local processing bias in early childhood (toddlers, preschoolers), with the global bias gradually returning from middle childhood onwards (in some domains as early as 6 years of age; Poirel et al., 20111). Interestingly, the shift from local to global processing in the visual domain has been associated with a reduction of grey matter along the visual dorsal stream – specifically, the calcarine sulcus, lingual gyrus, and parietal cortex of the right hemisphere (Poirel et al., 2008). This loss of grey matter might reflect selective specialization (through neural pruning) in visual processing of global information. It raises the possibility that a disorder of the dorsal stream might display problems with processing global
information, disrupting the typical global-to-local-to-global shift. Empirical studies of individuals with WS (known as “local processors”; see Pani, Mervis, & Robinson, 1999, for discussion) provide evidence that this might be the case. For example, a functional Magnetic Resonance Imaging (fMRI) study showed that on global processing tasks, individuals with WS were not only worse than TD controls in their behavioural responses, they also showed reduced activation of the dorsal stream pathway (Mobbs et al., 2007). Reduced grey matter in
intraparietal sulcus and adjacent parietal areas has also been identified in WS (Meyer-Lindenberg et al., 2004).
Dorsal stream deficits have also been reported in ASD (e.g., Atkinson, 2009; Bertone, Mottron, Jelenic, & Faubert, 2003; Braddick, Atkinson, & Wattam-Bell, 2003; Spencer et al., 2000). For instance, individuals with ASD find it more difficult than TD controls to
discriminate the direction of a field of coherently moving dots when a proportion of the dots are moving randomly (Milne et al., 2002; Spencer et al., 2000). However, because individuals with ASD use the same amount of contrast as TD controls to detect sinusoidal luminance manipulations of a Gaussian patch (“flicker detection”), it has been argued that ASD involves impairment in the processing of global motion information rather than a general dorsal deficit per se (Pellicano, Gibson, Maybery, Durkin, & Badcock, 2005; see also Koldewyn, Whitney, & Rivera, 2010). Thus, in the autism literature, three different (albeit underspecified) theories have been proposed to characterise and explain the bias: (1) the weak central coherence theory (WCC); (2) the enhanced perceptual functioning model (EPF); and (3) the hierarchisation deficit hypothesis (HDH).
According to WCC, the local bias in ASD results from a detail-focused processing style that characterises the disorder (Frith, 1989, 2003; Frith & Happé, 1994; Happé, 1999; Happé & Frith, 2006). This is consistent with evidence that individuals with autism show relatively enhanced performance on tasks that require participants to overcome global-to-local interference, e.g., on the embedded figures task (Jolliffe & Baron-Cohen, 1997; Shah & Frith, 1983), on visual search tasks (Happé, 1999), and in copying impossible figures (Mottron, Belleville, & Ménard, 1999). The theory is also consistent with evidence that individuals with ASD do not use context (e.g., meaning, semantic organization) to facilitate task performance to the same extent as typically-developing (TD) controls. For example, in contrast to TD children, in children with ASD recall of randomly arranged word lists is not much improved when the words are rearranged into meaningful groupings (Hermelin & O’Connor, 1970).
Ménard, 1999; Ozonoff, Strayer, McMahon, & Filloux, 1994; Plaisted, Swettenham, & Rees, 1999). Their local bias is thought to reflect enhanced functioning of early, low-level
perceptual processes (Mottron, Dawson, Soulieres, Hubert, & Burack, 2006) and stimulus complexity (i.e., local details are often less complex than global properties, although this would not of course explain the global bias in DS; Bertone, Mottron, Jelenic, & Faubert, 2005; Minshew & Goldstein, 1993, 1998; Minshew, Goldstein, & Siegel, 1995; Minshew, Sweeney, & Bauman, 1997). This is consistent with the finding that individuals with ASD show an atypically enhanced ability to detect minor modifications in their environment (Rimland, 1971).
The EPF model proposes that individuals with ASD do not necessarily have difficulty in perceiving global form, but they have an overdeveloped or “over-specialised” (low-level) perceptual system that can disrupt higher-level cognition and behaviour, depending on the requirements of the task (Mottron & Burack, 2001; Mottron et al., 2006). Indeed, evidence in support of this hypothesis2 has led to some modifications in the WCC model. The original theory (Frith, 1989) posited a deficit in global processing or in the drive to cohere
information. The modified theory (Frith, 2003; Happé & Frith, 2006) now claims that WCC arises as a result of a local processing bias that can be overcome in tasks with explicit demands for global processing. Thus, two of the three main theories explain the dissociation of local and global processing in ASD as the result of either an overdeveloped low-level processing system or a detail-focused processing bias.
The third major theory is the HDH (Mottron & Belleville, 1993), according to which both local and global processing function normally in individuals with ASD. The abnormality is purported to exist in the interaction between the two levels.3 Specifically, the authors
2 See Bouvet, Simard-Meilleur, Paignon, Mottron, and Donnadieu (2014), Kéïta, Guy, Berthiaume, Mottron, and Bertone, A. (2014), Muth, Hönekopp, and Falter (2014), Olu-Lafe, Liederman, and Tager-Flusberg (2014), and Yamasaki et al. (2014), for more recent evidence.
suggest that the local and global levels are not hierarchically distinguishable in individuals with ASD, who find it difficult to switch from one level of representation/abstraction to the other (Plaisted, Swettenham, & Rees, 1999). This is consistent with evidence that a fairly rigid trade-off between either local or global processing exists in children and adults with ASD, with individuals performing well on one level or the other but rarely both, whereas TD individuals switch back and forth easily between local and global processing (Happé & Booth, 2008).
Although these three theories have been applied to ASD, they can also be evaluated as explanations of reported hierarchical abnormalities or impaired local/global processing in WS and DS. A processing bias focused on detail (consistent with the WCC model) has also been used to explain the behaviour of individuals with WS (e.g., Bellugi, Marks, Bihrle, & Sabo, 1988; Bellugi et al., 1999; Bihrle et al., 1989).Indeed, individuals with WS neither show global precedence (Deruelle, Schon, Rondan, & Mancini, 2005) nor make use of context (Elsabbagh, Cohen, & Karmiloff-Smith, 2010) on, for instance, auditory perception tasks. Furthermore, although there is little evidence consistent with the EPF model in individuals with WS, there are data pointing to a hierarchical deficit in WS (Pani, Mervis, & Robinson, 1999), similar to the HDH account of ASD. Pani and colleagues (1999)
administered a visual search task to participants with WS and, after manipulating the stimuli in ways that more or less facilitated their grouping, they found that individuals with WS do not have a problem with processing information at any particular level of organization. Instead, their problem is thought to lie in switching between levels.
In contrast to individuals with WS or ASD, a processing bias focused on global properties of stimuli has been claimed in individuals with DS, which might be interpreted as relatively strong (i.e., normal) central coherence (CC) rather than WCC. For example, in producing hierarchical figures in the Navon task, individuals with DS tend to produce the correct global form, often ignoring or making errors on the local details (Bihrle et al., 1989;
Bellugi et al., 1999; Bellugi, Bihrle, Jeringan, Trauner, & Doherty, 1990; Bellugi et al., 2000). In sum, much of the literature seems to point to dissociation between local and global information processing in individuals with WS, DS, or ASD. Those with WS or ASD are characterised as having problems with processing global information, whereas those with DS experience more difficulty with processing local information. The literature suggests that these phenomena arise from the reduced ability to process global information in WS, a detail-focused or enhanced low-level perceptual bias in ASD, and the reduced ability to focus on local information in DS. An inability to flexibly switch between levels has also been hypothesised for both WS and ASD. To test this idea (i.e., that local/global processing is dissociated in these neurodevelopmental disorders), a battery of tasks that tap local/global processing across modalities (visuo-spatial, verbal-auditory) and levels of processing (from low to high: perceptual, attentional, semantic, strategic) was administered to individuals with WS or DS, and their data were compared with data collected from individuals with ASD and TD controls using identical measures (Booth & Happé, 2010; Happé & Booth, 2008; see Table 2 for tasks, organised by modality and level of processing). In our view, it is crucial to study all three neurodevelopmental disorders within a single approach, because tasks and stimuli are often susceptible to differences in methodology. Specifically, individuals with WS (so-called “local processors”) were compared to individuals with DS (so-called “global processors”) matched on Chronological Age (CA) and Mental Age (MA), while participants with ASD were compared to CA- and MA-matched TD controls. The groups were matched in this way because it is problematic to match across all four groups appropriately because those with ASD were high functioning. If participants with WS/ASD fail to show a local bias relative to participants with DS and TD controls on these tasks, then the characterisation of WS/ASD as local processors will need to be reconceptualised.
– Table 2 here –
Participants
Twenty-one individuals with WS and 31 individuals with DS gave informed consent to participate in the study. These participants had been clinically diagnosed and/or tested respectively for microdeletion of the ELN gene via fluorescence in situ hybridization (FISH) or forfull trisomy 21. Individuals with known health problems other than WS and DS (e.g., hearing and visual problems) were not contacted. One participant with DS turned out to be non-verbal and could not complete any of the tasks. One participant with WS was also excluded from the final analyses because although his facial dysmorphology suggested WS, his FISH test subsequently turned out to be negative.4 Data collected from the participants with WS and DS were compared with unpublished data (Happé & Booth, 2008) collected from 32 individuals with ASD and 31 controls. ASD diagnosis had been confirmed by a psychiatrist or paediatrician according to DSM-IV criteria (APA, 1994). To control for the effects of gender, individuals with ASD and their carefully matched controls were all male. This is because considerably more males than females are diagnosed with ASD (Jacquemont et al., 2014). Gender was sufficiently balanced in the DS (40% males) and WS groups (45% males); no association wasfound between Group (DS, WS) and Gender (male, female), χ2 (1) = 0.12, p = .7765. Five participants with high functioning autism had comorbidities, four of whom attention-deficit/hyperactivity disorder (ADHD) and one attention-deficit disorder (ADD). However, these five participants did not significantly differ from the other individuals with ASD in age or IQ, all t(23) < 1.30, p > .20, and their exclusion did not affect group results. They were therefore included in the analyses.
Participants’ verbal and visuo-spatial mental ages were obtained for purposes of comparison. All participants with WS and DS were administered the British Picture Vocabulary Scales (BPVS; Dunn et al., 1982) and the Block Design test (Wechsler, 1992), which were selected for their high reliability and validity estimates (Cyr & Brooker, 1984). Participants with ASD and TD participants were administered the WISC-III/WAIS-III
4 This participant had only 4 of the 28 genes deleted in the WS Critical Region (Karmiloff-Smith, Broadbent et al. 2012).
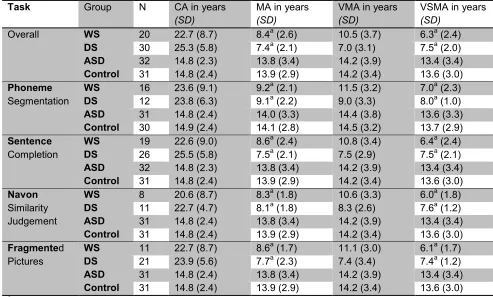
(Wechsler, 1992, 1997). From these measures, an overall Mental Age was obtained for each participant (age equivalent scores were calculated using raw scores). Table 3 shows the mean chronological ages (CA), mental age (MA), verbal mental ages (VMA), and visuo-spatial mental ages (VSMA) for each group, not including the two cases (one WS, one DS) referred to earlier who were removed from all analyses.
– Table 3 here –
CA and MA data were normally distributed in all groups (ZSkewness < 2;
Kolmogorov-Smirnov [K-S], p > .05). However, VMA and VSMA data failed tests of normality in the DS group (K-S, p < .05; ZSkewness > 2). Therefore, VMA and VSMA in the WS and DS groups
were logarithmically transformed (base 10) for analyses.
As expected from the literature, VMA was better in WS than in DS, t(48) = 3.61, p = .001, d = 1.04, while VSMA was worse in WS than in DS, t(39) = 2.06, p = .046, d = 0.66. This uneven cognitive profile is common in these clinical populations. Nevertheless,
independent t-tests failed to detect significant differences between the WS and DS groups on CA, t(48) = 1.29, p = .205, or MA, t(39) = 1.42, p = .164. Also, independent-samples Mann-Whitney U tests revealed that the females were not significantly different from the males on CA, MA, VMA, or VSMA, either in the WS group or in the DS group (all, p > .169).
The ASD and Control groups did not differ on CA, t(61) = 0.01, p = .993, MA, t(61) = 0.16, p = .909, VMA, t(61) = 0.02, p = .985, or VSMA, t(61) = 0.20, p = .839.
Design
Eight tasks were administered to participants in a set order, consisting of two blocks lasting about 30 minutes each. A short 5-minute break was taken between the two blocks in order to prevent fatigue. Four tasks were presented using SuperLab Pro 2.0 and an Apple MacBook Pro with a 17” screen.
demonstrated in the practice trials that they had understood what was required of them. Between test phases, positive comments were made in order to encourage participants. During test phases, however, feedback was not given on participant responses. The testing procedure was identical to the one employed by Happé and Booth (2008) for the individuals with ASD and the controls. Of the eight tasks used in the original (unpublished) study (see Happé & Booth, 2008), we selected four tasks (Table 2), one at each level of processing (high, low) in each of the two modalities (auditory/verbal, visuo-spatial), on the basis that they are arguably purer measures of local/global processing than the other tasks, with fewer or no demands on memory or general ability.
Task 1: Phoneme Segmentation
In this low-level (verbal modality) task, participants were instructed to detect the presence of a target phoneme (/p/) within a nonword. For each nonword, the target phoneme (e.g., /p/) was presented either as the initial sound (e.g., plo), or as the medial or final sound (e.g., lipod, vip), or not at all (e.g., dowen). Because individuals discriminate phonemes by segmenting syllables or words (Savin & Bever, 1970), the discrimination of a target phoneme in a nonword can be used as a measure of local processing in the auditory domain. It was predicted that participants with a local bias would be just as quick at identifying medial or final targets as targets in the initial position, because they would be less influenced by context.
Materials. Forty-five nonwords were used: 15 in each of the following conditions: (1) target phoneme (/p/) presented as initial sound; (2) target (/p/) presented as medial or final sound6; and (3) target absent. One-, two-, and three-syllable nonwords were present in each condition in equal numbers. While real words would have provided a stronger gestalt, nonwords were used to eliminate familiarity and to control for individual differences in word knowledge. The stimuli were pre-recorded by a British English speaker and played to
participants via high definition speakers in order to eliminate visual cues and to ensure that the presentation of sounds was consistent across participants.
Procedure. Participants were asked to listen for a /p/ sound that would occur in some of the words, and press the ‘Yes’ button whenever they heard that sound and ‘No’ when they did not. The stimuli were presented in a fixed random order. Participants had unlimited time to respond, and could have each test item repeated back to them (no more than once). Reaction time was measured from the offset of each non-word.
Task 2: Sentence Completion
In this higher-level (verbal) task, participants were required to complete sentence stems such as “Little boys grow up to be men and…”, “In the sea, there are fish and…”.
Completions might be global (e.g., dads / whales) or local (e.g., women / chips). Participants with a detail-focused processing bias were expected to provide more local completions than those without this bias.
Materials. Fifteen sentence stems (from Happé, Briskman, & Frith, 2001; Booth & Happé, 2010) were read to participants; ten produced a local-global conflict for their completion, five (‘filler’ sentence stems) did not. The filler sentence stems were added to mask the nature of the task and make it more naturalistic. These control items were interspersed with test items in a set order for all participants.
Procedure. Participants were read a sentence stem and asked to say something that would finish off the sentence. Response time was recorded from the offset of the sentence stem to the onset of the answer. The maximum time allowed for each completion was 20 seconds. Two measures were obtained: (i) number of local completions; (ii) mean response time.
Task 3: Navon Similarity Judgement
processed less quickly and less accurately in TD individuals than the global form itself (Navon, 2003). It is also harder to ignore the global form than the local elements (Navon 2003). These observations gave rise to the global-precedence hypothesis, which predicts “global advantage” and a “global-to-local interference effect” in TD individuals (Kimchi, 1992).
We avoided the drawing version of the Navon, so as to control for motor planning differences across groups. Rather, we used a two-alternative forced-choice (similarity-judgment) version of the classic Navon task, predicting that individuals with a general local bias (WS, ASD) would demonstrate a preference for the local elements over the global form. Individuals with a general global bias (DS, Controls) were predicted to show the opposite effect.
Materials. The stimuli were hierarchical figures, namely, global letters composed of local letters (Figure 1). Twelve stimuli types were employed: Ah (i.e., the letter “A”
composed of small “h” letters), An, Fh, Ft, Ha, Hf, Hn, Ht, Na, Nh, Tf, and Th. The letters – A, F, H, N, T – were selected on the basis of their similarity with each other in terms of their physical complexity and frequency in the English language (Solso & King, 1976). Each stimulus type was 45 x 55 mm in size and subtended at 6.3° when viewed from a distance of 50 cm away. Local elements were 4 x 5 mm in size and subtended at 0.6°. The test trials (N = 36) consisted of these 12 stimuli types, each presented at one of three different levels of density: 4-, 5-, or 6-local elements wide.
– Fig. 1 here –
Procedure. Participants were seated approximately 50 cm away from the 17” screen on which the stimuli were presented.The participant was then administered two practice trials and 36 test trials. In each trial, a red cross on a white background would appear at the centre of the top half of the screen for 1000 ms, and subsequently disappear for 150 ms. A
ms. The standard figure would then disappear and immediately be replaced by two
hierarchical figures (the comparison figures), positioned side by side at the bottom half of the screen (Figure 2). One of the comparison figures would have the same global form as the standard figure but different local elements, whereas the other would have the same local elements as the standard but a different global form. Participants had to point to the figure that most looked like the standard. The trial would end once the participant had responded or after 4 s had elapsed. If the participant did not respond within the given time, an error message and a loud sound were presented, and the trial was repeated once.
The test trials were presented in a fixed random order. The side of presentation was counterbalanced, with each comparison type (global match, local match) presented equally in the left and right positions. Across trials density was varied, but within each trial, the figures were of the same density.
– Fig. 2 here –
Task 4: Fragmented Pictures
The ability to conceptually integrate visual elements into a meaningful whole was investigated using a version of the Fragmented Picture-Completion Task (Snodgrass, Smith, Feenan, & Corwin, 1987), in which participants are presented with fragmented pictures which are gradually completed in sequential steps, and asked to name what each picture represents as soon as they think they know. Because success on this task requires global processing at a visual-semantic level, it is predicted that individuals with WS or ASD will find it more difficult to cohere the elements than those with DS.
working memory, long term memory, conflict resolution, switching, decision making, etc.). This is irrespective of whether the task is more or less demanding than the mainly perceptual Navon task.
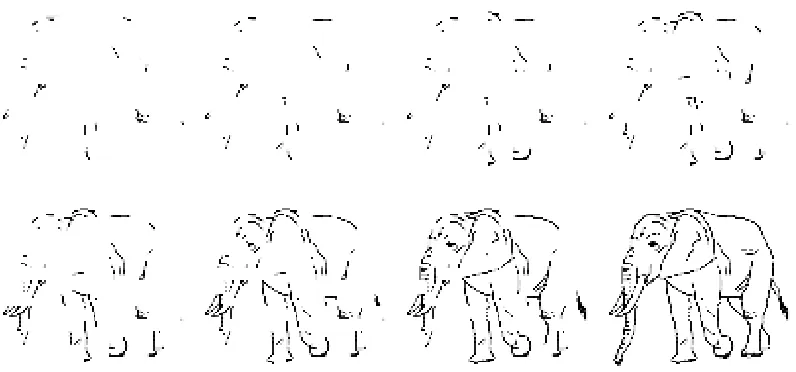
Materials. Ten sets of picture sequences (from Snodgrass and colleagues’ 1987 Fragmentation Picture-Completion Task) were used. Each picture sequence consisted of 8 different pictures of an image that varied in degree of fragmentation by random deletion of pixels – from the most fragmented to the complete image (Figure 3). These were presented (one after the other) at the centre of a 17” inch screen using SuperLab Pro software. The images were selected for their familiarity amongst children (Cycowicz, Friedman, Rothstein, & Snodgrass, 1997). Images that could be identified by an isolated detail (e.g., an eye) were deselected.
– Fig. 3 here –
Procedure. Each fragmented image was presented to the participant one after the other for 5 seconds at a time, from the most fragmented through to the completed picture (1-8), or until the participant guessed what the image was supposed to represent in the picture sequence. The participants were instructed to tell the instructor as soon as they thought they knew what the image was. If they were correct, the experimenter would end the trial (picture sequence) and begin the next one. If they were incorrect, the trial continued. Response times were recorded.
Results
data were non-normal (i.e., if ZSkewness > 2, or Kolmogorov-Smirnov p < .05), then they were
log transformed (base 10). If the transformed data were non-normal (e.g., bimodal), then the untransformed data were analysed using the appropriate non-parametric test (e.g., Mann-Whitney).
Task 1: Phoneme Segmentation
Seven participants with DS found it difficult to detect the phoneme and subsequently withdrew from the experiment. Of the remaining participants, the WS and DS groups did not differ on CA, t(25) = 0.20, p = .844, or on MA, t(21) = 0.18, p = .857; the ASD and Control groups also did not differ on CA, t(59) = 0.05, p = .959, or on MA, t(59) = 0.40, p = .690. Sensitivity and response bias were calculated by subjecting correct and incorrect detections of the target to signal detection analysis. Seven individuals (3 DS, 2 WS, 1 ASD, 1 Control) had A' values (the non-parametric index of sensitivity: Grier, 1971) calculated across conditions of between .22 and .60, too close to (or below) chance to be deemed reliable, and their data were removed from analysis. The remaining A' values (N = 89: 16 WS; 12 DS; 31 ASD; 30 controls) ranged from .62 to .96 (M = .84, SD = .07).
Accuracy. None of the groups demonstrated a response bias, nor did they differ on a non-parametric measure of bias, B” (ASD vs. Control, U = 491.00, z = 0.38, p = .7077; WS vs. DS, U = 95.00, z = -0.05, p = .9828). Table 4 presents the mean number of correct judgments for each of the three conditions (initial, medial/final, absent) and the signal detection parameter of sensitivity (A’) for each group.
- Table 4 here -
The initial and medial/final data were non-normal in the ASD and Control groups, and subsequently log transformed. A 2 (Group: ASD, Control) x 2 (Position: Initial, Medial/Final) ANOVA revealed a main effect of Position, F1,53 = 101.96, p < .000001, η2 =
.66. No main effect of Group, F1,53 = 2.17, p = .147, and no interaction effect, F1,53 = 0.46, p = .502, were found. In other words, both groups were significantly more likely to identify correctly the target phoneme in the initial than medial/final condition, but individuals with ASD and controls did not differ on the number of correct judgments made.
Initial and medial/final data were also non-normal in the WS group. The data were therefore log transformed. A 2 (Group: WS, DS) x 2 (Position: Initial, Medial/Final) ANOVA revealed a main effect of Position, F1,24 = 19.10, p = .0002, η2 = .44. No main effect of Group, F1,24 = 0.52, p = .479, and no interaction effect, F1,24 = 0.01, p = .913, were found. In other words, both groups (like the ASD and Control groups) were significantly more likely to correctly identify the target phoneme in the initial than medial/final condition, but individuals with WS and DS did not differ on the number of correct judgments made.
However, a significant difference on A’ was found between the ASD and Control groups, U = 583.50, z = 2.28, p = .023, r = .30, and between WS and DS groups, U = 33.00, z = -2.72, p = .006, r = -.52. This indicates that the ASD and DS groups were less able to discriminate between target absent and target present trials than the Control and WS groups, respectively.
Response time: ASD vs. Controls. A 2 x 2 mixed ANOVA with group (ASD,
control) as the between-subjects factor, and phoneme position (initial, medial/final) as the within-subject factorwas used to examine the effect of phoneme position on response times. Response times were capped at 10 seconds (less than 2% of all cases were longer than 10 s) and logarithmically transformed to reduce positive skew. Three outliers (> 3.29 SD) were removed. There were no significant differences between the individuals with ASD and controls on CA, t(57) = 0.04, p = .971, or MA, t(57) = 0.03, p = .978.
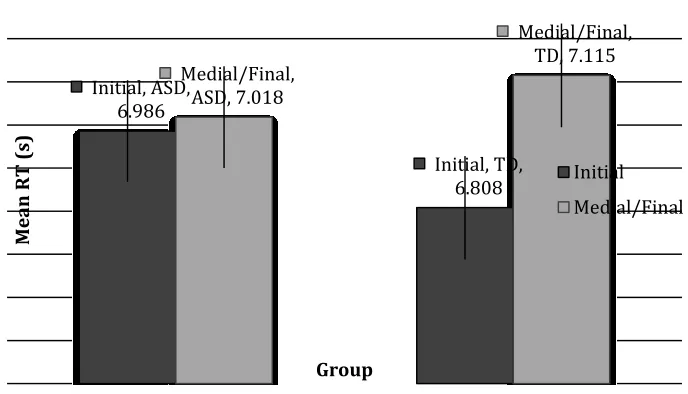
Paired samples t-tests were used to elucidate the interaction effect. The controls were significantly faster at detecting target phonemes when they were presented in the initial position than when in the medial or final positions, t(28) = 5.20, p = .00002, d = 1.97.
However, the position of the phoneme did not differentiate the timing of detection in the ASD group, t(29) = 0.35, p = .733 (Figure 4).
– Fig. 4 here –
Response time: WS vs. DS. A 2 x 2 mixed ANOVA with group (WS, DS) as the
between-subjects factor, and phoneme position (initial, medial/final) as the within-subject factor, was used to examine the effect of phoneme position on response times. Response times were capped at 10 seconds (less than 2% of all cases were longer than 10 s) and logarithmically transformed to reduce positive skew. Three outliers (> 3.29 SD) were removed. The two groups did not significantly differ from each other on verbal MA, t(25) = 1.73, p = .095.
There was a main effect of Group, F1,25 = 4.86, p = .037, η2 = .16. There was a main effect of position, F1,25 = 6.71, p = .016, η2 = .21, and an interaction effect between group and phoneme position, F1,25 = 4.89, p = .036, η2 = .16.
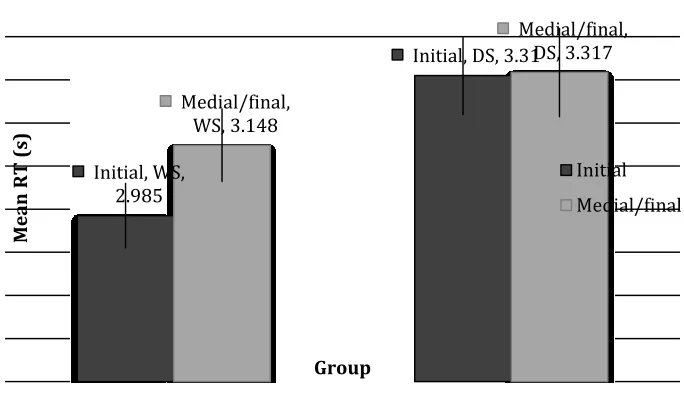
Paired samples t-tests were used to elucidate the interaction effect. Individuals with WS were significantly faster at detecting target phonemes when they were presented in the initial position than when in the medial or final positions, t(15) = 3.96, p = .001, r = .71. Notice that the effect in the WS group (r = .71) is similar in size to the one in the Control group (r = .70). However, the position of the phoneme did not differentiate the timing of detection in the DS group, t(10) = 0.23, p = .823 (Figure 5).
– Fig. 5 here –
time, which suggests that they did not have a hierarchical deficit. In addition, context (viz. phoneme position) had no effect on reaction times in the ASD group (1.32 s vs. 1.36 s), whereas it clearly did with WS and controls.Context also had no significant effect on reaction times in the DS group (2.59 s vs. 2.86 s). This may have been because they did not answer immediately as instructed. Indeed, they took twice as long to provide an answer and their reaction times were 2-3 times more variable. This may have attenuated the trend to respond more quickly to the target in the medial/final position than in the initial position. It is also important to note that data from only 12 participants with DS were analysed; seven found the task too difficult to complete.
Task 2: Sentence Completion
Individuals (2 WS; 2 DS; 2 ASD; 4 Controls) whose local completion score or mean response time (RT) was two standard deviations above or below the group mean were identified as outliers and removed from the analyses.The WS and DS groups did not significantly differ on CA, t(29.15) = 1.12, p = .271 (equal variances not assumed)9, or on MA, t(37) = 1.55, p = .130 (MA data were marginally non-normal in the DS group and thus MA data in both groups were log transformed). The ASD and Control groups did not significantly differ on CA, t(61) = 0.01, p = .993, or on MA, t(61) = 0.06, p = .950.
The local completions data failed tests of normality in the ASD and Control groups, but not in the WS or DS groups. Therefore, the local completion data were log transformed for the ASD vs. Control comparison. All groups produced more global completions than local completions (p < .001) (Table 5).
– Table 5 about here –
Individuals with ASD made significantly more local completions than controls, t(50.11)10 = 3.15, p = .003, d = 0.89, respectively. Individuals with ASD took longer to complete the sentence stems than controls, but this did not reach significance, t(55) = 1.73, p = .089.
Individuals with WS did not significantly differ from those with DS on local completions or mean RT, t(39) = 0.14, p = .893, t(39) = 1.20, p = .238.
Task 3: Navon Similarity Judgement
Some of the participants (10 WS, 10 DS) found the task too difficult to complete. Four outliers (+/- 2 SD) were also removed (1 WS, 1 DS, 2 Controls). The individuals with WS (N = 7) did not significantly differ from those with DS (N = 10) on CA, t(17) = 0.63, p = .537, or MA, t(13) = 0.24, p = .817. Also, those with ASD (N = 31) did not significantly differ from the Controls (N = 29) on CA, t(60) < 0.01, p = .998, or MA, t(60) = 0.12, p = .906.
The proportional response data were skewed (z = 1.86, -1.02; D(31) = 0.22, p = .001) in the ASD group, but not in the Control group (z < 1.96, 1.96; K-S, p = .066). The data were therefore arcsine transformed. Individuals with ASD made significantly more local matches than controls, t(36.98)11 = 2.89, p = .006, d = 0.95. WS did not significantly differ from DS, t(15) = 1.22, p = .242.
All groups, except the DS group, made more global than local matches. In the DS group, individuals made more local matches (M = 18.20, SD = 4.76) than global matches (M = 17.80, SD = 4.76). One-sampled t-tests showed that the proportion did not significantly differ from 0.5 in DS group, t(9) = 0.13, p = .897, but it did in the WS group, t(6) = 2.79, p = .032. In other words, the DS group made as many local matches as they did global matches (Figure 6) but, more importantly, individuals with DS made fewer global relative to local matches than those with WS.
10 The data failed Levene’s test for equality of variance (F = 4.88, p = .031). Therefore equal variances were not assumed.
– Fig. 6 here –
Task 4: Fragmented Pictures
Seven participants with WS found the task too difficult to complete and withdrew from the experiment. The remaining WS and the DS groups did not differ on CA, t(29) = 0.29, p = .778, or MA, t(22) = 1.09, p = .288. The ASD and Control groups also did not differ on CA, t(60) < 0.01, p = .998, or MA, t(60) = 0.12, p = .906.
Total number of incorrect guesses. Six individuals (1 WS, 1 DS, 2 ASD, 2 TD) were identified as outliers (each made 5-18 incorrect guesses per item, which were two standard deviations above the group mean) and removed from the following analysis. The data were positively skewed in all four groups, and therefore log transformed. However, numbers of incorrect guesses did not significantly differ between the ASD and Control groups, t(41) = 1.35, p = .184, or between the WS and DS groups, t(13.58) = 0.43, p = .671 (Table 6).
– Table 6 here –
Mean frame number for correct identification. One control was identified as an outlier (2.15 SD above the group mean) and removed from the following analysis. Contrary to expectations, the mean frame number for correct identification in the ASD group was not significantly different from the mean frame number in the control group, t(59) = 1.61, p = .113. However, it was significantly lower in the WS group than in the DS group, t(30) = 3.54, p = .001, d = 1.29.
correct identification, t(59) = 1.59, p = .117.12 Nor did individuals with WS take longer to identify a picture than DS, t(30) = 0.26, p = .795.
Total number of items identified at the 6th, 7th, or 8th frame. Participants were also
compared on the number of pictures that were recognized only near their most complete form (i.e., either at the 6th, 7th, or 8th frame). One control was identified as an outlier (2.15 SD above the group mean) and removed from the following analysis. The number of pictures correctly identified at the 6th, 7th, or 8th frame was significantly higher in the ASD group than in the control group, t(59) = 2.49, p = .015, d = .65. It is important to note that no control failed to identify a picture in its complete form (i.e., at the 8th frame).
The data in the WS and DS groups were negatively skewed. They were therefore reverse log transformed. The number of pictures correctly identified at the 6th, 7th, or 8th frame (i.e., late) was also significantly higher in the DS group than in the WS group, t(29) = 4.01, p = .0004, d = 1.49.
Discussion
The purpose of this study was to elucidate local/global processing by ascertaining whether more in-depth research across modalities and levels of processing could reveal differences or commonalities in integrative processing across the three neurodevelopmental disorders (WS, DS, ASD).
First and foremost, our study illustrates the importance of cross-syndrome
comparisons, because had each neurodevelopmental group merely been compared with TD controls, we might have concluded that they could be characterized as showing either a local or global bias, as the literature has consistently maintained. However, a comparison between the disorders yields a far more complex picture (Table 7).
– Table 7 here –
First, despite purported similarities in local/global processing in ASD and WS, neither (but especially not the WS group) demonstrated a general local bias. In a similar vein, a preference for global over local processing did not always materialise in the DS population; in some tasks, the opposite was true. For example, in the Phoneme Segmentation task, context (phoneme position) had no effect on DS/ASD whereas, like TD controls, it did on WS. This demonstrates that the local bias was not predominant in WS as far as an auditory task is concerned. By contrast, in the Fragmented Pictures task, individuals with ASD performed similarly to controls, while those with DS found it significantly more difficult than individuals with WS to integrate the fragmented visual elements into meaningful wholes. Furthermore, in the Sentence Completion task, those with DS displayed an equally high number of local completions as those with WS. This could have been because, despite the fact that the sentences were deliberately short, individuals with DS have poor verbal working memory so found it easier to maintain the local context in working memory than the global context. Yet in the Navon Similarity-Judgment task, participants with ASD showed a reduced preference for global-level information than controls as expected, but those with DS
demonstrated neither a global nor a local bias.
According to theory, a neat dissociation should have emerged, with individuals with WS/ASD showing a local bias on all four tasks, and individuals with DS displaying a global bias. But despite claims in the literature, neither WS nor ASD were consistently “local processors” in their responses. No clear links could be identified between the participants’ task performances and the cognitive atypicalities purported to underpin them. Nonetheless, individuals with ASD showed a local bias in both of the low-level tasks (Phoneme
Segmentation, Navon), which hints that low-level attentional/perceptual tasks are more likely to capture local processing in ASD than higher-level tasks.
On the EFP account, individuals with ASD are expected to outperform the TD controls on low-level tasks. But in the Phoneme Segmentation task, the ASD group was less able to discriminate between target absent and target present trials than the controls.
WS and ASD) should find tasks that require flexibility in shifting from one level to the next (e.g., the Phoneme Segmentation and Fragmented Pictures tasks) to be relatively difficult. Yet individuals with ASD showed no difficulty in detecting target phonemes in the Phoneme Segmentation task, and the WS group outperformed the DS group in the Fragmented Pictures task.
It should be noted that a large proportion of individuals with WS or DS withdrew from the Navon Familiarity-Judgment task. Although all the tasks were designed to be as easy to complete as possible, some participants clearly found that the stimuli in the Navon task were presented too quickly for them to decide which figure they thought was most like the target (the task was designed to be quick in order to capture participants’ “instinctive” preferences rather than higher-level explicit decision making). Thus it is possible that only (relatively) high functioning individuals completed this task, and that the results may have differed had low functioning individuals also been able to complete it.
Furthermore, a large proportion of individuals with DS could not complete the Phoneme Segmentation task (even though the nonwords were well articulated). This finding may reflect the difficulties that individuals with DS are reported to have in the auditory domain (e.g., Pueschel, Gallagher, Zartler, & Pezzullo, 1987). Nevertheless, the remaining participants were not at floor. They were more likely than not to correctly identify the target phoneme, though phoneme position (context) had no significant effect.
In sum, both differences and commonalities emerged across the three
will be affected more by the nature and difficulty of the task than by any general local/global processing bias.
Interestingly, although individuals with ASD have difficulty switching from local to global processing, as do those with WS, those with ASD do not have difficulty switching from global to local (White, O’Reilly, & Frith, 2009). Indeed, different computational processes are likely to underpin the local/global asymmetry found in these
neurodevelopmental disorders. The local and global structures of a stimulus are defined by many factors and by the context in which the stimulus is situated. Moreover, differences in the ability to process the spatial frequency of stimuli may actually account for perceptual differences across neurodevelopmental disorders. Indeed, there is evidence to suggest that individuals with DS have problems with processing high frequency spatial visual information, whereas those with WS have difficulty with processing low frequency spatial visual
information (e.g., Leonard, Annaz, Karmiloff-Smith, & Johnson, 2011). One advantage that a Spatial Frequency hypothesis has over theories discussed earlier is that it focuses on the stimulus, i.e., the source of information in the task, rather than difficult-to-define
characteristics such as local/global processing. Another advantage of the Spatial Frequency hypothesis is that it is based on how the visual system actually functions. There is also a small but growing body of evidence that the hypothesis invoking variations in Spatial Frequency may also apply to other perceptual systems (e.g., auditory/speech perception; Ivry & Lebby, 1993), as well as higher-level processes (e.g., categorical and coordinate spatial relationships in memory; Kosslyn, 1987; Kosslyn et al., 1989). This could explain why individuals with DS performed so poorly (relative to those with WS) in the Fragmented Pictures task. It may also be useful for understanding another domain—face processing—that has been a topic of debate about local versus global processing, particularly regarding Williams syndrome (Deruelle, Mancini, Livet, Casse-Perrot, & De Schonen, 1999; Deruelle, Rondan, Mancini, & Livet, 2003; Karmiloff-Smith et al., 2004; Tager-Flusberg, Plesa-Skwerer, Faja, & Joseph, 2003).
claimed by many (but not all, Tager-Flusberg et al., 2003) to reflect a local processing bias in WS and ASD, and a global processing bias in DS. However, our data do not support this hypothesis. Indeed, both a local and a global processing bias is apparent for some tasks and some stimuli in individuals across all three neurodevelopmental disorders, i.e., WS, DS, and ASD. Thus, individuals with these neurodevelopmental disorders cannot simply be
characterised as having a local or global processing style. Rather, they can all process both local and global information, depending on the task, but they do so in different and atypical ways. We thus conclude that the use of “local” or “global” processors for explaining neurodevelopmental disorders need to be reconceptualised and that a cross-syndrome/cross-task design is useful in identifying more subtle similarities and differences across such disorders than merely a comparison with TD controls.
References
American Psychiatric Association. (1994). Diagnostic and statistical manual of mental disorders (4th ed.). Washington, DC: Author.
American Psychiatric Association. (2013). Diagnostic and statistical manual of mental disorders (4th ed.). Washington, DC: Author.
Aslin, R. N., & Smith, L. B. (1988). Perceptual development. Annual Review of
Psychology, 39(1), 435-473.
Atkinson, A. P. (2009). Impaired recognition of emotions from body movements is associated with elevated motion coherence thresholds in autism spectrum
disorders. Neuropsychologia, 47, 3023–3029.
Bellugi, U., Bihrle, A., Jeringan, T., Trauner, D., & Doherty, S. (1990). Neuropsychological, neurological, and neuroanatomical profile of Williams syndrome. American Journal of Medical Genetics, 6(Suppl.), 115-125.
Bellugi, U., Lichtenberger, L., Jones, W., Lai, Z., & St. George, M. (2000). The
neurocognitive profile of Williams syndrome: a complex pattern of strengths and weaknesses. Journal of Cognitive Neuroscience, 12(Suppl1), 7-29.
Bellugi, U., Lichtenberger, L., Mills, D., Galaburda, A., & Korenberg, J. (1999). Bridging cognition, brain, and molecular genetics: Evidence from Williams syndrome. Trends in Neurosciences, 22, 197-207.
Bellugi, U., Marks, S., Bihrle, A., & Sabo, H. (1988). Dissociation between language and cognitive functions in Williams syndrome. In D. Bishop & K. Mogford (Eds.), Language Development in Exceptional Circumstances (pp. 177-189). Hove: Psychology Press.
Bellugi, U. L., Sabo, H., & Vaid, J. (1988). Spatial deficits in children with Williams syndrome. In J. Stile, M. Davis, &, U. Bellugi (Eds.), Spatial cognition: Brain bases and development. Hillsdale (pp. 273-297). NJ: Lawrence Erlbaum Associates, Inc. Bertone, A., Mottron, L., Jelenic, P., & Faubert, J. (2003). Motion perception in autism: A
Bertone, A., Mottron, L., Jelenic, P., & Faubert, J. (2005). Enhanced and diminished visuo-spatial information processing in Autism depends on stimulus complexity. Brain, 128, 2430-2441.
Bihrle, A. M., Bellugi, U., Delis, D.C., & Marks, S. (1989). Seeing either the forest or the trees: Dissociation in visuospatial processing. Brain and Cognition, 11(1), 37-49. Booth, R., & Happé, F. (2010). “Hunting with a knife and … fork”: Examining central
coherence in autism, attention deficit/hyperactivity disorder, and typical development with a linguistic task. Journal of Experimental Child Psychology, 107, 377-393. Bouvet, L., Simard-Meilleur, A. A., Paignon, A., Mottron, L., & Donnadieu, S. (2014).
Auditory local bias and reduced global interference in autism. Cognition, 131(3),
367-372.
Braddick, O., Atkinson, J., & Wattam-Bell, J. (2003). Normal and anomalous development of
visual motion processing: motion coherence and ‘dorsal-stream
vulnerability’. Neuropsychologia, 41(13), 1769-1784.
Brosnan, M. J., Scott, F. J., Fox, S., & Pye, J. (2004). Gestalt processing in autism: Failure to process relationships and implications for contextual understanding. Journal of Child Psychology and Psychiatry, 45(3),459–469.
Brown, J. H., Johnson, M. H., Paterson, S. J., Gilmore, R., Longhi, E., & Karmiloff-Smith, A.
(2003). Spatial representation and attention in toddlers with Williams syndrome and
Down syndrome. Neuropsychologia, 41(8), 1037-1046.
Cycowicz, Y. M., Friedman, D., Rothstein, M., & Snodgrass, J. G. (1997). Picture naming by young children: Norms for name agreement, familiarity, and visual complexity. Journal of Experimental Child Psychology, 65(2), 171-237.
Cyr, J., & Brooker, B. H. (1984). Use of appropriate formulas for selecting WAIS-R short forms. Journal of Consulting and Clinical Psychology, 52(5), 903-905.
Deruelle, C., Mancini, J., Livet, M. O., Casse-Perrot, C., & De Schonen, S. (1999).
Configural and local processing of faces in children with Williams syndrome. Brain
Deruelle, C., Rondan, C., Mancini, J., & Livet, M. (2003). Exploring face processing in
Williams syndrome. Cognitie, Creier, Comportanent, 7, 157-171.
Deruelle, C., Schon, D., Rondan, C., & Mancini, J. (2005). Global and local music perception in children with Williams syndrome. NeuroReport, 25, 631-634.
Donnai, D., & Karmiloff-Smith, A. (2000). Williams syndrome: From genotype through to the cognitive phenotype. American Journal of Medical Genetics: Seminars in Medical Genetics, 97(2), 164-171.
Dukette, D., & Stiles, J. (1996). Children's analysis of hierarchical patterns: Evidence from a
similarity judgment task. Journal of Experimental Child Psychology, 63(1), 103-140.
Dukette, D., & Stiles, J. (2001). The effects of stimulus density on children's analysis of hierarchical patterns. Developmental Science, 4, 233-251.
Dunn, L. M., Dunn, L. M., & Whetton, C. (1982) British Picture Vocabulary Scale. Windsor: Nfer-Nelson.
Elsabbagh, M., Cohen, H., & Karmiloff-Smith, A. (2010). Discovering structure in auditory input: Evidence from Williams syndrome. American Journal of Intellectual and Developmental Disability, 115(2), 128-139.
Farran, E. K., Jarrold, C., & Gathercole, S. E. (2003). Divided attention, selective attention and drawing: Processing preferences in Williams syndrome are dependent on the task administered. Neuropsychologia, 41, 676-687.
Farroni, T., Valenza, E., Simion, F., & Umiltà, C. (2000). Configural processing at birth: Evidence for perceptual organisation. Perception, 29(3), 355-372.
Frick, J. E., Colombo, J., & Allen, J. R. (2000). Temporal sequence of global-local processing
in 3-month-old infants. Infancy, 1(3), 375-386.
Frith, U. (1989). Autism: Explaining the enigma. Oxford: Blackwell Publishing.
Frith, U. (2003). Autism: Explaining the enigma (2nd edn.). Oxford: Blackwell Publishing. Frith, U., & Happé, F. (1994). Autism: Beyond “theory of mind”. Cognition, 50(1-3),
Ghim, H. R., & Eimas, P. D. (1988). Global and local processing by 3-and 4-month-old
infants. Perception & Psychophysics, 43(2), 165-171.
Grier, J. (1971). Nonparametric indexes for sensitivity and bias: Computing formulas. Psychological Bulletin, 75(6), 424-429.
Hadad, B. S., & Kimchi, R. (2006). Developmental trends in utilizing perceptual closure for
grouping of shape: Effects of spatial proximity and collinearity.Perception &
Psychophysics, 68(8), 1264-1273.
Happé, F. (1999). Autism: Cognitive deficit or cognitive style? Trends in Cognitive Sciences, 3(6), 216-222.
Happé, F., & Booth, R. (2008). The power of the positive: Revisiting weak coherence in autism spectrum disorders. The Quarterly Journal of Experimental Psychology, 61, 50-63.
Happé, F., Briskman, J., & Frith, U. (2001). Exploring the cognitive phenotype of autism: Weak “central coherence” in parents and siblings of children with autism: I. Experimental test. Journal of Child Psychology and Psychiatry, 42, 299-307.
Happé, F. & Frith, U. (2006). The weak coherence account: Detailed-focussed cognitive style in autism spectrum disorders. Journal of Autism and Developmental Disorders, 36, 5- 25.
Heinze, H. J., Hinrichs, H., Scholz, M., Burchert, W., & Mangun, G. R. (1998). Neural
mechanisms of global and local processing: A combined PET and ERP study. Journal
of Cognitive Neuroscience, 10(4), 485-498.
Hermelin, B., & O’Connor, N. (1970). Psychological experiments with autistic children. Oxford, UK: Pergamon.
Ivry. R. B., & Lebby, P. C. (1993). Hemispheric differences in auditory perception are similar to those found in visual perception. Psychological Science, 4, 41-45.
protective model” in neurodevelopmental disorders. The American Journal of Human Genetics, 94(3), 415-425.
Jarrold, C. & Russell, J. (1997). Counting abilities in autism: Possible implications for central coherence theory. Journal of Autism and Developmental Disorders, 27, 25-37. Jarrold, C., Baddeley, A. D., & Phillips, C. E. (2002). Verbal short-term memory in Down
syndrome: A problem of memory, audition, or speech? Journal of Speech, Language, and Hearing Research, 45, 531-544.
Johnson, S. P., & Aslin, R. N. (1995). Perception of object unity in 2-month-old
infants. Developmental Psychology, 31(5), 739.
Jolliffe, T., & Baron-Cohen, S. (1997). Are people with autism and Asperger syndrome faster than normal on the Embedded Figures Test? Journal of Child Psychology and Psychiatry, 38(5), 527-534.
Karmiloff-Smith, A., Broadbent, H., Farran, E. K., Longhi, E., D’Souza, D., Metcalfe, K., Tassabehji, M., Wu, R., Senju, A., Happé, F., Turnpenny, P., & Sansbury, F. (2012). Social cognition in Williams syndrome: Genotype/phenotype insights from partial deletion patients. Frontiers in Psychology, 3(168), 1-8.
Karmiloff-Smith, A., D’Souza, D., Dekker, T. M., Van Herwegen, J., Xu, F., Rodic, M., &
Ansari, D. (2012). Genetic and environmental vulnerabilities in children with
neurodevelopmental disorders. Proceedings of the National Academy of
Sciences, 109(Supplement 2), 17261-17265.
Karmiloff-Smith, A., Thomas, M., Annaz, D., Humphreys, K., Ewing, S., Brace, N. et al. (2004). Exploring the Williams syndrome face processing debate: The importance of building developmental trajectories. Journal of Child Psychology and Psychiatry, 45, 1258-1274.
Kéïta, L., Guy, J., Berthiaume, C., Mottron, L., & Bertone, A. (2014). An early origin for
detailed perception in Autism Spectrum Disorder: biased sensitivity for high-spatial
Kellman, P. J., Spelke, E. S., & Short, K. R. (1986). Infant perception of object unity from
translatory motion in depth and vertical translation. Child Development, 72-86.
Kimchi, R. (1992). Primacy of wholistic processing and global/local paradigm: A critical review. Psychological Bulletin, 112(1), 24-38.
Kimchi, R., Hadad, B., Behrmann, M., & Palmer, S. (2005). Microgenesis and ontogenesis of perceptual organization. Psychological Science, 16, 282-290.
Koldewyn, K., Whitney, D., & Rivera, S. M. (2011). Neural correlates of coherent and
biological motion perception in autism. Developmental Science,14(5), 1075-1088.
Kosslyn, S. M. (1987). Seeing and imagining in the cerebral hemispheres: A computational approach. Psychological Review, 94, 148-175.
Kosslyn, S. M., Koenig, O., Barret, A., Cave, C. B., Tang, J., & Gabrieli, J. D. E. (1989). Evidence for two types of spatialrepresentations: Hemispheric specialization for categorical and coordinate relations. Journal of Experimental Psychology, Human Perception and Performance, 15, 723-735.
Kovács, I. (2000). Human development of perceptual organization. Vision Research, 40(10),
1301-1310.
Kovacs, I., Feher, A., & Benedek, G. (1999). Late maturation of visual spatial integration in
humans. Proceedings of the National Academy of Sciences, 96(21), 12204-12209.
Kozma, P., Kovács, I., & Benedek, G. (2001). Normal and abnormal development of visual
functions in children. Acta Biologica Szegediensis, 45(1-4), 23-42.
Laws, G., & Gunn, D. (2004). Phonological memory as a predictor of language
comprehension in Down syndrome: A five-year follow-up study. Journal of Child Psychology and Psychiatry, 45(2), 326-337.
Meyer-Lindenberg, A., Kohn, P., Mervis, C. B., Kippenhan, J. S., Olsen, R. K., Morris, C. A.,
& Berman, K. F. (2004). Neural basis of genetically determined visuospatial
construction deficit in Williams syndrome. Neuron, 43(5), 623-631.
Milne, E., Swettenham, J., Hansen, P., Campbell, R., Jeffries, H., & Plaisted, K. (2002). High
motion coherence thresholds in children with autism. Journal of Child Psychology
and Psychiatry, 43(2), 255-263.
Minshew, N. J., & Goldstein, G. (1993). Is autism an amnesic disorder? Evidence from the California Verbal Learning Test. Neuropsychology, 7, 209-216.
Minshew, N. J., & Goldstein, G. (1998). Autism as a disorder of complex information
processing. Mental Retardation and Developmental Disabilities Research Reviews, 4, 129-136.
Minshew, N. J., Goldstein, G., & Siegel, D. J. (1995). Speech and language in high functioning autistic individuals. Neuropsychology, 9, 255-261.
Minshew, N. J., Sweeney, J. A., & Bauman, M. L. (1997). Neurological aspects of autism. In: D. J. Cohen, & F. R. Volkmar (Eds.), Handbook of Autism and Pervasive
Developmental Disorders, 2nd Edn. (pp. 344-369). New York: John Wiley & Sons.
Mobbs, D., Eckert, M. A., Menon, V., Mills, D., Korenberg, J., Galaburda, A. M., ... & Reiss,
A. L. (2007). Reduced parietal and visual cortical activation during global processing
in Williams syndrome. Developmental Medicine & Child Neurology, 49(6), 433-438.
Mottron, L., & Belleville, S. (1993). A study of perceptual analysis in a high-level autistic subject with exceptional graphic abilities. Brain and Cognition, 23(2), 279-309. Mottron, L., Dawson, M., Soulieres, I., Hubert, B., & Burack, J. (2006). Enhanced perceptual
functioning in Autism: An update, and eight principles of autistic perception. Journal of Autism and Developmental Disorders, 36(1), 27-43.
Mottron, L., & Burack, J. A. (2001). Enhanced perceptual functioning in the development of autism. In J. A. Burack, T. Charman, N. Yirmiya, & P. R. Zelazo (Eds.). The
Mottron, L., Belleville, S., & Ménard, E. (1999). Local bias in autistic subjects as evidenced by graphic tasks: Perceptual hierarchisation or working memory deficit? Journal of Child Psychology and Psychiatry, 40(5), 743–755.
Muth, A., Hönekopp, J., & Falter, C. M. (2014). Visuo-Spatial Performance in Autism: A
Meta-analysis. Journal of Autism and Developmental Disorders, 1-19.
Navon, D. (1977). Forest before trees: The precedence of global features in visual perception. Cognitive Psychology, 9(3), 353-383.
Navon, D. (2003). What does a compound letter tell the psychologist’s mind? Acta Psychologica, 114(3), 273-309.
Olu-Lafe, O., Liederman, J., & Tager-Flusberg, H. (2014). Is the Ability to Integrate Parts
into Wholes Affected in Autism Spectrum Disorder?. Journal of Autism and
Developmental Disorders, 1-9.
Ozonoff, S., Strayer, D. L., McMahon, W. M., & Filloux, F. (1994). Executive function abilities in autism and Tourette syndrome: An information processing approach. Journal of Child Psychology and Psychiatry, 35(6), 1015-1032.
Pani, J. R., Mervis, C. B., & Robinson, B. F. (1999). Global spatial organization by individuals with Williams syndrome. Psychological Science, 10, 453-458. Pellicano, E., Gibson, L., Maybery, M., Durkin, K., & Badcock, D. R. (2005). Abnormal
global processing along the dorsal visual pathway in autism: a possible mechanism
for weak visuospatial coherence?. Neuropsychologia,43(7), 1044-1053.
Plaisted, K. C., Swettenham, J., & Rees, L. (1999). Children with autism show local precedence in a divided attention task and global precedence in a selective attention task. Journal of Child Psychology and Psychiatry, 40(5), 733-742.
Pober, B. R. (2010). Williams-Beuren syndrome. New England Journal of Medicine, 362, 239-252.
patterns according to the meaningfulness of the stimuli. Developmental Psychology, 44, 245-253.
Poirel, N., Simon, G., Cassotti, M., Leroux, G., Perchey, G., Lanoë, C., ... & Houdé, O.
(2011). The shift from local to global visual processing in 6-year-old children is
associated with grey matter loss. PloS one, 6(6), e20879.
Porter, M. A., & Coltheart, M. (2006). Global and local processing in Williams syndrome, Autism, and Down syndrome: Perception, attention, and construction. Developmental Neuropsychology, 30(3), 771-789.
Pueschel, S. M., Gallagher, P. L., Zartler, A. S., & Pezzullo, J. C. (1987). Cognitive and learning processes in children with Down syndrome. Research in Developmental Disabilities, 8(1), 21-37.
Quinn, P. C., & Bhatt, R. S. (2006). Are some gestalt principles deployed more readily than
others during early development? The case of lightness versus form
similarity. Journal of Experimental Psychology: Human Perception and
Performance, 32(5), 1221.
Quinn, P. C., Bhatt, R. S., Brush, D., Grimes, A., & Sharpnack, H. (2002). Development of
form similarity as a Gestalt grouping principle in infancy. Psychological
Science, 13(4), 320-328.
Quinn, P. C., Burke, S., & Rush, A. (1993). Part—whole perception in early infancy:
Evidence for perceptual grouping produced by lightness similarity. Infant Behavior
and Development, 16(1), 19-42.
Quinn, P. C., & Eimas, P. D. (1986). Pattern-line effects and units of visual processing in
infants. Infant Behavior and Development, 9(1), 57-70.
Rimland, B. (1971). The differentiation of childhood psychosis. Journal of Autism and Childhood Schizophrenia, 1, 161-174.
Robertson, L. C., & Lamb, M. R. (1991). Neuropsychological contributions to theories of
part/whole organization. Cognitive Psychology, 23(2), 299-330.
Learning and Verbal Behavior, 9(3), 295-302.
Shah, A., & Frith, U. (1983). An islet of ability in autistic children: A research note. Journal of Child Psychology and Psychiatry, 24(4), 613-620.
Slater, A., Mattock, A., Brown, E., & Bremner, J. G. (1991). Form perception at birth: Revisited. Journal of Experimental Child Psychology, 51(3), 395-406.
Snodgrass, J. G., Smith, B., Feenan, K., & Corwin, J. (1987). Fragmenting pictures on the Apple Macintosh computer for experimental and clinical application. Behavior Research Methods, Instruments and Computers, 19(2), 270-274.
Solso, R. L., & King, J. F. (1976). Frequency and versatility of letter in the English language. Behavior Research Methods and Instrumentation, 8(3), 283-286.
Spencer, J., O'Brien, J., Riggs, K., Braddick, O., Atkinson, J., & Wattam-Bell, J. (2000).
Motion processing in autism: evidence for a dorsal stream
deficiency.Neuroreport, 11(12), 2765-2767.
Starr, A., Libertus, M. E., & Brannon, E. M. (2013). Number sense in infancy predicts
mathematical abilities in childhood. Proceedings of the National Academy of
Sciences, 110(45), 18116-18120.
Tada, W. L., & Stiles-Davis, J. (1989). Children's analysis of spatial patterns: An assessment
of their “errors” in copying geometric forms. Cognitive Development, 4(2), 177-195.
Tager-Flusberg, H., Plesa-Skwerer, D., Faja, S., & Joseph, R.M. (2003). People with Williams syndrome process faces holistically. Cognition, 89, 11–24.
Wang, L., Mottron, L., Peng, D., Berthiaume, & Dawson, M. (2007). Local bias and local-to-global interference without local-to-global deficit: A robust finding in autism under various conditions of attention, exposure time, and visual angle. Cognitive Neuropsychology, 24(5), 550-574.
Wechsler, D. (1992). Wechsler Intelligence Scale for Children (3rd edn.) London: The Psychological Corporation.
White, S., O’Reilly, H., & Frith, U. (2009). Big heads, small details and autism. Neuropsychologia, 47, 1274-1281.
Yamasaki, T., Maekawa, T., Takahashi, H., Fujita, T., Kamio, Y., & Tobimatsu, S. (2014).
Electrophysiology of visual and auditory perception in autism spectrum disorders. In
Figure Captions
Fig. 1Examples of one stimuli type (Tf), presented at 3 different densities: (a), (b), and (c) Fig. 2The Navon task: presentation of stimuli
Fig. 3 Example stimuli from the Fragmented Picture Completion task
Fig. 4 Mean response time (in seconds) for correct detection of the phoneme at initial and medial/final positions for the ASD and Control groups. Error bars represent standard error of the mean.
Fig. 5 Mean response time (in seconds) for correct detection of the phoneme at initial and medial/final positions for the DS and WS groups. Error bars represent standard error of the mean.
Fig. 4 Mean response time (in seconds) for correct detection of the phoneme at initial and medial/final positions for the ASD and Control groups. Error bars represent standard errors.
Initial, ASD, 6.986
Initial, TD, 6.808 Medial/Final,
ASD, 7.018
Medial/Final, TD, 7.115
Me
an
RT
(s)
Group
[image:43.595.98.442.111.308.2]Fig. 5 Mean response time (in seconds) for correct detection of the phoneme at initial and medial/final positions for the DS and WS groups. Error bars represent standard errors.
Initial, WS, 2.985
Initial, DS, 3.31 Medial/final,
WS, 3.148
Medial/final, DS, 3.317
Me
an
RT
(s)
Group
[image:44.595.99.441.112.309.2]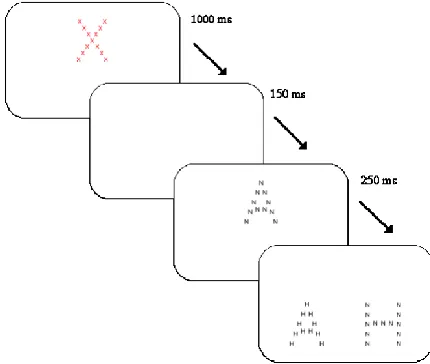
![Fig. 6 Proportion of local matches (local / [local + global]) for each group. Error bars represent standard errors](https://thumb-us.123doks.com/thumbv2/123dok_us/8863404.939188/45.595.100.440.121.317/proportion-local-matches-global-error-represent-standard-errors.webp)