Jasmin, Kyle and Dick, Frederic and Holt, Lori and Tierney, Adam (2019)
Tailored perception: individuals’ speech and music perception strategies fit
their perceptual abilities. Journal of Experimental Psychology: General ,
ISSN 0096-3445. (In Press)
Downloaded from:
Usage Guidelines:
Please refer to usage guidelines at or alternatively
Revision of XGE-2018-1458R1 as invited by the action editor, Julie Van
Dyke.
Tailored perception: individuals’ speech and music perception strategies fit their perceptual abilities
Kyle Jasmin1,2*, Fred Dick1,3, Lori Holt4, Adam Tierney1
1Department of Psychological Sciences, Birkbeck, University of London, London, UK
2Institute of Cognitive Neuroscience, UCL, London, UK
3Department of Experimental Psychology, UCL, London, UK
4Department of Psychology, Carnegie Mellon University, Pennsylvania, USA
*Corresponding author
Kyle Jasmin
Department of Psychological Sciences
Birkbeck, University of London
Malet Street, London, WC1E 7HX
Abstract
Perception involves integration of multiple dimensions that often serve overlapping, redundant
functions, e.g. pitch, duration, and amplitude in speech. Individuals tend to prioritize these
dimensions differently (stable, individualized perceptual ‘strategies’) but the reason for this
has remained unclear. Here we show that perceptual strategies relate to perceptual abilities. In
a speech cue weighting experiment (trial N = 990), we first demonstrate that individuals with
a severe deficit for pitch perception (congenital amusics; N=11) categorize linguistic stimuli
similarly to controls (N=11) when the main distinguishing cue is duration, which they perceive
normally. In contrast, in a prosodic task where pitch cues are the main distinguishing factor,
we show that amusics place less importance on pitch and instead rely more on duration cues—
even when pitch differences in the stimuli were large enough for amusics to discern. In a second
experiment testing musical and prosodic phrase interpretation (N=16 amusics; 15 controls), we
found that relying on duration allowed amusics to overcome their pitch deficits to perceive
speech and music successfully. We conclude that auditory signals, because of their redundant
nature, are robust to impairments for specific dimensions, and that optimal speech and music
perception strategies depend not only on invariant acoustic dimensions (the physical signal),
but on perceptual dimensions whose precision varies across individuals. Computational
models of speech perception (indeed, all types of perception involving redundant cues e.g.
vision and touch) should therefore aim to account for the precision of perceptual dimensions
and characterize individuals as well as groups.
Introduction
Perception as categorization
Perception often involves integrating cues from multiple sources and arriving at a categorical
interpretation. For instance, in visual speech (seeing a face while hearing speech), cues from
the face and voice are integrated to arrive at categorical percepts (McGurk & MacDonald,
1976). Cues are also integrated within a single sensory domain: when perceiving speech and
music, individuals classify what they hear, mapping continuous spectral and temporal variation
onto linguistic units, and tonal/rhythmic variation onto musical units. This process occurs at
and among multiple putative levels simultaneously, as smaller units such as phonemes,
syllables, and words are combined into larger structures such as phrases, clauses and sentences
(Bentrovato, Devescovi, D'Amico, Wicha, & Bates, 2003; Elman, 2009; Lerdahl & Jackendoff,
1985; McMurray, Aslin, Tanenhaus, Spivey, & Subik, 2008; Utman, Blumstein, & Burton,
2000). Similarly for vision, visual features from (e.g.) the eyes and mouth are integrated to
arrive at emotional categories (Du et al., 2014).
The cues that indicate a category can be subtle, and are often distorted or degraded by
noise in the environment. In the case of speech perception, which requires precise and rapid
detection of acoustic cues (Holt & Lotto, 2008), one might think that biologically-based
difficulties with auditory perception would also be a significant barrier. Individuals differ
widely on many dissociable auditory skills, such as the degree of temporal and spectral
resolution they can perceive (Kidd, Watson, & Gygi, 2007). However, it would seem that these
difficulties have little effect on the overall success of speech perception: decades of research
have consistently found that non-verbal auditory skills either do not correlate—or only weakly
correlate—with speech perception ability in normal-hearing adults, and factor analyses
consistently separate verbal and non-verbal sound perception into separate factors (Karlin,
1942; Kidd et al., 2007; Stankov & Horn, 1980; Surprenant & Watson, 2001; Watson & Kidd,
2002; Watson, Jensen, Foyle, Leek, & Goldgar, 1982).
Even an extreme deficit in a single aspect of perception can leave overall perception
unimpaired. Individuals with congenital amusia (a disorder of pitch perception discussed in
more detail below) do not report problems understanding spoken language (F. Liu, Patel,
Fourcin, & Stewart, 2010). How can an individual both be severely impaired in one aspect of
communicative systems, which have specific properties that make them robust to perturbation.
Two such properties are redundancy, the presence of multiple identical structures, such as
repetitions of the same note sequence in birdsong, and degeneracy (Price & Friston, 2002;
Hebets et al., 2016), which refers to the presence of multiple different features that perform the
same overlapping function, such as a smile conveyed by cues from both the shape of the mouth
and the eyes (Del Giudice & Colle, 2007).
In speech, multiple redundant cues within the acoustic signal often perform the same
linguistic function (see next section). It has been theorized that this property of speech could
make it robust to any isolated perceptual deficit (Patel, 2014), as well as environmental noise
(Winter, 2014), but to our knowledge this has not been demonstrated empirically. Indeed, this
principle may also apply to other forms of perception. In music, for example, individuals with
weak perceptual ability for one dimension may rely on some other dimension (or combination
of other dimensions) to understand musical structure. Itegration of redundant cues from
multiple senses, such as vision and touch (Helbig & Ernst, 2007) may also depend on the
reliability of those particular senses. For the purposes of this article we will refer to the
phenomenon by which multiple cues index the same category feature as ‘redundancy’ (although biological systems theorists would call this ‘degeneracy’), and N.B. there are
compensatory strategies besides redundancy/degeneracy that may assist with perceptual
impairments as well, such as those involving ‘top-down’ predictive processes (e.g. Ganong,
1980; Aydelott et al., 2012; Wicha et al., 2004).
Structural redundancy in speech and music
We have mentioned that speech is a highly redundant signal wherein a linguistic category may
be conveyed by many acoustic cues. Indeed, the distinction between voiced and unvoiced
consonants (for example ‘rapid’ versus ‘rabid’ ), for example, is conveyed by as many as 16
different cues (Lisker, 2016), the most prominent of these being voice onset time (VOT, i.e.,
the time lapsed prior to voicing onset) and fundamental frequency or pitch of the voice
(abbreviated as F0) (Haggard, Ambler, & Callow, 1970; Lisker, 1957; Massaro & Cohen,
1976). Redundancy is a widespread feature of speech that occurs across multiple time scales
and applies to many different linguistic features. These include syllable stress (‘PREsent’
versus ‘preSENT’), which is conveyed by increases in syllabic amplitude, duration, and F0
(Fear, Cutler, & Butterfield, 1995; Mattys, 2000), linguistic focus (‘it was HER’ versus ‘it
Fedorenko, Wagner, & Gibson, 2010; Chrabaszcz, Winn, Lin, & Idsardi, 2014), and phrase
structure (‘No dogs are here’ versus ‘No, dogs are here’) conveyed by F0 variation and
increased duration for the syllable just before the phrase boundary (de Pijper & Sanderman,
1994; Streeter, 1978). Music shows similar redundancies. For instance, the boundaries of
musicalphrases - the smallest group of related adjacent units in music - are characterized by
changes in pitch (a shift from low to high or high to low) and timing (a shift toward longer note
durations; Palmer & Krumhansl, 1987).
How do individuals integrate redundant information across different dimensions? Prior
research on speech perception focusing on the “average individual” or “average listener” (as
aggregated over the behavior of groups of participants) has indicated that the multiple
dimensions contributing to speech categorization are not perceptually equivalent (Breen et al.,
2010; Haggard et al., 1970; R. Liu & Holt, 2015; Massaro & Cohen, 1976; McMurray &
Jongman, 2011). That is to say, some acoustic dimensions more reliably and robustly signal
speech category membership, and therefore carry relatively more perceptual weight (“primary”
dimensions) whereas other dimensions are somewhat less diagnostic and carry relatively less
perceptual weight (“secondary” dimensions). For example, when making perceptual decisions
about voiced and unvoiced consonant-vowels in clear speech (‘rapid’ versus ‘rabid’), VOT of
the initial consonant is primary, while F0 of the following vowel is secondary (Haggard et al.,
1970; Massaro & Cohen, 1976; 1977). Conversely, for linguistic focus such as emphasis on a
particular word in a sentence, F0 is primary while word duration is secondary (Breen et al.,
2010).
However, a major issue with this approach is that seeking to characterize an ‘average
individual’ assumes that all listeners are able to use perceptual dimensions equally, which may
not be the case. What if individuals use different strategies that depend on the constraints they
are placed under? Indeed, perceptual strategies have been demonstrated to be malleable (for
review see Holt, Tierney, Guerra, Laffere, & Dick, 2018). For example, when speech is
presented in masking noise, VOT (a durational cue) is harder to detect, making F0 a more
reliable cue to which consonant was spoken. This leads to a corresponding shift in cue weights:
in noise, participants downweight VOT cues and upweight F0 cues (Holt et al., 2018; Winn,
Chatterjee, & Idsardi, 2013). Furthermore, dimensional weights also change when the
co-occurrence statistics of different dimensions are changed, as in a foreign accent. When VOT
& Holt, 2011; R. Liu & Holt, 2015), listeners down-weight reliance on the secondary (F0)
dimension because it is no longer informative (Idemaru & Holt, 2011; 2014). In addition,
experimentally increasing the variability of a given acoustic dimension (thereby making it less
reliable) also leads to down-weighting of that dimension (Holt & Lotto, 2006) and
categorization training with feedback also can lead to changes in dimensional weights (Francis,
Baldwin, & Nusbaum, 2000; Francis, Kaganovich, & Driscoll-Huber, 2008; S.-J. Lim & Holt,
2011). Overall, these results suggest that listeners continuously monitor and assess the evolving
relationships among acoustic dimensions and speech categories, and adjust perceptual weights
of acoustic dimensions accordingly (Holt et al., 2018; Holt & Lotto, 2006; Toscano &
McMurray, 2010; Massaro & Cohen, 1993; see Prince, 2014b for an example from the music
domain). Given that systematically changing specific aspects of the physical signal (i.e.
acoustics) to make them more or less reliable can affect cue weights, it follows that differences
in reliability resulting from an individual’s own uniquely-developed perceptual system might
result in different weighting strategies.
Individual differences in dimensional weighting in perceptual categorization
Large individual differences (Yu & Zellou, 2019) in perceptual weighting have been
reported across a variety of phonetic contrasts, including lexical tone in Mandarin
(Chandrasekaran, Sampath, & Wong, 2010), place of articulation (Hazan & Rosen, 1991), stop
consonant length (Idemaru, Holt, & Seltman, 2012), and vowels (Kim, Clayards, & Goad,
2018). However, these differences tend to be stable rather than random, having been found to
be similar across testing sessions (Idemaru et al., 2012; Kim et al., 2018; Kong & Edwards,
2016). These and many other studies have established that typically developed individuals use
different (but consistent!) strategies when perceiving speech—some place much more weight
upon certain sources of evidence than others—even when listeners share the same linguistic
background.
What is poorly understood is the underlying cause of these differences. Considered in
the context of the large individual differences in auditory perception reviewed above, an ideal
strategy for one individual may be sub-optimal for another due to differences in the reliability
of perception for different dimensions. We hypothesize that is an important factor driving these
individualized and stable perceptual strategies—variability in the relative precision of different
perceptual dimensions across individuals. Applying this hypothesis to an extreme case,
learn, over time, that this dimension is not useful for them, and perceptually weight it less in
categorization—even in cases when changes in that dimension are easily perceptible. They
instead may strategically down-weight cues that are (for them) unreliable, an alternative route
to effective perceptual categorization. Here we tested this hypothesis by investigating a
population with a severe domain-general perceptual deficit for pitch: participants with
congenital amusia.
Speech perception in amusia
Congenital amusia provides an ideal test case for examining the consequences of deficits in the
perception of a single dimension on perceptual weighting strategies. Amusia is a disorder
affecting around 1.5% of the population (Peretz & Vuvan, 2017), which is characterized by
problems detecting small changes in pitch (Hyde & Peretz, 2004; Vuvan, Nunes-Silva, &
Peretz, 2015) with otherwise normal cognitive and perceptual skills. This impaired pitch
perception (possibly caused by reduced conscious access to pitch information, i.e. ‘pitch agnosia’; Omigie & Stewart, 2011; Peretz, Brattico, Jarvenpaa, & Tervaniemi, 2009; Tillmann,
Lalitte, Albouy, Caclin, & Bigand, 2016) leads to deficits in musical abilities such as singing
and melody recognition (Ayotte, Peretz, & Hyde, 2002; Dalla Bella, Giguère, & Peretz, 2009)
as well as linguistic abilities such as statement/question judgments and perception of
tone-language speech in background noise, in controlled laboratory settings (Ayotte et al., 2002;
Hutchins, Gosselin, & Peretz, 2010; Jiang, Hamm, Lim, Kirk, & Yang, 2010; Nan, Sun, &
Peretz, 2010; Patel, Foxton, & Griffiths, 2005; Patel, Wong, Foxton, Lochy, & Peretz, 2008;
Peretz et al., 2002; Vuvan et al., 2015). Asking amusics about their experiences with language,
however, reveals a paradox: only 7% of amusics report problems with speech perception in
everyday life (F. Liu, Patel, Fourcin, & Stewart, 2010). How is it that amusics show problems
with speech perception in the laboratory but self-report being unaffected in ecologically valid
settings? One possibility is that amusics compensate for their poor pitch fidelity by relying on
other, redundant, acoustic cues in the speech signal. If so, this would mean that computational
models of speech—and indeed vision, touch, and music perception, etc.—should aim to predict
the behavior of individuals as well as groups. This can be carried out by including terms that
reflect the precision (or inversely, noise) relating to perceptual dimensions, in addition to the
Experiment 1
In Experiment 1, we used amusia as a test case to examine whether impairment along a single
perceptual dimension leads to a shift in how different sources of information are weighted in
perceptual categorization. Two groups of participants (individuals with amusia and controls)
categorized stimuli drawn from two-dimensional acoustic spaces that varied in the extent to
which fundamental frequency of the voice (referred to as F0, a strong indicator of vocal pitch),
as well as durational information, pointed toward one of two linguistic interpretations. In a
phonetic paradigm, stimuli differed in the identity of a word-initial consonant (“beer” vs “pier”)
whereas in a prosodic paradigm, stimuli differed in the location of linguistic focus (“STUDY
music” vs “study MUSIC”). Crucially, the “primary” acoustic dimension for the phonetic
experiment was durational in nature, but the primary dimension for the prosody paradigm was
F0 – the dimension that amusics hear with less fidelity. We hypothesized that if an individual's
perception of a primary dimension is unimpaired, they should have no need to shift reliance to
other, redundant perceptual dimensions because the primary dimension provides a robust signal
to category identity (Holt et al., 2018; Schertz, Cho, Lotto, & Warner, 2015a; Wu & Holt,
2018). However, if perception of a primary dimension is indeed impaired, listeners may
strategically down-weight it in favor of a secondary dimension for which perception is not
impaired.
Experiment 1 tested the hypothesis that the extent to which individuals rely on
particular acoustic dimensions in perceiving speech can be predicted by the relative
informativeness of the dimensions (i.e. which one is primary) and the presence or absence of a
perceptual deficit for that dimension. Participants assigned tokens of spoken language to
linguistic categories based on a phonetic contrast for which the primary cue was related to
duration (for which no participant had a perceptual deficit). We used two stimulus sets -- a
phonetic and a prosodic set -- which fully crossed F0 and duration parameters. Phonetic
perception was assessed using synthesized speech sounds differing in voicing (/b/ versus /p/),
which can be conveyed via differences in voice onset time (VOT; a duration-related cue) and
fundamental frequency of the following vowel (F0; a pitch-related cue). As described above,
for most listeners, VOT is the primary (dominant) dimension for in /b/-/p/ categorization, while
F0 is secondary (Haggard et al., 1970). We predict that performance on this task should
therefore not differ between groups; none of the participants were impaired in perceiving the
The same participants also completed a similar task that examined a prosodic contrast
for which the primary dimension was, instead, F0 (related to pitch, for which amusics have a
deficit) and duration was secondary. Here, categorization of prosodic focus was primarily
conveyed via pitch accents (carried by F0) and, to a lesser extent, durational lengthening (Breen
et al., 2010). That is, F0 (the dimension amusics are impaired at perceiving) was the primary
dimension, and the duration dimension was secondary. Thus, we predict that they will
perceptually weight F0 less than control participants even across F0 differences that are easily
perceptible for amusic participants, based on their pitch discrimination thresholds. This would
indicate that any group differences in perceptual cue weighting between amusics and controls
reflect differences in categorization strategy rather than simply an inability to detect the cues.
Both stimulus sets fully sampled an acoustic space created by sampling the orthogonal
duration and F0 dimensions with equal probability. Participants therefore heard some stimuli
that clearly belonged to one category or the other, and other stimuli that were perceptually
ambiguous. This allowed us to measure the perceptual weight of the F0 and duration
dimensions separately for the phonetic and prosodic paradigms of the experiment (Holt &
Lotto, 2006), for both the amusic and control groups. Critically, we confirmed with
psychophysical testing that F0 differences among our stimuli were large enough to be
perceptible even to amusic participants. This ensured amusics could potentially use F0
information in the task.
Methods
Participants
Sixteen amusics (10 F, age = 60.2 +- 9.4) and 15 controls (10 F, age = 61.3 +- 10.4) were
recruited from the UK and were native British English speakers with the exception of one
amusic whose native language was Finnish but acquired English at age 10. (This participant
was excluded from the Linguistic Phrase and Focus Test analyses of Experiment 2).
Audiometric thresholds were measured at left and right ears at octaves between 500 and 8000
for all control participants and all but one amusic participant; the two groups did not differ on
hearing thresholds (t(28) = 1.33, p = 0.2). Experiment 1’s sample consisted of 11 amusics (6
F, age = 59.3) and 11 controls (8 F, age = 60.4) because, as it was run online, fewer participants
had the equipment necessary to take part. All participants gave informed consent and ethical
Sciences, Birkbeck, University of London. Participants were compensated £10 per hour of
participation. Amusia status was obtained using the Montreal Battery for the Evaluation of
Amusia (MBEA), in which participants heard pairs of short melodic phrases and rhythms
across 5 subtests -- Contour, Scale, Interval, Rhythm, Meter, and Musical Memory -- and
judged whether each pair were identical or different. Participants with a composite score
(summing the Scale, Contour and Interval tests scores) of 65 or less were classified as amusic
(Peretz, Champod, & Hyde, 2003). Most of the amusic participants (15) were recruited and had
their amusia status confirmed previously by the Music, Mind and Brain group at Goldsmiths
University of London, and one was recruited online through circulation of an MBEA scale test
that was administered through a web browser. No participant in either group had more than 5
years of musical training (amusic mean years 0.75; control mean years 1.35).
Phonetic Cue Weighting
Each phonetic block consisted of repetitions of a single word, spoken by a female American
English speaker, that varied from “beer” (IPA: /bɪɹ/) to “pier” (IPA: /pɪɹ/) along two orthogonal
acoustic dimensions. Praat 5.0 (Boersma, 2002) was used to alter original recordings of the
words “beer” and “pier” such that the voice onset time (VOT) ranged from -5 ms to 15 ms in
5 ms increments. The F0 onset frequency of the vowel was manipulated manually in Praat
such that it varied from 200 to 320 in 30 Hz increments. The F0 remained at this frequency for
80 ms, after which it decreased linearly to 180 Hz over the following 150 ms. Consistent with
the distributional regularities of English, shorter VOT and lower initial F0 sounded more like
/b/ while longer VOT and higher initial F0 sounded like /p/ (Idemaru & Holt, 2011). A full
description of the stimulus creation methods can be found in Idemaru & Holt (2011). Each of
the 5 F0 levels was fully crossed with each of the 5 VOT (duration) levels to make 25 stimuli.
The stimulus set can be found in the online materials.
To ensure that the intervals along the F0 dimension were large enough for amusics to
detect, we measured the median F0 of the vowel following the initial stop consonant for each
of the five levels of F0. The vowel F0 for the five levels was 200, 230, 260, 290, and 320 Hz,
with a mean difference between adjacent F0 levels of 2 semitones. This exceeded the largest
pitch discrimination threshold across all participants, which was less than 1.5 semitones (see
Experiment 2).
Linguistic focus materials were constructed from combinations of two phrases, “Dave
likes to STUDY music” or “Dave likes to study MUSIC” (stress indicated in uppercase). These
phrases were spoken by an actor who read two compound sentences with an intervening
conjunction, e.g. “Dave likes to STUDY music, but he doesn’t like to PLAY music” and “Dave likes to study MUSIC, but he doesn’t like to study HISTORY”. The actor was asked to place
contrastive accents to emphasize the capitalized words. These recordings were then cropped,
leaving only the initial phrases listed above. Using STRAIGHT software (Kawahara & Irino,
2005), the two versions were manually time aligned. This was done by marking corresponding
anchor points in the two sound files. (N.B. time-alignment does not result in output morphs
being of the same durational length.)
We then produced a set of 49 different stimuli by varying the extent to which F0 and
durational information supported one versus the other focus interpretation. We then adjusted
the ‘morphing level’ for the temporal and F0 dimensions in order to synthesize intermediate
versions of this spoken sentence. The value of morphing level can be interpreted as the relative
contribution of one recording relative to another for a given auditory dimension. For instance,
if a recording was synthesized with an F0 morphing level of 0%, and a temporal morphing
level of 100%, that would mean that the F0 contour for the synthesized speech came entirely
from the “STUDY music” recording, while the temporal duration information came entirely from the “study MUSIC” recording. If both the F0 and temporal morphing levels were set to
50%, that would mean that the F0 and durational aspects of the synthesized recording would
reflect the midpoint, with F0 and duration information being halfway between both of the
‘endpoint’ recordings. For both phonetic and prosodic stimulus sets, loudness did not vary
across stimuli as only F0 and duration were manipulated.
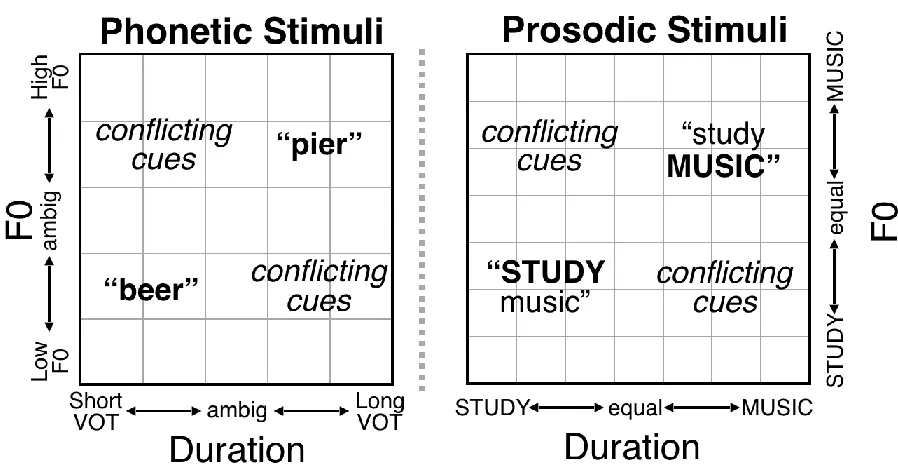
In the present experiment, the duration and F0 information disambiguating the 'focused'
word varied from 0% to 100% morphing levels for F0 and for duration, in 17% increments
(0%, 17%, 33%, 50%, 67%, 83%, 100%). Because the dimensions were fully crossed, some
combinations of F0 and duration cued an interpretation jointly, others conflicted, and tokens
near the center of the space were more perceptually ambiguous (Fig. 1). Examples of the stimuli
are provided in online materials.
To ensure that the intervals along the F0 dimension were large enough that amusics
would be capable of detecting them, we measured the median fundamental frequency (F0) of
each of the seven levels of F0 morphing, then calculated the difference in F0 in semitones
between the two words for each level. The differences in F0 between “study” and “music”,
measured at the first vowel, at each of the seven F0 levels (negative values reflecting higher
F0 on “music” than “study”) were -8.5, -5.0, -2.1 0.6, 3.4 5.7, and 8.1 semitones. The difference
in F0 between adjacent levels was always greater than 2 semitones. Since amusics are capable
of detecting changes of 2 semitones and greater just as well as control participants (Hyde &
Peretz, 2004; Mignault Goulet, Moreau, Robitaille, & Peretz, 2012; Moreau, Jolicœur, &
Peretz, 2013; Peretz, Brattico, & Tervaniemi, 2005), and given that all of our participants had
pitch discrimination thresholds of less than 1.5 semitones (see Experiment 2), we assume that
the amusic participants in this study were capable of detecting the difference between stimuli
varying along the F0 dimension. As a result, this paradigm is appropriate for investigating
whether amusics perceptually weight potentially informative F0 information in phonetic and
Figure 1: Schematic depiction of Phonetic and Prosodic stimulus spaces. In each stimulus
set, a different linguistic interpretation was cued, to varying degrees, by the F0 contour and the
duration of elements. Sometimes F0 and duration were indicative of the same interpretation,
(upper right and bottom left corners) and other times the cues conflicted (upper left and bottom
right). For the phonetic stimuli, 5 levels of an initial F0 excursion of the vowel (a pitch-related
cue) and 5 levels of voice onset time (a duration cue) were crossed to create a phonetic stimulus
space (Idemaru & Holt, 2011). For prosodic stimuli, 7 morphing levels of F0 and 7 of duration
between “STUDY music” and “study MUSIC” were varied independently to create the
Procedure
Pitch and Duration Thresholds
For all participants (Experiments 1 and 2, see below), pitch difference and duration difference
thresholds were obtained in the laboratory with Maximum Likelihood Procedure (MLP; Grassi
& Soranzo, 2009), an adaptive thresholding procedure based on the maximum likelihood
method. Participants completed 3 blocks of 30 trials for both the 'pitch' and 'duration' threshold
tests. On each trial participants heard 3 complex tones in a 3 alternative forced choice (3AFC)
design. All complex tones comprised a fundamental frequency plus 3 harmonics, with 10ms
onset and offset cosine gates. For the pitch test, participants heard 3 complex tones that were
270 ms in duration. Two of these had an F0 of 330 Hz and one had a slightly higher F0 (with
F0 difference adaptively determined via the MLP procedure). The order of presentation of the
higher-F0 tone was randomized (first, second or third position). Participants indicated the
temporal position of the higher tone by pressing keys 1, 2, or 3 on a keyboard.
For the duration test, participants heard 3 complex tones (F0 = 330 Hz). Two of these
were 270 ms in duration and one was slightly longer, with the longer tone appearing randomly
in any position and participants indicating its position by pressing, 1, 2 or 3 on the keyboard.
The threshold was calculated as the pitch or duration value that led to correct responses on
80.9% of trials on a block-by-block basis. For both the duration and pitch threshold tests, the
median threshold value across the 3 blocks was extracted for statistical analysis.
Speech-in-noise threshold
Participants’ ability to perceive speech in the presence of background noise was also assessed;
this skill is known to be impaired in tone-language speaking amusics (F. Liu, Jiang, Wang, Xu,
& Patel, 2015) but has not been examined in speakers of non-tonal languages, who may rely
more on duration cues when perceiving speech-in-noise (Lu & Cooke, 2009). Participants
completed a speech-in-noise test, adapted from Boebinger (2015). On each trial, a participant
was presented with a short sentence from the Bamford-Kowal-Bench (BKB) corpus (Bench,
Kowal, & Bamford, 1979) spoken by a female talker in the presence of competing background
voices (multi-talker babble). Maskers were presented at a constant level (0 dB) across trials
while the loudness of the target voice was varied. Participants verbally repeated what they
heard to the experimenter, so far as they were able. The experimenter had a predetermined list
words the participant had spoken on each trial (for a score of 0, 1, 2, or 3). The test adapted the
signal-to-noise level using a one up, one down staircase procedure. The target level was varied
first with an 8-dB step. The step reduced to 6-dB after the first reversal, 4-dB after the second
reversal, and 2-dB after the third reversal. The procedure ended after 6 reversals at the smallest
step size and the outcome measure was reported as the mean SNR level visited at the smallest
step size.
Cue-weighting
The experiment began with instructions to listen to each item and classify whether the initial
consonant was “B” or “P” (for the phonetic task) or whether the emphasis resembled “STUDY music” or “study MUSIC” (prosodic task). Participants heard one example of “beer”, “pier”, “study MUSIC” and “STUDY music” during the instruction portion of the experiment.
Responses were made by clicking a mouse to indicate one of two buttons positioned near the
center of the screen (“B”/”STUDY music” on left; “P”/”study MUSIC” on right). Each
phonetic block contained 50 trials (2 measurements at each of the 25 combinations of F0 and
duration). Each focus block contained 49 trials (1 measurement at each of the 49 F0 and
duration combinations). Each participant completed 20 blocks in total: 10 phonetic blocks (500
trials total, 20 repetitions of each stimulus in the phonetic acoustic space) and 10 prosodic
blocks (490 trials total, 10 repetitions of each stimulus in the prosodic acoustic space). Blocks
alternated between phonetic and prosodic tasks, with short breaks interspersed. The order of
trials in each block was randomized. The entire experiment lasted approximately 60 minutes.
Participants completed the experiment online, at home in a quiet room alone, using either
headphones (5 amusics, 7 controls) or external speakers (6 amusics, 4 controls). Two
participants did not have computers with sufficient sound capability and were therefore tested
in a laboratory at Birkbeck College. For all participants, testing was conducted via the Gorilla
web experiment platform (www.gorilla.sc/about) (Anwyl-Irvine, Massonnié, Flitton, Kirkham,
& Evershed, 2018).
Statistical analysis
Data were analyzed with R (R Core Team 2018). Cue weights were calculated by constructing
a multiple logistic regression for each participant (separately for phonetic and prosodic
paradigms) with F0 and Duration as factors (on integer scales from 1-5 for the phonetic task
estimated from these models were then normalized such that the F0 and Duration weights
summed to one to indicate the relative perceptual weight of each acoustic dimension in
categorization responses (Holt & Lotto, 2006; Idemaru et al., 2012). A large coefficient for F0
relative to Duration indicated that the F0 factor explained more variance in participants’
categorization judgments than the Duration factor. To test for group effects, the Cue Weights
for F0 and Duration were extracted for each participant and subjected to an
independent-samples t-test, separately for phonetic and prosodic tasks. Because the distributions of pitch
thresholds were non-normal, the relationships between pitch and duration thresholds and cue
weights were tested with Kendall’s Tau-b.
Results
Pitch, Duration and Speech-In-Noise Thresholds
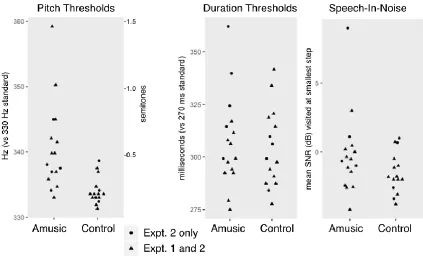
Among the subset of participants who took part in Experiment 1, amusic participants,
compared to controls, had significantly higher pitch thresholds (Wilcoxon Rank Sum W = 107,
p=.002), but similar duration (W=50, p=.51) and speech-in-noise thresholds (W = 78.5, p=.25).
The pattern held across all participants: amusics as a group had higher pitch thresholds than
controls (W = 29, p < 0.001), but did not differ from controls in tone duration discrimination
(W = 129, p = 0.74) or speech-in-noise threshold (W = 155.5, p = 0.17; Fig. 2). For the amusic
group, all pitch discrimination thresholds were below 1.5 semitones, assuring that our
manipulation of the F0 dimension in 2-semitone steps in the cue weighting paradigms would
Phonetic Cue Weighting
The normalized cue weights for the amusic and control groups were compared with t-tests
because normalizing the F0 and duration cue weights relative to each other (so they sum to 1)
causes them to be non-independent, and therefore a Group X CueType interaction test was
inappropriate. Recall that duration (VOT) was expected to be the primary cue for the phonetic
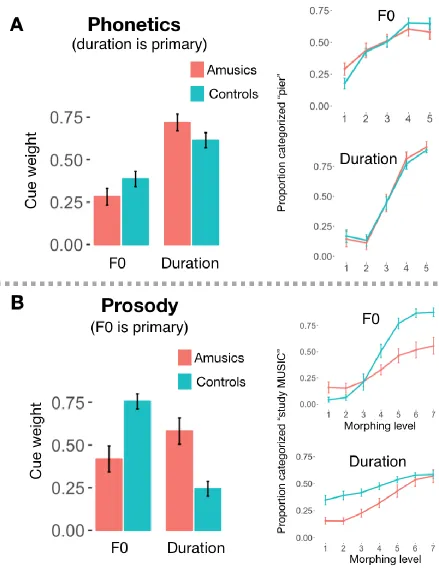
task. Accordingly, the magnitude of the pitch and duration weights did not differ between
groups (Fig. 3A; group effects T(20)= 1.58, p = 0.13). Although the mean responses between
amusics and controls (Fig. 4B) did not differ, the results of the independent-samples t-test of
perceptual cue weights across groups across each of the 25 stimuli are presented in Fig. 4B for
illustrative comparison. Here, again, categorization performance across groups was similar for
each stimulus in the acoustic space. No group differences were detected even at a very lenient
(uncorrected for multiple comparisons) threshold of p < 0.05.
Finally, we calculated a standard score reflecting participants’ relative ability to
discriminate pitch and duration in complex tones based on their perceptual thresholds, and
tested whether this metric was related to participants’ relative perceptual weightings in the
phonetics task. To obtain a standard score, each participant’s pitch and duration threshold were
subtracted from the standard F0 (for pitch, 330 Hz) or standard duration (270 ms) used in the
psychophysics test, then divided by the standard deviations of these distributions across
participants. The standard scores for pitch and duration were then combined with an asymmetry
ratio [(Pitch – Duration) / (Pitch + Duration)] such that higher values indicated finer pitch than
duration thresholds and lower values indicated the reverse. The relative ability to discriminate
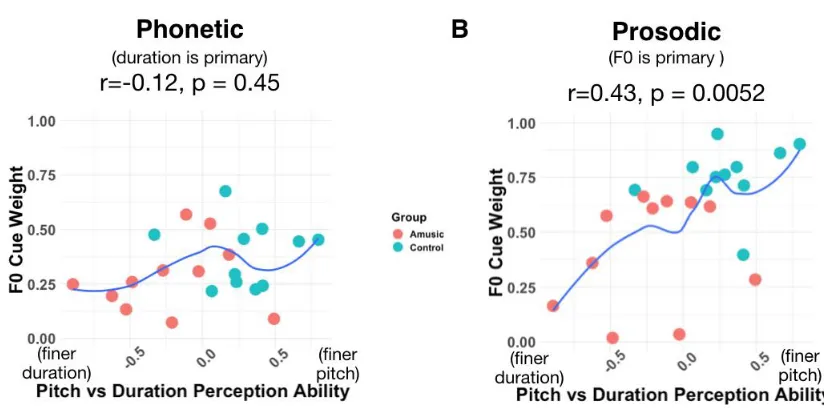
tone pitch versus duration did not correlate with perceptual weight of F0 in phonetic
categorization (Kendall Tau-b r=-0.12, p=.45; Fig. 5A).
Prosodic Cue Weighting
In the prosodic cue weighting task, for which F0 was the primary cue, the results were
strikingly different. The relative F0 perceptual weights were higher in controls than amusics,
whereas duration weights were higher for amusics than controls (both group comparisons T(20)
= 3.81, p=.001, Fig. 3B). This suggests that amusics, who do not process pitch reliably in
general, indeed perceptually weighted duration over F0. As mentioned above, an interaction
test on the normalized (relative) cue weights is inappropriate because they sum to 1 (e.g. if a
we note that an ANOVA on the raw cue weights (before normalization) further confirmed this
pattern (interaction of CueType [pitch vs duration] X Group [Amusic vs Control], F(1,40) =
10.45, p = 0.002, ηp2 = 0.21).
To provide a finer-grained understanding of each group’s weighting, Figure 4A plots
mean responses for each group across each of the 49 stimuli depicted schematically in Figure
1. As in the phonetic cue weighting task, we compared these matrices cell-by-cell (two-sample
T-tests Controls>Amusic, FDR-corrected, Fig. 4B). Unlike in the phonetic task for which
Control and Amusic participants performed similarly, many group differences emerged in the
prosodic categorization task, where controls relied relatively more on pitch versus duration
compared to amusics. All (multiple-comparisons-corrected) significant differences were in the
top half of the matrix, where F0 cued an emphasis on “MUSIC”. Most (12 out of 16) of these
significant group differences occurred in the 16 stimuli of the upper-left quadrant, where
emphasis was placed on “STUDY” by duration cues, and “MUSIC” by F0 cues. In this
ambiguous quadrant of the stimulus space, where F0 and duration signaled differing
interpretations, amusics relied on the duration cues to make their response more often than did
controls.
Across both the amusic and control groups, participants with finer pitch than duration
discrimination thresholds tended to have higher F0 (than duration) cue weights (Kendall
Tau-b r=0.43, p=.005; Fig. 5B).
Finally, we confirmed statistically the greater group differences in perceptual
weightings in the Prosody task compared to the Phonetic task (interaction of Group X
Figure 3: Comparison of F0 and duration cue weights for phonetic and prosodic
perception. A) Phonetic Cue Weighting. Mean perceptual weights plotted by group and
[image:21.595.79.518.93.669.2]duration; and each level of duration collapsed over F0. B) Prosodic Cue Weighting.
Figure 4: When F0 and duration cues conflict, amusics rely on duration when
categorizing prosody. A) Heatmaps indicate proportion of trials categorized as “study
MUSIC” (for the prosody portion, panel A) or “pier” (phonetics portion, panel B), for the
Control and Amusic groups. B) Group difference (Control – Amusic) heatmaps displaying
T-statistics. When duration and F0 conflicted in the prosody task (duration indicated emphasis
on STUDY, but F0 indicated emphasis on MUSIC; upper-left quadrant of stimulus space),
amusic participants chose the duration-based response more often than controls. Teal outlines
indicate significant group differences (corrected for multiple comparisons). Uncorrected
[image:24.595.98.510.289.493.2]results (p<.05) are indicated with green outlines.
Figure 5: Correlation between perceptual discrimination and perceptual cue weight. The
figures plot relative pitch versus duration thresholds as a function of the relative perceptual
weight of F0 in phonetic (A) and prosodic (B) judgments. The correlation shown is Kendall’s
Tau-b. Loess curves are plotted to indicate direction of trends. A. In the phonetic task, for
which F0 is a secondary perceptual dimension, there was no significant correlation between
perceptual thresholds and normalized perceptual weight of F0. B. In the prosodic task, for
which F0 is the primary perceptual dimension, individuals with finer pitch discrimination
thresholds tended to rely more on F0 in prosodic focus judgements, even though the F0
differences in the prosodic task were large enough to be perceptible by all participants.
In two categorization tasks, participants with amusia and control participants categorized
stimuli varying across F0 and duration dimensions according to a phonetic distinction and a
prosodic distinction. The phonetic and prosodic categorization tasks varied in the extent to
which category membership was cued by information from the F0 dimension versus the
duration dimension. For the phonetic distinction, duration had been established by prior
literature to be the primary dimension (Haggard et al., 1970; Massaro & Cohen, 1976; 1977),
while for the prosodic distinction, F0 was known to be primary (Chrabaszcz, Winn, Lin, &
Idsardi, 2014). We found that when duration was the primary dimension (in the phonetics task),
the amusic and control groups categorized similarly, each relying predominantly on duration
(VOT) to signal category membership. However, when F0 was primary (in the prosody task),
classification behavior differed between the groups: controls classified ambiguous stimuli (for
the most part) according to the primary dimension (F0), as predicted by prior research (Breen
et al., 2010) whereas amusics tended to classify the very same stimuli instead according to
duration. Crucially, this difference could not be explained by the amusic participants being
simply unable to hear the F0 cues, because (1) sensitivity to the F0 dimension was observed in
both the phonetic and prosodic task and (2) the differences in F0 across stimulus levels in each
task were large enough to be above-threshold and clearly perceptible to the amusics. Indeed,
they were well above amusics’ independently-measured pitch thresholds.
Many prior studies have reported large individual differences in dimensional weighting
during speech perception across a variety of different contexts, including Mandarin tone
perception (Chandrasekaran et al., 1010), place of articulation (Hazan & Rosen, 1991), stop
consonant length (Idemaru et al., 2012), vowel contrasts (Kim et al., 2018), and voicing
(Schertz et al., 2015; Kong & Edwards, 2016). Here, we provide evidence that individual
differences in dimensional weighting do not solely reflect measurement noise, but instead can
indicate stable listening strategies: amusic individuals focus on the dimensions which they are
best able to process and down-weight the dimensions which they have historically found less
useful. This finding suggests, more generally, that differences in dimensional weighting may
reflect weighting of perceptual evidence by precision, i.e. inverse variance (Feldman & Friston
2010). In other words, an ideal strategy for one listener may be sub-optimal for another due to
individual differences in the precision of auditory perception. Thus, we suggest that the
computational problem which must be solved during speech perception differs across listeners,
Amusics’ adoption of this specialized perceptual strategy could help explain why
amusics do not generally report difficulty with speech in everyday life (F. Liu et al., 2010),
despite displaying deficits when tested on speech perception tasks requiring the use of F0
information. Indeed, we further found that psychophysical thresholds across all participants,
controls and amusics, correlated with the relative weighting of F0 versus durational
information in the prosodic task, confirming a link between the precision of perception along
a given primary dimension and the extent to which listeners weight that dimension in
perceptual categorization. This relationship between perceptual acuity and categorization
strategies could extend to other perceptual domains as well, such as identification of
characteristics of environmental sounds (Lutfi & Liu, 2007).
Amusic and control groups overlapped in pitch discrimination thresholds, which may
initially seem surprising, given that the amusic participants were defined as having severe
difficulties with pitch perception. However, amusia is not defined solely on the basis of poor
pitch discrimination, but on the basis of performance on batteries of music perception,
specifically on tests of comparing melodic sequences. Performance on melodic sequence tasks
can be driven by difficulties with low-level encoding of pitch, but could also be driven by
difficulties with other aspects of pitch processing, including pitch memory, perception of
higher-level pitch structures such as tonal relationships, etc. In this manuscript, due to testing
time constraints, we evaluated pitch versus duration perception abilities using relatively simple
psychophysical tests rather than comprehensive batteries. In practice, however, we suggest that
cue weighting is fundamentally driven by a range of pitch-related and duration-related skills,
which include but are not limited to low-level encoding and discrimination.
The results of Experiment 1 revealed that amusics weight F0 cues relatively less than
duration cues, compared to controls. This was true for the prosodic task where F0 was typically
the primary dimension, but not true for the phonetic task, where duration is typically primary.
This suggests that listeners will only change cue weighting in response to perceptual difficulties
if the dimension they have difficulty processing is the primary cue for a given linguistic feature.
An alternative explanation, however, is that these findings may reflect a specific amusic deficit
for integration of pitch information across longer time frames, rather than a simple encoding
deficit. Indeed, in the prosody paradigm, F0 information unfolded over time in the order of
seconds, whereas in the phonetic paradigm the F0 excursion was over milliseconds. Future
short time scale) by examining cue weighting in amusics and controls for perception of a
prosodic feature for which duration is a dominant cue, such as lexical stress (Mattys, 2000).
Overall, these results indicate that the manner in which auditory dimensions map to
linguistically-relevant categories differs across listeners, and that these individual differences
in perceptual weighting reflect, at least in part, variability in how well listeners can perceive
auditory dimensions. A particular dimension, for example, may be primary for one listener but
secondary for another, leading to differing categorization strategies for the same stimuli across
different listeners.
Experiment 2
While Experiment 1 focused only on speech perception, redundancy in acoustic signals ought
to aid with perception of music as well. In Experiment 2 we examined whether cue redundancy
in more naturalistic stimuli from speech, as well as music, leads to robustness in the face of
perceptual deficits. In other words, we tested whether the perceptual strategy employed by
amusics in Experiment 1—where amusics rely less on pitch information when it is a primary
cue, focusing instead on other sources of information about speech—can be successful enough
to lead to perceptual categorization performance equivalent to that of control participants.
Although amusia is canonically a problem with using pitch information to perceive
music, there are temporal cues to certain musical structures (such as the beginnings and ends
of phrases (Palmer & Krumhansl, 1987) that could theoretically enable amusics to compensate
for poor pitch perception and successfully track musical features. To examine this possibility,
first, in a music perception test, participants categorized phrases as complete or incomplete
when they could rely on pitch alone, duration alone, or both dimensions simultaneously. If so,
we predict that amusics should be able to detect musical phrases when durational cues are
present, but not when only pitch cues are present.
Second, we investigated whether temporal dimensions in speech provide sufficient
information for amusics to compensate for poor pitch perception, enabling categorization of
prosodic information at a level similar to that of controls. We tested this with two linguistic
prosody tasks, one for which pitch/F0 is generally the main distinguishing cue and one where
durational cues are primary. In both tasks we measured the extent to which participants could
use F0 and duration dimensions to make categorical decisions about whether words had
them.') or whether phrase boundaries were present or absent ('After John runs [phrase
boundary], the race is over’). To do this, we manipulated stimuli such that participants needed
to rely on the F0 dimension alone, the duration dimension alone, or could use both. Across
both speech and music perception, we predict that if there is sufficient information in durational
patterns for the extraction of structural features--that is, if pitch and duration are fully
redundant--then amusics should perform similarly to controls in both the duration-only and
combined F0 and duration conditions for both music and speech perception, and that amusics’
performance should be improved by the presence of redundant cues
Methods
Participants
All 31 recruited participants took part in Experiment 2. For description of participants see
Experiment 1.
Procedure
This experiment was performed in a quiet laboratory at Birkbeck using headphones. The
Linguistic Phrase Test was run first (~20 minutes), followed by the Musical Phrase Test (~20
minutes), then the Focus Test (~30 minutes).
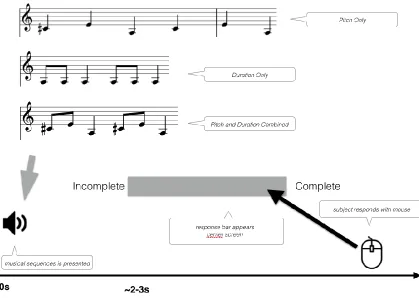
Musical Phrase Perception Test
Stimuli
The stimuli consisted of 150 musical phrases taken from a corpus of folk songs (Schaffrath &
Park, 1995). Musical phrases were synthesized as a sequence of six harmonic complex tones
with 10ms cosine onset and offset ramps. Stimuli were created in three conditions that
manipulated the acoustic dimensions available to listeners. In the Combined condition, the
musical phrase contained both pitch and duration information (as typical naturalistic melodies
do). Fifty stimuli were selected from the database for this condition only, and fifty additional
stimuli were selected for each of two additional conditions. In the Pitch condition, the pitch of
the melody was preserved (as in the original version) but the durations were set to be
isochronous and equal to the mean duration of the notes in the original melody. This is because
although isochronous can be perceived as rhythmic (Brochard et al., 2003), isochronous
condition, the original note durations were preserved but the pitch of the notes was made to be
monotone at a pitch of 220 Hz. In an additional manipulation, half of the stimuli presented in
each condition formed a complete musical phrase with the notes in an unmodified sequential
order - these could be perceived as a Complete musical phrase. The other half were made to
sound Incomplete by presenting a concatenation of the second half of the musical phase and
the first half of the next musical phrase in the song. The order of the notes within the two
halves was preserved. Thus, the resulting Incomplete stimuli contained a musical phrase
boundary that occurred in the middle of the sequence, rather than at the end.
Procedure
On each trial, a musical note sequence was presented to the participant through headphones.
After the sound finished playing, a response bar appeared on the screen which was
approximately 10 cm in width. Participants were tasked with deciding how complete each
musical phrase sounded by clicking with their mouse on the response bar. (A continuous
measure of completeness was used to avoid potential ceiling/floor effects due to bias on the
part of individual listeners to hear phrases as complete or incomplete.) The word “Incomplete” was shown on the left side of the response bar, and the word “Complete” was shown on the
right. Participants could click anywhere within the bar to indicate how complete they thought
the phrase had sounded (Fig. 6). The next stimulus was played immediately after a response.
Participants judged 3 blocks of 50 trials each, with a short break in between. As the study was
aimed at understanding individual differences, the block order was always the same, with all
the trials in a condition presented in a single block, in the same order (Combined Cues, then
Duration Only, then Pitch Only). Within a block, half of the trials were Complete, and half
Incomplete. The main outcome measure was the raw rating difference between Complete and
Incomplete trials for each condition. Trials were blocked by condition because the three
conditions for the Musical Phrase test were saliently different, and so fully randomizing trials
Figure 6. Schematic of trial structure for the Musical Phrase Test. Participants heard either
a complete musical phrase or a musical sequence that straddled the boundary in between two
musical phrases. They then indicated how complete they thought the phrase sounded by
Linguistic focus perception task
Stimuli
The stimuli consisted of 47 compound sentences with an intervening conjunction created
specifically for this study. Each of the sentences was read with emphasis to create had two
versions: “early focus”, where emphasis occurred early in the sentence and served to contrast
with a similar word later in the sentence (e.g., “Mary likes to READ books, but she doesn’t
like to WRITE them,” focus indicated by upper-case letters), and “late focus”, where the focus occurred slightly later in the sentence (e.g., “Mary likes to read BOOKS, but she doesn’t like
to read MAGAZINES,” focus indicated by upper-case letters). (See Fig 7A,B; Supplementary
Material Section 1).
We recorded these sentences (44.1 kHz, 32-bit) using a Rode NT1-A condenser
microphone as they were spoken by an actor who placed contrastive accents to emphasize the
capitalized words. Recordings of both versions of the sentence were obtained and cropped to
the identical portions (underlined above). We used the standard STRAIGHT (Kawahara &
Irino, 2005) morphing pipeline, which involves decomposing the signal of the two recordings
into 3 parts: first, the F0 structure was extracted from voiced segments of each of the two
utterances; next, aperiodic aspects of the signal (such as obstruents) were identified and
analyzed; then, the filter characteristics of the signal (similar to the power spectrum) were
calculated. Finally, the two “morphing substrates” (speech from each recording decomposed
into these component parts) were manually time aligned by marking corresponding anchor
points in both recordings, such as the occurrence of salient phonemes, so that morphs reflect
the temporal characteristics of the two initial recordings, to varying degrees. Once
time-aligned, morphs can be created by varying the degree to which each morphing substrate
contributes information about F0, aperiodicity, filter, and duration. The relative contribution of
each morphing substrate is given as the morphing level, on a scale from 0% to 100%, with 50%
indicating equal contribution from each of the two individual recordings. For our study, we
only manipulated the F0 and durational characteristics of the morphs, and left the other aspects
set to the midpoint, such that each recording contributed equally. We then produced 6 different
kinds of morphs by varying the amount of pitch-related (F0) and duration information either
independently or simultaneously. For F0 only stimuli pairs, the late and early focus sentences
differed only in F0 excursions. The temporal morphing level between the two versions was
focus version recording. This resulted in two new ‘recordings’ that differed in F0 excursions,
but were otherwise identical in terms of duration, amplitude and spectral quality. For duration
only stimuli, we created two more morphs that held the F0 morphing proportion at 50% while
the duration proportion was set to either 75% early focus or 75% late focus. The output differed
only in duration, and were identical in terms of F0, amplitude and spectral quality. Finally, we
made “naturalistic” stimuli where both F0 and duration information contained 75% of one
morph or the other, and thus F0 and duration simultaneously cued either an early or late focus
reading. Across pairs of stimuli, the mean largest difference in F0 between ‘early’ and ‘late’
focus was 8.1 semitones. All files were saved and subsequently presented at a sampling rate
44.1 kHz with 16-bit quantization.
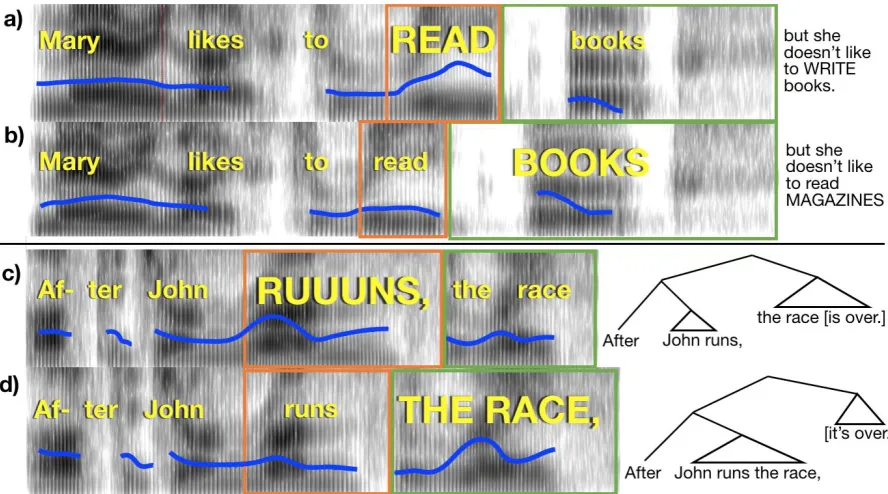
Figure 7. Pitch and duration correlates of emphatic accents and phrase boundaries.
Spectrograms of stimuli used in the experiment (time on horizontal axis, frequency on vertical
axis, and amplitude in grayscale), with linguistic features cued simultaneously by F0 and
duration (the “Combined” condition). Blue line indicates F0 contour. Width of orange and
green boxes indicate duration of the words within the box. A) Emphatic accent places focus on
“read”. Completion of the sentence appears to the right. B) Emphatic accent places focus on “books”; sentence completion is at right. C) A phrase boundary occurs after “runs”. D) A phrase boundary occurs after “race”. Syntactic trees are indicated at right to illustrate the
[image:32.595.74.518.294.541.2]Procedure
Stimuli were presented with Psychtoolbox in Matlab. Participants saw sentences presented
visually on the screen one at a time, which were either early or late focus (see paradigm
schematic in Fig 7A,B and Fig 8A). The emphasized words appeared in all upper-case letters,
as in the examples above. Participants had 4 seconds to read the sentence to themselves silently
and imagine how it should sound if someone spoke it aloud. Following this, participants heard
the first part of the sentence spoken aloud in two different ways, one that cued an early focus
reading and another that cued late focus. Participants were instructed to listen and decide which
of the two readings contained emphasis placed on the same word as in the text sentence. After
the recordings finished, participants responded by pressing “1” or “2” on the keyboard to
indicate if they thought the first version or second version was spoken in a way that better
matched the on-screen version of the sentence. The correct choice was cued either by F0 or
duration exclusively, or both together. The serial order of the sound file presentation was
randomized (uniquely for each participant). The stimuli were divided into 3 lists (47 trials each)
and counterbalanced such that each stimulus appeared once in each condition (F0, duration,
and both). For 23 of the stimuli, two of the presentations were early focus, and one was late
focus; for the remaining stimuli, two presentations were late focus and one was early. The trials
were presented in the same order for every participant. The entire task lasted approximately 30
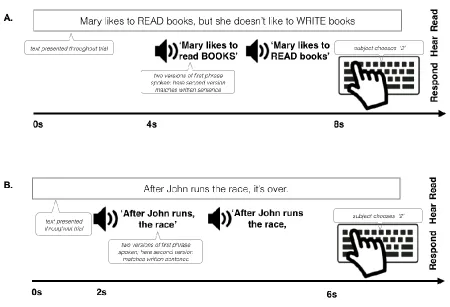
Figure 8:Example trial structure for the linguistic focus test (A) and the linguistic phrase
test (B). First, a single sentence was presented visually, and the participants read it to
themselves. Next, two auditory versions of the first part of the sentence were played
sequentially, only one of which matched the focus pattern of the visually presented sentence.
Participants then indicated which auditory version matched the onscreen version with a button
Linguistic phrase perception test
Stimuli
The stimuli consisted of 42 short sentences with a subordinate clause appearing before a main
clause (see Figure 7C, D). About half of these came from a published study (Kjelgaard & Speer,
1999) and the rest were created for this test (see Supplemental Material Section 2). The
sentences appeared in two conditions: an “early closure” condition, for which the subordinate clause’s verb was used intransitively, and the following noun was the subject of a new clause (“After John runs, the race is over”) ; and “late closure”, where the verb was transitive and took
the following noun as its object, causing the phrase boundary to occur slightly later in the
sentence (“After John runs the race, it’s over”). Both versions of the sentence were lexically
identical from the start of the sentence until the end of the second noun.
A native Standard Southern British English-speaking male (trained as an actor; the
same voice model as for the focus task) recorded early and late closure versions of the sentences
in his own standard Southern English dialect. The recordings were cropped such that only the
lexically identical portions of the two versions remained, and silent pauses after phrase breaks
were excised. The same morphing proportions were used as in the focus task – with early or
late closure cued by 75% morphs biased with pitch, duration or both combined. As was done
with the linguistic focus task, the stimuli were crossed with condition (F0, duration, and both)
and early vs. late closure and divided into three counterbalanced lists. Across pairs of stimuli,
the mean largest difference in F0 between ‘early’ and ‘late’ closure was 6.4 semitones.
Procedure
The procedure for the Linguistic Phrase test was similar to that of the Linguistic Focus Test.
Participants saw sentences presented visually on the screen one at a time, which were either
early or late closure, as indicated by the grammar of the sentence and a comma placed after the
first clause (Figure 8B). They then had two seconds to read the sentence to themselves silently
and imagine how it should sound if someone spoke it aloud. Following this period, participants
heard the first part of the sentence (which was identical in the early and late closure versions)
spoken aloud, in two different ways, one that cued an early closure reading and another that
was cued by either F0 differences, duration differences, or both F0 and duration differences.
Participants completed three blocks of 42 trials. Stimuli were counterbalanced such that each
stimulus appeared once in each condition, and half the of presentations were early close and
half were late close. The trials were presented in the same order for every participant. The task
was performed in a lab at Birkbeck and lasted approximately 25 minutes.
Psychophysics
As described in Experiment 1, thresholds for pitch and duration discrimination, and ability to
hear speech in noise, were measured using the MLP toolbox (Grassi & Soranzo, 2009).
Statistical analysis
Data were analyzed with R. For the musical phrase, linguistic focus and linguistic phrase tests,
linear mixed effects models were estimated using lme4, with Group (Amusic or Control),
Condition (Pitch, Duration or Combined) and their interaction entered as fixed effects, and
Item and Participant as random intercepts. P-values for these effects were calculated with
likelihood ratio tests of the full model against a null model without the variable in question.
Comparisons of predicted marginal means were performed with lsmeans.
The dependent variable for the Musical Phrase Test was calculated by identifying the
raw response value between -50 and 50 (for each trial) based on the position along the response
bar on which the participant clicked, with -50 corresponding to responses on the extreme end
of the Incomplete side of the scale. The sign of the data point for Incomplete trials was then
inverted so that more positive scores always indicated correct performance and greater scores
indicated more accurate categorization of musical phrases.
The dependent variable that was entered into the model for the Focus and Linguistic
Phrase tests was whether each response was CORRECT or INCORRECT. Because the
dependent variable was binary, we used the generalized linear mixed models (glmm) function
in the lmer package to estimate mixed effects logistic regressions, and we report odds ratios as
a measure of effect size.
Results