BIROn - Birkbeck Institutional Research Online
Cocea, Mihaela and Magoulas, George D. (2015) Participatory learner
modelling design: a methodology for iterative learner models development.
Information Sciences 321 , pp. 48-70. ISSN 0020-0255.
Downloaded from:
Usage Guidelines:
Please refer to usage guidelines at
or alternatively
Participatory Learner Modelling Design: a Methodology for Iterative
Learner Models Development
Mihaela Coceaa,∗, George D. Magoulasb
aSchool of Computing, University of Portsmouth, Buckingham Building, Lion Terrace, Portsmouth PO1 3HE, United
Kingdom
bLondon Knowledge Lab, Birkbeck College, University of London, Malet Street, London WC1E 7HX, United Kingdom
Abstract
Learner models are built to offer personalised solutions related to learning. They are often developed in
parallel to the development of adaptive learning systems and thus, linked to the system’s development.
The adaptive learning systems literature reports numerous accounts of learner model development, but
there are no reports on the methodological aspects of developing learner models and the relation between
the development of the learner model component and the rest of the system. This paper presents the
Participatory Learner Modelling Design methodology, which outlines the steps for learner model development
and their relation to the development of the system. The methodology is illustrated with a case study of an
adaptive educational system.
Keywords: Learner/User Models, Adaptive Systems, Participatory Design, Methodology, Iterative
Development
1. Introduction
The ability to personalise in order to adapt to the needs of a variety of students and accommodate their
different background, skills and abilities is becoming an important feature of e-learning systems. To this
end, a lot of research effort has been spent in the last 10 years in the area of adaptive learning systems and
a variety of methods have been proposed to build learner models, which allow a system to personalise its
5
∗Corresponding author
Email addresses: [email protected](Mihaela Cocea),[email protected](George D. Magoulas)
interaction to individual learners. A recent review paper on the subject of learner modelling [19] outlines
the different approaches for learner modelling used in the last decade.
Learner models are a type of user model, where the user is a learner. User models typically store
information about a user (e.g. individual traits, goals, plans, preferences) and enable a system to adapt
its behaviour to the individual user. User models are used in a variety of systems, such as Adaptive
10
Information Systems and Recommenders, Mobile/Ubiquitous Systems, Adaptive Hypermedia Systems and
Adaptive Educational Systems [15].
Several terms are used to indicate a systems’ capacity to adapt to users. The most frequently used terms
are personalisation and adaptation. The first refers to the effect the system has on the users, while the latter
refers to the changes the system produces for different users based on their user models. In other words,
15
from system design point of view, we think it is important to separate the purpose, i.e. personalisation, from
the mechanism that achieves that purpose, i.e. adaptation. The adaptation is typically achieved through
the utilisation of user models, which are the focus of this paper; consequently, throughout this paper we use
mostly the term adaptation. The two terms, however, are deeply interlinked as the purpose of building user
models in to provide personalised interaction.
20
The process of creating a user model, and consequently a learner model, and keeping it up-to-date
includes three stages [80]:
1. what is being modelled? (nature)
2. how is this information represented? (structure)
3. how is the model maintained? (user modelling approaches)
25
User models can be built for individuals or groups of users. Early user modelling research focused
on groups and used stereotypes available a priory for this purpose; later on, most research focused on
individual user models; however, research on group models continued (e.g. [72, 10]) and grew over the last
decade (e.g. [91, 52, 8, 62, 86, 42]).
In the last decade, there have also been growing developments in the direction of user models
inter-30
operability [17], including: a general user model ontology for uniform interpretations of distributed user
models [45], generic user models that can be used to define user models for a variety of applications [56],
cross-system user modelling where a user model from one system is re-used in another [1]. These
devel-opments are possible when the user modelling process is independent from the domain [56]; cross-system
user modelling allows re-use of user-models in applications that deploy similar user information, such as
35
For many adaptive systems, however, the user models are still tightly linked to the system that uses
them in general, and the user interface and adaptation modules in particular. This is notably the case for
educational systems where a participatory design [35, 66] is used.
At the same time, there has been a shift from building systems as a whole to separating the different
40
components of the system. The movement towards service-oriented architectures [49] and component-based
development [30] emerged from the need to separate the development of the various components of a system
from the development of the system as a whole, and led to challenges in assembling different components
and services.
Particularly within the educational technology research, there is a move towards grid technologies, which
45
enable sharing of learning resources in heterogeneous and geographically distributed environments [76]. This
paradigm promotes the focus on stateful services and on flexibility in the way they are combined [3]. Unlike
stateless services, stateful ones keep a record of the previous transactions; the interested reader can find
more details on stateful services in [37].
Moreover, there is increasing focus on user involvement in product or service design, not only in the
50
initial development phases, but throughout the development process [71], as well as involving the user in
the design of particular components of the system [6].
The separation between the development of the learner model component and the development of the
system is known to be a difficult issue [55] because the development of the learner model component needs to
be coordinated with the development of the system. Despite the advances in the learner modelling research
55
area, the literature is lacking in methodological frameworks for the development of learner models and the
interplay between the learner model and the system development.
In this paper we focus on learning applications with a strong link between system and user model
development. Moreover, we are particularly focusing on user-centred participatory design [66], where the
users are involved in the development of the system and of the user model component. Consequently, this
60
methodology is appropriate for adaptive learning systems which are built with the involvement of users.
A case study illustrates how the methodology works in practice. The case study refers to the development
of an adaptive educational system for teaching mathematical generalisation in classroom settings to children
of 11 to 14 years old. More details about the design of the entire system can be found in [70], while details
about feedback elicitation are given in [63]. The case study is representative of adaptive learning systems,
65
and in particular of exploratory learning environments, and illustrates how the methodology facilitated the
development.
The rest of the paper is organised as follows. Section 2 provides an overview of the learner modelling
process, previous literature on learner modelling and adaptive systems development, and on iterative and
70
participatory design. Section 3 describes the specifics of our methodology and the interplay between
sys-tem development and learner model development. Section 4 illustrates, through a case study, how our
methodology provides a structural systematic approach to learner model development in the context of
par-ticipatory design of a complex adaptive educational system. Section 5 discusses our methodology, including
its generality and the lessons that we learned from its use, that we believe other researchers will find useful.
75
2. Background
This section presents an overview of the literature in relation to: (a) learner modelling, (b) adaptive
educational systems development with a focus on the learner model development and relation to system
development, and (c) iterative participatory design.
2.1. Learner modelling
80
A learner model is a representation of a learner and consists of data about the learner or about what the
learner does. Typically, a learner model would store data about a learner’s knowledge, preferences, goals,
tasks and interests [14].
The term Learner Modelling refers to the process of generating a learner model in the context of an
intelligent learning environment [13]. A learner model enables the system to adapt to the learner who
85
uses it and ideally includes all information about the learner’s behaviour and knowledge that influences
their learning and performance [88]. The content of a learner model depends on the learning environment
and includes inferred information about aspects such as a learner’s goals, plans, knowledge, attitudes and
abilities, but the most important information about a learner is his or her knowledge of the subject that is
being studied [13].
90
Table 1 gives an overview of learner modelling approaches, looking at: what is modelled; when adaptation
occurs; the form of adaptation, modelling technique and modelling approach. This overview focuses on
capturing the variety of aspects that are modelled, as well as the diversity of approaches used. It is not
meant to be an exhaustive overview of the filed.
In terms of what is being modelled, a variety of aspects are used for different purposes: knowledge,
95
goals and tasks, used background, individual styles such as cognitive and learning styles, and contextual
When the adaptation occurs depends on what is being modelled and the purpose of the adaptation. For
example, if knowledge is modelled, the adaptation occurs when learning can be facilitated by adapting the
levels of details presented or by providing feedback when solving a problem/learning task.
100
The form of adaptation refers to the change that is introduced according to the information that is being
modelled. For example, different learning goals may lead to different materials or different sequences of
materials being presented to the learners.
The modelling technique describes the specific user modelling technique used (e.g. Bayesian Networks,
Case-based reasoning), while the modelling approach describes categories of user modelling approaches ( e.g.
105
stereotype, feature-based, overlay). Two broad categories of modelling approaches are feature-based and
stereotype. The feature-based approach models specific features of individual users, such as knowledge, goals
and interests [14]. The stereotype models work by grouping users in several categories called stereotypes;
all users belonging to the same stereotype receive the same adaptation.
Other types of modelling approaches are overlay models and uncertainty-based models. Overlay models
110
represent the users’ knowledge as a subset of a domain model; the domain model represents the expert
knowledge of a subject. Uncertainty-based models refer to the uncertainty introduced in the diagnosis
through inference. For example, when assessing users’ knowledge of a concept by their performance to a
test, the observation that they did not do well in the test leads to the conclusion that the user probably does
not master that concept to a satisfactory level. On the contrary, no uncertainty is involved in establishing
115
the platform of a user to inform adaptation to screen size, for example.
2.2. Adaptive learning systems methodologies
Several approaches have been proposed for the development of adaptive systems that employ user
mod-els for adaptation and personalisation. A framework for the development of adaptive systems taking into
consideration context and user models was proposed by Zimmermann et al. [92]; they focused on the
relation-120
ship between user and context modelling. Michaud and McCoy [64] proposed a methodology for acquiring
stereotypes to be used in the modelling process.
Benyon and Murray [5] outlined an architecture for adaptive systems that includes a domain model, a
user model and an interaction model. Methodological aspects were also pointed out such as the development
of the adaptive parts of the system in parallel to the development of the application and the explicit
125
separation of the user model from the other components of the adaptive system, which would facilitate
easy modifications in the adaptive mechanism as the details of interaction are better understood. Our
to the user model as new information about details of interactions emerge/change from other components
of the adaptive system.
130
Mangina and Kilbride [61] outlined some methodological issues when designing user models for online
learning environments such as Moodle; these issues are important in term of the responsiveness of a system
when there are many users: granularity, storage and retrieval.
One area of research that provides description and analysis of the processes involved in designing adaptive
systems is authoring of adaptive systems. This field of research focuses on building tools that allow users
135
without programming knowledge/experience to design adaptive solutions [29]. Several architectures have
been proposed, such as the AHAM [90] and LAOS [28, 67]. Most proposed models include a domain model, a
user model and an adaptation/interaction model, as suggested by Benyon and Murray [5]. However, “the few
tools that have been designed for non-technical experts to author adaptive courses are not commercial but
are prototypes which have only been used within third level or formal learning” ([38], p. 2781). Moreover,
140
these approaches focus on the system as a whole, while our approach focuses on the user model component
and its relation to system development.
2.3. Iterative and participatory designs
Iterative development involves building and delivering software in iterations, with each iteration being
a working software system that generally has more functionality, i.e. range of operations of the system,
145
than the version of the previous iteration. Iterative development dates back to mid-1950s [59] and it is
increasingly used in research and commercial projects due to the possibility to deliver functionality in parts,
which, in turn, allows effective management of risks [51]. For other models of software development, the
interested reader can consult [83].
Similar to iterative development, user-centred and participatory designs are increasingly popular due to
150
the rise of highly interactive systems, which can be defined as systems that require a significant degree of
user interaction [58]. They also involve an iterative approach, but unlike the software iterative approach
focused on functionality, the focus is on usability. Adaptive systems are user-centred systems in which
both functionality and usability are important. In fact, these are highly interlinked, as adaptivity could be
considered a functional requirement that enhances usability.
155
A lot of research has emerged within the last 10-15 years in the area of learner-centred design, arguing
for the learners’ involvement in the design of intelligent educational systems, especially when learners are
children, as adults have a limited knowledge about how children make sense of software. Following is an
Some proposed approaches for learner-centred design focus on the designproduct(the educational system)
160
(e.g. [81, 82]), while others focus on the designprocess (e.g. [35, 77]).
The TILT model (tasks, interfaces, learner’s needs, tools) [81] was inspired from user-centred design that
uses three of the aforementioned concepts, i.e. tasks, tools and interfaces, and adds a new concept that the
authors argue as necessary for learner-centred design, i.e. learner’s needs.
The Persistent Collaboration Methodology (PCM) [27] focuses on the process of designing intelligent
165
educational systems. Teachers, researchers and technologists are involved in a cycle of observation, reflection,
design and action. This approach is considered by Good and Robertson [40] to be moreschool-centred than
learner-centred because learners were not part of the design team.
The term participatory design in which end users are involved and in which the users are children has
been used by Druin [34, 35] who defined a methodology called cooperative inquiry. It involves a four-step
170
process:
1. the contextual inquiry phase which involves collection of data in users’ own environment;
2. the ‘sticky note critiquing’ phase during which children and adults critique an exiting piece of
tech-nology and, using sticky note pads record their likes, dislikes and a third category, e.g. surprises;
3. the participatory design phase in which the design team, including children, takes part in low-tech
175
prototyping sessions;
4. the technology immersion phase which involves creating a space where children are able to access
and use the existing technologies over a sustained period of time with researchers observing children’s
activity patterns in an unconstrained setting.
Several forms of involvement [35] are proposed to include children in the design of learning environments,
180
which are given on a gradual scale. At the bottom of the scale the children’s involvement is small as they
act asusers of technology. On the next steps, the children are more involved, acting astesters of prototype
software and as informants, i.e. giving input in the design process. At the top of the scale, the children
have the status of designpartners acting as equal stakeholders throughout the design process.
Good and Robertson [40] pointed out that the focus of cooperative inquiry is on children as technology
185
users, while learner-centred design has a more constrained focus on children as technology learners, i.e.
children who use the technology as a vehicle for learning.
The Informant Design Framework [77] considers several stakeholders including children, teachers,
starts with specifying the learning goals and teaching practices for the domain and translate the
specifica-190
tion initially into low-tech and later into high-tech designs. The expertise of the different stakeholders is
used on specific aspects of the learning environment throughout the design process rather than having all
the stakeholders working as an integrated team at all stages of the project.
The CARSS framework (Context, Activities, Roles, Stakeholders, Skills) [40] was specifically developed
for participatory, learner-centred design with children. The context refers to the awareness of the broader
195
context in which the design activity takes place. The activities describe the sequence of events that occur in
the typical educational software design cycle. The roles describe the various functions that a member of the
design team can fulfil, with each member possibly fulfilling more than one role. The stakeholders cover all
the individuals who have a vested interest in the design process, and the skills refer to personal attributes
and dispositions necessary to conduct successful design sessions. This framework can be applied to both
200
intelligent and non-intelligent learning environments. It attempts to be fully inclusive and to be used for
the design of interactive learning environments for children.
Another methodology entitled Identification-Development-Refinement (IDR) methodology [89] was
pro-posed to address the issues related to interdisciplinary design. It aims to look at the full cycle of the design
process and not just the software output and thus to include other outputs such as design patterns and
205
pedagogical plans. Also, it focuses on engaging participants to reflect on their previous successful practices
and to scaffold this reflection to generalizable solutions useful to the wider community. This
methodol-ogy includes three stages: (a) the aim of the first stage is to identify potential patterns through the use
of typologies and case studies; (b) the second stage looks at developing a set of patterns based on design
evidence from the case studies; (c) the third stage aims to improve the patterns through collaborative
dis-210
cussion and reworking. The patterns are meant tomediatethe interdisciplinary design process through their
identification, development and refinement by the project participants.
Our methodology, described in the next section, complements these methodologies by outlining how the
information from participants is integrated in the development of the learner model component.
3. Participatory learner modelling design
215
Our proposed methodology is for adaptive systems that use an iterative design in which users participate
by at least providing interaction data. The next subsection, i.e. Section 3.1, presents details about the
development of user models and describes our proposed methodology in terms of iterative processes. The
system.
220
3.1. Learner model development
In the previous section, three stages were mentioned in relation to user models; in the following we
outline the methodological aspects involved in these stages.
What is being modelled? The first stage relates to the nature of information in the user model, which
225
depends on the adaptive system of which the user model is part. As mentioned in Section 2.1, different types
of adaptive systems store different user information depending on the aim of the adaptation. For example,
if the aim of the adaptive system is to deliver information through a variety of devices, the user model needs
information about the user’s device. Consequently, the answer to the question “what is being modelled?”
is partly included in the system’s requirements. This, however, needs further elaboration to address the
230
following stages. For example, in an adaptive educational system that aims to recommend study materials
based on the user’s knowledge, further details are needed such as the domain of study, the concepts of this
domain and the relations between these concepts (for example, concept A is a prerequisite for concept B).
Designing a conceptual model to include these details is our proposed way of formalising the answer to the
question “what to model” in a way that would facilitate finding answers to the questions corresponding to
235
the subsequent stages.
A linked question to “what to model?” is “when should adaptation be provided?”. This is typically a
requirement for the adaptation module that should trigger adaptation at certain times and in certain forms.
However, this cannot be separated from the user model module because the answer to “when to provide
adaptation?” is linked in certain situations to the knowledge about the user and it is that information (from
240
the user model) that triggers the adaptation. An increasingly popular way of addressing these complex
situations which involve requirements for several components of a system is through scenarios.
Scenarios are used in the development of interactive systems to understand the situation in which the
user needs to be “supported” by the system; they are now accepted in software engineering research and
practice [46]. According to Nardi [68] the purpose of a scenario is to provide “an explicit concrete vision
245
of how some human activity could be supported by technology” ([68], p.13). Scenarios are considered the
basis for the overall design and for technical implementation, and facilitate cooperation between users and
designers [9]. A survey of typical scenarios usage in different fields is presented in [39]. In relation to previous
methodologies, one could argue that for the purpose of user modelling the patterns discussed in the IDR
methodology [89] fulfil the same role as scenarios.
For the purpose of user model design and development, scenarios are used to establish what information
is needed about the user and to test the modelling technique with respect to each scenario. For example,
if the user model should contain information about the user’s knowledge of a particular concept in order to
recommend study materials at the appropriate level, the modelling mechanism should provide information
about the user’s knowledge of that particular concept.
255
How is the information represented? The second stage concerning the representation of information
is informed by the first stage. Consequently, at this stage appropriate representations should be identified
for the conceptual model developed previously, while also considering the scenarios. This may require only
a literature search and adoption of a known representation or more innovative approaches.
260
How is the model maintained? The third stage involves the construction and maintenance of the user
model. This is tightly linked to the previous stage, as representation of information is linked to the way it
is used. In practice, the representation of information and the user modelling techniques are often decided
at the same time because some representations can be employed only with some techniques and some
tech-265
niques require particular ways to represent information.
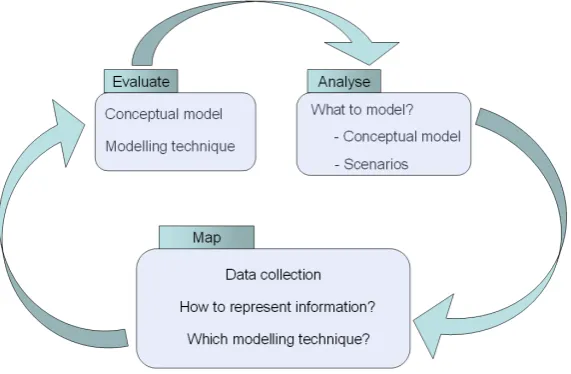
Our methodology, illustrated in Figure 1, proposes three iterative processes: analysis, mapping and
evaluation. The analysis process aims to answer the question “what to model?” and the result of this
analysis could be formulated in a conceptual model and a list of relevant scenarios. The conceptual model
270
should include information about the data that is needed – this is typically informed by the user interface
and by knowledge of the domain. The link to the user interface is important because the needed knowledge
about the user is ‘extracted’ either directly from the user (e.g. they declare their interests) or indirectly
from their usage of the system.
The scenarios specify different situations that are relevant for the adaptation. For example, if the learner
275
gave a wrong answer to a test question, scenarios can be defined for different levels of feedback depending
on previous interaction. For example, if it is the first time the learner provided a wrong answer to that
question, the feedback could inform the learner that the answer is wrong and prompt them to try again. If
the learner had several failed attempts to provide the correct answer, the feedback could provide the correct
answer with an explanation.
280
Figure 1: Processes of the proposed methodology
with user data. To enable this mapping, three aspects need to be addressed. The first one is the availability
of user data, which is related to data collection. This is important especially when user characteristics are
inferred, as the collected data is essential for the inference and it is informed by the current interface of the
system. The other two aspects are knowledge representation and modelling technique. These are decided
285
based on the aim of the modelling technique and they are informed by the conceptual model and user data.
The design and development of the user model component takes place at this stage.
The evaluation process involves the evaluation of the practical use of the conceptual model, the scenarios
and the modelling technique. The conceptual model is generally evaluated in reference to the requirements
of the user model content, while the scenarios refer to adaptation requirements, i.e. in what situation is
290
adaptation needed, and for that to happen, what is the information that the user model needs to have? In
the case of educational systems, the conceptual models and scenarios are often evaluated by experts of the
learning domain. The evaluation of the modelling technique involves testing its performance in terms of
successful diagnosis for each of the scenarios.
The three processes are iterated, with each iteration being related to iterations of system development.
295
This interplay is described in the following subsection.
3.2. Learner model development in relation to system development
The processes mentioned above are influenced by the development of the system in general, and two
components in particular: the user interface and the adaptation module. The design of the user interface
“dictates” the way users can interact with the system and what data can be collected. This has an influence
on user modelling because it is through capturing interactive behaviour that the system collects data about
the user for either direct storage or for inference. Therefore, the user interface plays a key role in user
model development underpinning the design of conceptual models and the choice of modelling techniques,
especially when data-driven approaches are needed. In areas such as adaptive learning systems, expert
knowledge may also be needed to inform the conceptual model about the domain of learning. There are
305
of course several challenges involved relating to the differences among experts, as well as their level of
expertise and perceptions of the domain [78]. For example, an academic-expert/educational researcher may
be concerned to demonstrate theoretical aspects of the domain and characterise the scope and limitations of
the domain theory or of the pedagogical design of the adaptive learning system. In contrast, a
practitioner-expert/teacher may be driven by experiences with learning situations they are dealing with on a daily basis,
310
and could have compiled teaching techniques, scaffoldings, or problem solving techniques that help learner’s
progression in the domain and the accomplishment of the teaching objectives.
The user interface is also linked to another system component, i.e. the adaptation module, which performs
the adaptation based on information from the user model. As the adaptation is provided through the user
interface, the design of the two is interlinked. The adaptation module also plays a role in the definition of
315
scenarios, which in turn, inform the modelling technique development. Similar to the conceptual model, for
adaptive systems where expert knowledge is needed, the decision about scenarios is informed by experts.
These interactions between the user interface, the adaptation module and the processes involved in user
model design and development are displayed in Figure 2. The numbers illustrate the order involved in
the development of the user model. The blue and green arrows show how the reciprocal influence between
320
different components. The dash line block with the expert knowledge and pedagogical design indicates that
this is applicable only for some adaptive systems.
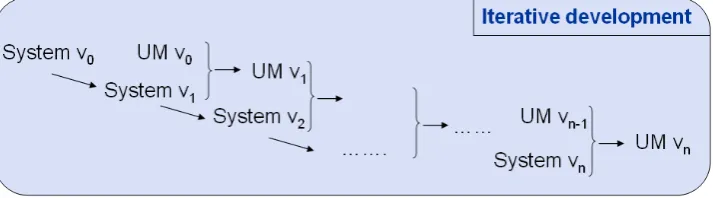
Similarly to the user model, the system is developed in an iterative manner. The interplay between the
iterative development of the system and of the user model module is displayed in Figure 3. The number of
iterations for the user model development depends on the number of iterations for system development. In
325
practice, there is not always a one to one correspondence between the user model and system version. After
the initial development (UM v0), the next user model version may be developed after several iterations of the
system development. This approach gives more stability and provides more time for user model development
which cannot be as easily changed as the user interface for example. Consequently, the number of system
versions will be greater than the number of user model versions. The next section present a case study for
330
Figure 2: Interaction between system components and user model development processes
Figure 3: Iterative development of system and user model module
4. Case study
In this section we illustrate how the above methodology was applied to the user model development of
an intelligent educational system for the domain of mathematical generalisation. The aim of the system
is to provide tasks for 11 to 14 years old pupils in which they need to build a construction and derive an
335
algebraic-like rule, and to provide intelligent support for the pupils while they solve the tasks. The intelligent
support is provided via two components: the user modelling and the adaptation modules.
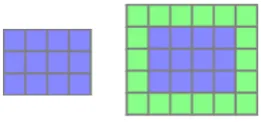
Figure 4 illustrates an example of a task that pupils are asked to solve using the system. Pond-tiling
is a mathematical generalisation problem for which the students are presented with a pond typically of
rectangular form of a certain width (w) and height (h) (see Figure 4) and are asked many tiles are needed
340
to surroundany pond.
The algebraic solution for this problem is that the number of tiles needed to surround any rectangular
pond is 2∗w+ 2∗h+ 4. The challenge from pedagogical point of view is to support learners in developing
Figure 4: Pond tiling problem - pond and surrounded pond.
the activities/tasks undertaken by the student aim to facilitate their transition from building a pattern
345
construction to appreciating the algebraic formula behind it and making it general.
Thus, the system would present such tasks to the learners and would provide affordances that allow the
learners to build constructions and express algebraic rules. Consequently, a user modelling mechanism needs
to enable diagnosis of both aspects.
In the following we present the development of the user model component and its relation to system
350
development. The user model development was done in three iterations. We illustrate here the methodology
for user model development for the first and the last iteration.
4.1. Initial design: learner model v0
We start by presenting the first version of the system, calledShapeBuilder [73, 20], based on which the
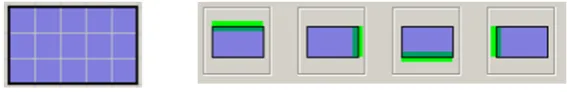
learner model v0 was developed. The user interface of the system is presented in Figure 5 and includes an
355
Expression Toolbar (b), a Shape List (c), and the Expression Palette (d).
The affordances of the system with the information available from the interaction with the interface
are listed in Table 2. ShapeBuilder allows construction of different shapes, e.g. rectangles, L-shapes,
T-shapes, and supports numeric, iconic and symbolic representations. Numeric representations include
numbers (constants or variables) and expressions with numbers;iconic representations correspond to icon
360
variables;symbolic representationsare names or symbols given by users to variables or expressions. An icon
variable has the value of a dimension of a shape (e.g. width, height) and can be obtained by double-clicking
on the corresponding edge of the shape. It is represented as an icon of the shape with the corresponding
edge highlighted - see Figure 6.
Shapes can be linked through icon-variables by defining a dimension of one shape as an expression
365
including an icon variable of another shape. This would lead to both shapes being modified at the same
time when a change occurs in the icon variable.
The Expression Toolbar allows the creation of constants, variables and composite expressions using
addition, subtraction, multiplication and division. These are placed in the Expression Palette and can
be used for defining an expression for the task at hand or to define the properties of the shapes in the
Figure 5: System v0: (a) the overall interface, with the gridded area as interaction canvas; (b) the Expression Toolbar; (c) the ShapeList; (d) the Expression Palette.
Table 2: System affordances and information available.
Affordances Information available
Shape creation Shape type (e.g. rectangle, L-Shape, T-Shape) Shape dimensions, e.g. for rectangle, width and height Shape colour
Shape properties modification New value for dimension or colour
Variable representation Each dimension of a shape can be represented in three forms: numeric, iconic or symbolic
Linking shapes The shapes that are linked and The expression that links them Expression creation The created expression
[image:17.595.154.438.652.698.2]ShapeList. The ShapeList displays the shapes that currently exist on the gridded canvas and allows the
creation of new shapes. Existing shapes can be manipulated on the interaction canvas - they can be moved
and attached to other shapes, and can be resized by either using the mouse or changing their properties in
the ShapeList. When a shape has several copies and the properties of one of them is changed, all copies are
updated appropriately.
375
The properties of shapes in the ShapeList facilitate the derivation of the algebraic-like expression for
the task at hand by providing parts of the final expression which is formed by putting together various
properties of the shapes used in the construction. Constants, variables and numeric expressions lead to
specificconstructions, while icon variables and expressions with icon variables lead togeneralconstructions.
In the following, the development of the learner model is presented in accordance with our methodology
380
for each of the three processes involved.
4.1.1. Analysis
Several sources of information were used in the analysis stage: (a) task knowledge from experts and (b)
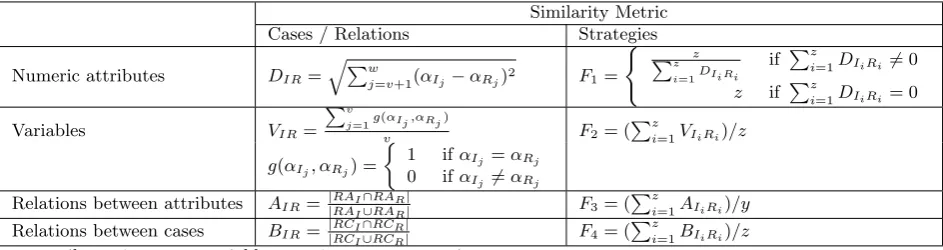
the user interface affordances that allow pupils to solve the tasks in the system.
Generalisation tasks that are typically part of the UK mathematics curriculum and different solutions
385
to these tasks were provided by the experts; these tasks are documented in [44]. To illustrate the different
solutions that pupils could adopt for the same task, the solutions provided by the students (from the
evaluation study detailed in section 4.1.3) for the pond-tiling task introduced earlier are displayed in Figure 7.
Consequently, the information from experts about solutions to several generalisation tasks and the
affor-dances of the system informed the development of the conceptual model for representing solutions for tasks
390
inShapeBuilder. This is presented in Table 3 and contains properties of each part of the construction and
relations between different parts.
Each solution is made of several parts and the relations between the parts are essential in defining an
algebraic-like rule. Therefore, the conceptual model should include the “definitions” of parts, but also the
relations between them. The “definition” of parts is given by their properties. These properties are either
395
defined through the user interface, or can be derived from what is defined through the user interface.
There are three types of relations: (a)value relations, for example the width of componentC2 (top bar)
of the ‘I’ strategy in Figure 7(h) is the width of componentC1(pond) plus 2; (b)dependency relations, when
a dimension type of a component is an icon variable of another component; for example, in the example
above the the width of componentC2 (top bar) is dependent on the width of componentC1 (pond); (c)
400
Figure 7: (a) ‘Area’ strategy; (b) ‘I’ strategy; (c) ‘H’ strategy; (d) ‘Spiral’ strategy; (e) ‘+4’ strategy; (f) ‘−4’ strategy; (g) Steps and relations of ‘Area’ strategy; (h) Steps and relations of ‘I’ strategy.
Table 3: Conceptual model for strategies ofShapeBuider tasks.
Component Properties Possible values Relations
C1 Shape type rectangle/L-Shape etc. Value Relation (VR) 1, VR 2, etc. Shape colour red/ blue/ etc. Dependency Relation (DR) 1, DR2, etc.
Each dimension Order relations: Previous, Next
- type constant (c)/ variable (v)/ icon variable (iv)
numeric expression (ne)/ expression with IV (eiv)
- value numeric
C2 Shape type rectangle/L-Shape etc. VR1, VR2, etc.
Shape colour red/ blue/ etc. DR1, DR2, etc.
Each dimension Previous, Next
- type c/v/iv/ne/eiv
- value numeric
... .... ... ....
Cn Shape type rectangle/L-Shape etc. VR1, VR2, etc.
Shape colour red/ blue/ etc. DR1, DR2, etc.
Each dimension Previous, Next
- type c/v/iv/ne/eiv
[image:19.595.88.512.482.709.2]To illustrate the conceptual model, Table 4 presents how this translates for the ‘I strategy’ of the pond
[image:20.595.109.480.177.523.2]tiling task; see also Figure 7(h).
Table 4:Conceptual model for the ‘I strategy’ of the pond tiling task. Component Properties Possible values Relations
C1 (pond) Shape type rectangle Previous: null
Shape colour blue Next: C2
Width type iv Width value 5 Height type iv Height value 3
C2 (top bar) Shape type rectangle VR1: C2 width=C1 width + 2 Shape colour yellow DR1: C2 width=DEP(C1 width)
Width type eiv Previous: C1
Width value 7 Next: C3
Height type c Height value 1
C3 (bottom bar) Shape type rectangle VR1: C3 width=C1 width + 2 Shape colour yellow DR1: C3 width=DEP(C1 width)
Width type eiv Previous: C2
Width value 7 Next: C4
Height type c Height value 1
C4 (left bar) Shape type rectangle VR1: C4 height=C1 height Shape colour yellow DR1: C4 heigh=DEP(P1 height)
Width type c Previous: C3
Width value 1 Next: C5
Height type eiv Height value 3
C5 (right bar) Shape type rectangle VR1: C5 height=C1 height Shape colour yellow DR1: C5 heigh=DEP(C1 height)
Width type c Previous: C4
Width value 1 Next: null
Height type eiv Height value 3
From previous knowledge about the difficulties learners face with mathematical generalisation, coupled
with knowledge from experts on when support is needed, several scenarios were defined. These scenarios,
405
corresponding to categories of user strategies are given in the first column of Table 5. The second column
provides the pedagogical rational for monitoring the particular strategy category, e.g. providing appropriate
scaffoldings for users that demonstrate a particular behaviour. The third column displays examples of user
constructions that belong to each scenario.
The first scenario, i.e.complete strategies, is important for detecting if the learners display behaviours
410
that demonstrate their ability to generalise. In ShapeBuilder, the constructions can be built in a specific,
Table 5:Scenarios from experts.
Scenarios Pedagogical Rational Example Constructions
Complete strategies Identify whether the learner is working with the specific or the general
Mixed strategies Identify strategies of learners to guide them towards a particular one if they have difficulties to generalise
Non-systematic Guide learners toward a strategies systematic strategy if they have
difficulties to generalise Partial Strategies Guide learners by building on
the strategy they started with should they be stuck or request help
example, for the ‘-4’ strategy in Figure 7(f), the top and bottom rows of tiles need to be linked to the width
of the pond, thus indicating adependency relation between the width of these rows of tiles and the width
of the pond; moreover, the widths of these rows need to be the width of the pond plus 2, thus indicating a
415
value relation between the width of these rows of tiles and the width of the pond. Similarly, the left and
right columns of tiles need to be linked to the height of the pond and have their height equal to the height
of the pond plus 2. If there are no links between the variable parts of a construction, i.e. no dependency
relations, the construction isspecific. If some links are present while others are missing, the construction is
partly general.
420
Knowing if the learner is building a specific, partly general or completely general construction is
peda-gogically important and valuable for providing feedback to the learner, either to confirm that they are doing
well, or to provide support if they are not sure how to proceed.
As noticed in Figure 7, all solution have an element of symmetry and minimal elegance, which facilitates
the process of generalisation because the dependency and value relations are the same for several components
425
of the construction; consequently, the definition of the algebraic-like rule becomes easier. Learners, however,
use a variety of strategies when building their constructions, including combining components from elegant
strategies, i.e. mixed strategies. Because using this approach adds more complexity to the task, detecting
which combinations of strategies the learners are working with enables more personalised feedback in terms
of helping the learners extract a general rule or, if that is too difficult, helping them towards using only one
430
elegant strategy that was already partly used in their construction.
been elegantly constructed. The first non-systematic figure in Table 5 shows an elegant approach for the
left and right columns of tiles, which is missing for the top and bottom rows of tiles; for example, the top
row is built of three bits and pieces: two single tiles and a bar of four tiles. The presence of “bits and
435
pieces” makes it difficult to identify whether there is an elegant strategy that the learner is partly following.
For example, the construction described above has elements of the ‘I’ and ‘+4’ strategies. Detecting this
behaviour, however, is beneficial in terms of identifying learners who try to address the task at hand by
merely reproducing the form of the construction (i.e. surround the pond with tiles) without thinking about
the generality of their approach. In addition, feedback can be targeted to point out to the learners that this
440
approach is not helpful and to provide guidance towards one of the strategies that they already used.
Partial strategies refer to constructions that are not completed; in the case of the pond-tiling task,
this would mean that the pond is not entirely surrounded by tiles, as illustrated in Table 5. Detecting this
type of strategy is important for providing help to the learners should they need it. For example, if a learner
has started to build their construction using a particular strategy, detecting that they are working with
445
that strategy enables more targeted feedback by providing guidance on how to continue with that particular
strategy. This approach is similar to the type of support that teachers would give pupils when that are
partly through a task.
All scenarios aim to provide meaningful feedback to the learner during a task in relation to what they
have already constructed, by identifying specific difficulties that the learners face when building a general
450
construction and deriving an algebraic-rule from it.
4.1.2. Mapping
With the conceptual model and the scenarios defined, the next step is to map them to the user data,
which involves the definition of data collection, knowledge representation and modelling technique.
For data collection, a logging mechanism was used to give us access to user data, which allowed us to
455
test potentially suitable modelling techniques. This was established as a temporary solution for storing user
data (in our case using log files), that would later be changed to a more efficient solution. This approach
enabled us to discuss what was important to capture from user modelling point of view, i.e. the elements in
the conceptual model, and to make sure that the needed data is available.
Based on the conceptual model and the scenarios, we then looked at suitable knowledge representations
460
and modelling mechanisms. The fourth scenario meant that the modelling mechanism should be able to
diagnose the learner based on partial information, i.e. incomplete strategies.
before they complete a task, indicated Case-based Reasoning (CBR) [57] as a potentially good technique
for representation and diagnosis. The knowledge representation is outlined below.
465
A strategy is defined as Si = {Ci, Ri}, where Ci represents a set of cases and Ri represents a set of
relations between cases of Ci. Each case of Ci includes attributes with their corresponding values, as in
columns 2 and 3 of Table 3, which displays the conceptual model. According to their values, there are 2
types of attributes: numeric (values of dimensions) and variables (e.g. shape type, dimension type).
The set of relations Ri is defined as Ri = {RAi, RCi}. RAi is a set of relations between attributes
470
of cases (value and dependency relations) andRCi is a set of relations between cases (order relations). A
strategy is specific when it does not have dependency relations and is general when it has all the dependency
relations required by the task.
In Case-based Reasoning, similarity metrics are used to measure how close the input case is to the stored
ones and to retrieve one or several similar cases from the case-base. In our application, the input case is the
475
construction of the user and the case-base includes the strategies that could be used to solve the task. More
specifically, the similarity metrics compare a learner’s strategy with all the strategies in the case-base. The
aim is to identify the most similar one for the purpose of adaptation and personalisation, as outlined in the
scenarios.
The similarity metrics used are displayed in Table 6. Different metrics were used for the different
480
types of information: Euclidean distance was used for numeric attributes, string matching for variables
[image:23.595.65.537.539.664.2]and Jaccard’s index for relations. The case comparison metrics were aggregated in four metrics to enable
Table 6: Similarity metrics.
Similarity Metric
Cases / Relations Strategies
Numeric attributes DIR=qPw
j=v+1(αIj−αRj)
2 F
1=
( z
Pz i=1DIiRi
if Pz
i=1DIiRi6= 0 z if Pz
i=1DIiRi= 0
Variables VIR=
Pv
j=1g(αIj,αRj)
v F2= (
Pz
i=1VIiRi)/z
g(αIj, αRj) =
1 ifαIj =αRj
0 ifαIj 6=αRj
Relations between attributes AIR= |RAI∩RAR|
|RAI∪RAR| F3= (
Pz
i=1AIiRi)/y
Relations between cases BIR= |RCI∩RCR|
|RCI∪RCR| F4= (
Pz
i=1BIiRi)/z α=attribute; 1 tovare variables;v+ 1 toware numeric
I=Input Strategy; R=Retrieved Strategy z=minimum number of cases in I or R
comparison of strategies, as displayed in the third column of Table 6. The strength of similarity between the
input strategy and the various stored strategies is defined as the combined similarity of these four measures:
Sim=F1 +F2 +F3 +F4.
485
4.1.3. Evaluation
In the following we present outputs of our mechanism for each scenario, using constructions from
class-room trials with pupils solving the pond-tiling task inShapeBuilder. In this evaluation we used data from
10 pupils, where each pupil built one construction. The mechanism used the input from log files and its
output (i.e. most similar strategy or strategies) was checked by one expert against screen videos that were
490
collected for all pupils.
To test the specific and partly general complete constructions, as well as the partial constructions,
snapshots of user’s construction were taken at different point during the task. For example, from the 6
complete strategies, snapshots were taken when the constructions were complete, but with no relations
between their parts to extract specific strategies. Table 7 presents the distribution of the 38 user strategies
495
[image:24.595.178.417.420.504.2]according to the pedagogical scenarios.
Table 7: Distribution of user strategies according to scenarios.
Scenario No of user strategies
Complete General 6
Partly general 6
Specific 6
Mixed 2
Non-systematic 2
Partial 16
The modelling mechanism successfully identified all 38 tested user strategies. The results of this
evalua-tion indicated that the proposed modelling technique is suitable for the purpose of the user model component.
Observations of pupils were used to evaluate the scenarios. First, as outlined above, behaviours belonging
500
to each scenario were observed. Second, we observed that at the very beginning, when the learners are
novices, they build specific constructions and only after having a complete construction they start to think
about how to make it general. Moreover, after building a specific construction, many learners found it
challenging to create the first link between the components of the construction; in addition, some learners
create links between some components, but find it difficult to create links between other components. This
505
behaviour comes under thecomplete strategiesscenario, and these observations provided two valuable sources
constructions and (b) it provided valuable information for the adaptation component in terms of generating
feedback for these different behaviours.
Other observed behaviours associated with the novice state were: (a)mixed strategies, which were adopted
510
because learners did not yet think about generalisation and did not realise the complexities added by this
approach when deriving the algebraic-like rule; we found that no pupil was able to extract a general rule
from a mixed construction; (b)non-systematic strategies, where pupils focused on reproducing the form of
the construction, i.e. a pond completely surrounded by tiles, without thinking about generality.
We also noticed that pupils were unsure how to proceed after building some parts of the construction,
515
and only continued with the task after they were given feedback either to encourage them to continue or
to specifically tell them to do something similar to what they have already done (e.g. when they only built
one top row of tiles, they were given a suggestion to build the bottom row in a similar way). Consequently,
the need for detectingpartial constructions was confirmed.
4.1.4. Learner model v0 relation to system development
520
The analysis process of the learner model development was influenced by experts’ knowledge of the tasks
and the requirements for the adaptation module. The expert’s knowledge of mathematical generalisation
tasks was used in defining the conceptual model, as well as in identifying relevant scenarios that included
requirements for the user model module and the adaptation module. The requirements for the two modules
are interlinked, as the adaptation module needs diagnosis information from the user model. For example,
525
the identification of partial strategies was identified as a scenario, as this would trigger intelligent support
from the adaptation module.
The mapping process was influenced by the user interface of ShapeBuilder in term of data collection,
knowledge representation and modelling technique. As mentioned earlier, the user data collection was done
through log files which were used in the evaluation process. The knowledge representation and modelling
530
technique were influenced by the user interface in terms of defining the set of attributes for cases and finding
appropriate similarity measures for those attributes.
The participatory design of this first version entailed the participation of experts and users in the
devel-opment of the learner model. The experts participated in several ways: (a) they provided information about
535
generalisation tasks and possible solutions, (b) provided information about what is important to identify to
enable intelligent support, i.e. the scenarios, and (c) labeled the solutions of the pupils with the most similar
the pond-tiling task using ShapeBuilder and (b) providing information on what they found conceptually
difficult such as linking shapes, which was used in the validation of the scenarios.
540
4.2. Learner model v2
This section presents the last iterative version of the learner modelling mechanism. There was one
previous version (v1), based on the same system as the one presented for learner model v0, but with
different modifications to the user interface. This previous version is not presented because of its similarity
to the last version, as well as for the brevity of the paper.
545
The modifications in the user modelling mechanism were driven by the evolution of the design of the
learning environment in general, and of the interface in particular.
Although the grid-based structure of the environment did not change, several details of the interaction
design changed, such as using patterns instead of shapes, property lists instead of menus and introducing
“two worlds” in the main screen – a student’s world and a general world. These changes were introduced
550
based on the feedback from pupils and teachers, and are described in more detail in the following. From
user modelling point of view, these changes meant a change in the attributes of cases and an adjustment of
the similarity metrics, which are described in sections 4.2.1 and 4.2.2.
In the following, an overview of the new system is given, outlining the changes fromShapeBuilder. Like
the first version of the system, this version was designed for classroom use and targets pupils of 11 to 14
555
year-olds. Also, each task involves two main phases: constructing a model and deriving an algebraic-like
rule from it. The features of the new version of the system, namedeXpresser [70], have been informed by
studies with pupils and teachers. Several changes took place that are presented below:
1. eXpresser allows the construction of patterns rather than shapes; therefore,eXpresser is more general
thanShapeBuilder in terms of what can be constructed.
560
2. The ShapeList has been removed and property lists have been “attached” to each pattern that enable
their creation and the inspection of their properties.
3. Icon variables are replaced by the so-calledT-boxes; they serve the same purpose as the icon variables,
but are defined to represent any of the properties of a pattern. Unlike icon variables that made a
dependency relation unidirectional, T-boxes define multi-directional relations, i.e. when the variable
565
defined by the T-box changes, the change is reflected in all related properties.
4. Two ‘worlds’ are included in eXpresser – the student’s world where the student builds his/her
displayed. Also, the construction in the general world can be animated to display various instances of
the same construction.
570
5. To enable the animation of patterns, ineXpresser the rules required by the task need to be defined
and at least one dependency relations needs to be in place.
[image:27.595.47.527.108.569.2]6. eXpresser supports collaborative activities, as well as individual ones.
Figure 8 illustrates the system, the property lists of two patterns (linked to another ones through the
use of a T-box) and examples of rules for two instances of the pond-tiling task. The interface includes two
575
windows: (a) the students’ world, where the students build their constructions and (b) the general world
that displays the same construction with a different value for the variable(s) involved in the task (h andw
in this case), and where students can check the generality of their construction by animating their patterns
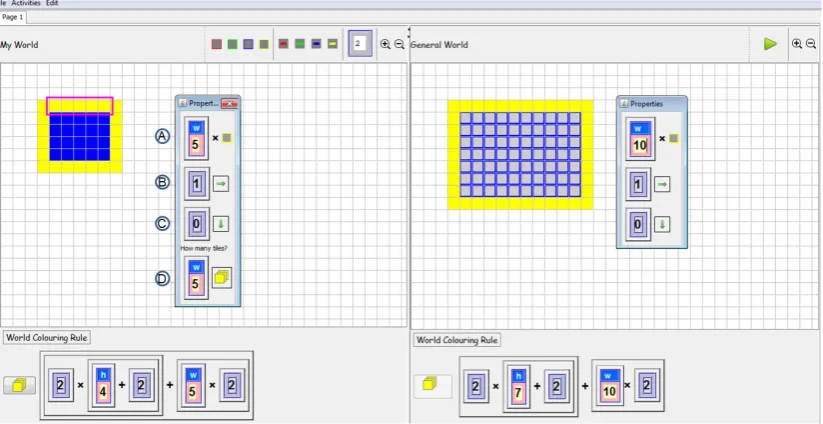
(using the Play button).
Figure 8: The interface ofeXpresser. This screenshot includes the display of the the students’ world and the general world; the student’s construction in the student’s world and a different instance for the same construction in the general world; the property list of the top horizontal bar in both worlds; rules for the number of yellow tiles in both worlds.
We illustrate the affordances of eXpresser using the pond-tiling task previously introduced for
Shape-580
Builder and displayed in the students’ world with a 5 by 4 blue (darker colour) pond and in the general
world with a 10 by 7 pond. Here we illustrate the ‘H’ strategy (also displayed in Figure 7c).
The property list of the top horizontal bar is displayed in both worlds. The first property ( A) specifies
the number of iterations of the building-block, i.e. the basic unit of a pattern, which is displayed as an icon;
the value for this attribute is set to the value of the width of the pond by using a T-box (that includes
[image:27.595.92.504.344.556.2]a name and a value); by using a T-box, the two (or more) properties are made dependent, i.e. when the
value in the T-box changes in one property, it also changes in the other one(s). The next properties are
move-right ( B), which is set to 1, andmove-down( C), which is set to 0. The last property ( D) establishes
the number for colouring all the tiles in the pattern – for this simple pattern the value is the same as the
iterations and is also related to the width of the pond through the use of a T-box. The bottom areas of
590
both worlds displays a rule for the number of yellow tiles: 2∗(h+ 2) +w∗2, wherehand wstand for the
T-boxes used in the property lists of the construction’s components; a T-box can be displayed with name
only, value only or both. In Figure 8, all T-boxes are displayed with both names and values. If the T-boxes
were displayed with names only, the rules in both worlds would be the same, indicating the generality of
the solution.
595
To make a construction general, T-boxes are needed to link the different parts of the construction.
Without these links, a construction is specific, i.e. it is valid only as a particular instance of the task
pattern; a construction can also have some links in place, while others are missing, i.e. the construction is
partly general. This is essentially the same as in ShapeBuilder, except for the replacement of icon variables
with T-boxes.
600
The use of property lists to construct patterns facilitates the derivation of the algebraic-like rule by
the presence of the couloring property which refers to the number of tiles needed for certain parts of the
construction; the rule is essentially formed by putting together the values of the colouring properties of all
parts of a construction.
The following subsections present the last iterative development of the learner model, which is described
605
using the three processes in our proposed methodology: analysis, mapping and evaluation.
4.2.1. Analysis
The analysis in this iteration looked at the changes in the user interface and the implication this changes
had on the conceptual model. As the affordances of the user interface changed, the conceptual model was
updated to reflect the new way of interacting with the system. The updated conceptual model is presented
610
in Table 8. Each pattern has several properties: iterations, move right, move down and couloring.
We illustrate this version of the conceptual model in Table 9 for the ‘H’ strategy of the pond tiling task,
which is displayed in Figure 8. This also illustrates the concept of “patterns of patterns”, where patterns
can be constructed by iterating other patterns.
Observations of pupils’ interaction with the previous version of the system were used to identify if new
615
Table 8: Conceptual model for strategies ofeXpresser tasks.
Component Properties Possible Values Relations
C1 Pattern colour string VR1, VR2, etc.
Each pattern property DR1, DR2, etc.
- type: numeric (n)/ T-box (tb) / Previous, Next numeric expression (ne)/
T-box expression (tbe)
- value numeric
width value numeric
height value numeric
C2 Pattern colour string VR1, VR2, etc.
Each pattern property DR1, DR2, etc.
- type: n/tb/ne/tbe Previous, Next
- value numeric
width value numeric
height value numeric
... .... .... ....
Cn Pattern colour string VR1, VR2, etc.
Each pattern property DR1, DR2, etc.
- type: n/tb/ne/tbe Previous, Next
- value numeric
width value numeric
height value numeric
already covered in the existing scenarios. Consequently, the scenarios stayed the same as for the previous
versions.
4.2.2. Mapping
The mapping process included the revision of data collection, knowledge representation and modelling
620
mechanism. All these changed to reflect the new way pupils interact with the system, i.e. by building
patterns instead of shapes. Consequently, all user data that was needed for the conceptual model was stored
in this version in a database of user actions.
Two parts of the knowledge representation were updated: the set of attributes and the dependency
relations. The set of attributes was updated to reflect the properties of patterns (i.e. iterations, move right,
625
move down, coulouring, width and height). The change in the dependency relation is that the relation is
reciprocal, while in the previous version the relation was unidirectional (from the dependent part to the
independent one). As these are relatively minor changes, the full knowledge representation is not included
in this section.
The changes in the knowledge representation triggered changes in the modelling mechanism, and more
630
Table 9: Conceptual model for the ‘H strategy’ of the pond tiling task ineXpresser.
Pattern Properties Possible values Relations
Pond Made of 2 patterns (P0 and P1)
P0 Iterations type tb VR1: P0 colouring=P0 iterations
Iterations value 3 DR1: P0 colouring=DEP(P0 iterations)
Move right type n Previous: null
Move right value 0 Next: P1
Move down type n Move down value 1 Colouring type tbe Colouring value 3
Colour blue
Width 1
Height 3
P1 Iterations type tb VR1: P1 colouring=P0 iterations*P1 iterations
Iterations value 4 DR1: P1 colouring=DEP(P0 iterations)
Move right type n DR2: P1 colouring=DEP(P1 iterations)
Move right value 1 Previous: P0
Move down type n Next: P2
Move down value 0 Colouring type tbe Colouring value 12
Width 4
Height 3
P2 (top bar) Iterations type tbe VR1: P2 iterations=P1 iterations
Iterations value 4 VR1: P2 colouring=P1 iterations
Move right type n DR1: P2 iterations=DEP(P1 iterations)
Move right value 1 DR2: P2 colouring=DEP(P1 iterations)
Move down type n Previous: P1
Move down value 0 Next: P3
Colouring type tbe Colouring value 4
Colour yellow
Width 4
Height 1
P3 (bottom bar) Properties types and values as in P2 above VRs and DRs - same as P2 Previous: P2
Next: P4
P4 (left bar) Iteration type tbe VR1: P4 iterations=P0 iterations + 2
Iterations value 5 VR1: P4 colouring=P0 iterations + 2
Move right type n DR1: P4 iterations=DEP(P0 iterations)
Move right value 0 DR2: P4 colouring=DEP(P0 iterations)
Move down type n Previous: P3
Move down value 1 Next: P5
Colouring type tbe Colouring value 5
Colour yellow
Width 1
Height 5
P5 (right bar) Properties types and values as in P4 above VRs and DRs - same as P4 Previous: P4
same,F1was normalised and the way the four metrics were combined changed. This was due to the change
in attributes and how they reflected the structure of a construction. To have a better control over the
metrics that influenced the structural similarity, we applied normalisation to theF1metric and used weights
to emphasize the metrics that reflect the structural similarity.
635
As the metric for the numeric attributes (F1) has a different range from the other two similarity metrics,
normalisation was applied to have a common measurement scale, i.e. [0,1]. This was done using linear
scaling to unit range [2] by applying the following function: x= xu−−ll, wherexis the value to be normalised,
l is the lower bound anduis the upper bound for that particular value. Consequently, as the range ofF1
is [0, z], the normalisation function is: F1=F1/z.
640
As the structure of the construction is the central aspect that allows identification of strategies, weights
were applied to emphasize this aspect. The structure is reflected mostly by the F1 metric, and to a lesser
degree, by theF3 metric. Consequently, the similarity between strategies was calculated asSim= 6∗F1+
F2+ 2∗F3+F4.
4.2.3. Evaluation
645
The modified modelling mechanism was evaluated on unseen user data for each of the scenarios. Data
was collected from 36 pupils from classroom use ofeXpresser to solve a task called stepping-stones [21]. In
addition, data was collected from 19 pupils working witheXpresser on the pond-tiling task. To increase
the data available for testing for partly general constructions and partial constructions, the user data from
general/specific constructions was used to extract intermediate steps from the final constructions, i.e. extract
650
[image:31.595.176.418.545.625.2]the constructions at earlier stages. The distribution of the user strategies by scenario is displayed in Table 10.
Table 10: Distribution of user strategies according to scenarios.
Scenario No of user strategies
Complete General 9
Partly general 5
Specific 15
Mixed 10
Non-systematic 10
Partial 67
For the first three scenarios, the modelling mechanism successfully identified all user strategies. For the
last scenario, we have tested partial strategies with 2 and 3 components. Out of the 67 partial strategies, 40
had 2 components and 27 had 3 components. We calculated the probability of identifying the user strategies
from these partial constructions and found the following results: (1) 89% probability of correctly identifying
655