Application of Response Surface Methodology for
Optimization of Fluoride Removal Mechanism by Newely
Developed Biomaterial
Ria Bhaumik, Naba Kumar Mondal*, Soumya Chattoraj, Jayanta Kumar Datta
Department of Environmental Science, The University of Burdwan, Burdwan, India Email: *[email protected]
Received May 17, 2013; revised June 17, 2013; accepted July 15, 2013
Copyright © 2013 Ria Bhaumik et al. This is an open access article distributed under the Creative Commons Attribution License, which permits unrestricted use, distribution, and reproduction in any medium, provided the original work is properly cited.
ABSTRACT
The adsorption capacities of new biomaterials derived from lemon leaf (Citrus sp.) toward fluoride ions have been ex-plored by varying different physicochemical parameters such as pH, initial concentration, adsorbent dose, contact time, stirring rate and temperature. The entire study was done through batch process. Maximum fluoride adsorption of 96.9% - 98.8% was achieved with an initial concentration of 10 mg/L. Langmuir isotherm model well expressed fluoride ad- sorption onto LLD-1, LLD-2 and LLD-3. According to correlation coefficient, the fluoride adsorption onto these 3 ad- sorbents was correlated well with pseudo-second-order kinetic model. From thermodynamic study, the spontaneous nature and feasibility of the adsorption process with negative enthalpy (∆H0) value also supported the exothermic nature
were shown. The rate of fluoride adsorption was mathematically described as a function of experimental parameters and was modeled through Box-Behnken (Response surface methodology). The results showed that the responses of fluoride adsorption were significantly affected by the quadratic term of pH, initial concentration, contact time and temperature and the statistical analysis was performed by ANOVA which indicated good correlation of experimental parameters.
Keywords: Lemon Leaf; Fluoride; Adsorption; Langmuir Isotherm; Pseudo-Second-Order Kinetic Model;
Thermodynamic Study; Response Surface Methodology
1. Introduction
Fluorine is one of the strong electronegative elements and its gaseous form is tremendous powerful oxidizing agent. It exists in underground water as fluoride ion (F−).
However, natural abundance of fluorine ranges from 0.06% to 0.09% by weight in the earth crust [1].
Fluoride is mainly toxic to the human body when it exceeds the threshold limit of 1.5 mg/L [2]. The excess intake of fluoride may cause fluorosis (dental and skele-tal), neurological damage [3] decreasing growth and in-telligence [4]. There is a tremendous demand for for re-moval of fluoride from drinking water. In recent years, various plant materials like coconut shell [4], bone char, [5] tamarind seed, neem and kikar leaves [6], Barmuda grass [7] neem charcoal [8], Moringa oleifera seed [9] have also been used as adsorbents for defluoridation. There is a gap in knowledge about the carbonized and chemically treated forms. But classical batch adsorption technique is unable to provide fine optimization. To
overcome such a problem by taking the help of comput- erize optimization process called Response Surface Methodology (RSM), in this study lemon leaf was cho- sen for fluoride adsorption as dried powder (LLD-1), carbonized form (LLD-2) and chemically treated (LLD-3) together to establish new adsorbents for defluoridation. Due to carbonization high specific surface area occurred in the adsorbent and due to chemical treatment, more binding sites appear which are responsible for more fluo-ride adsorption than naturally occurring materials.
It is well known that consumption of lemon leaf is one of the most common fruit grown mainly in all tropical countries, including India. In fresh samples, high levels of calcium occur in the vacuoles and especially the inner tangenital walls of epidermal and sub-epidermal cells near the gap of the abscission zone. Calcium containing crystals (calcium oxalate) is also abundant in vacuoles of the cortex parenchyma and leaf blade sides [10]. In 2004, Storey and Leig explained citrus leaves accumulate large amounts of calcium in palisade, spongy mesophyll and crystal containing idioblast cells.
tionship between a set of controllable experimental fac- tors and observed results. RSM consists of 3 major steps: performing statistically designed experiments, estimating the coefficients in a mathematical model and predicting the response and checking the adequacy of the model. RSM can avoid the limitations of conventional methods and is commonly used in many fields [12]. In this study a class of three level complete factorial designs (Box- Behnken model) was used to determine the show and the effects of major operating variables on fluoride adsorp-tion and to find the combinaadsorp-tion of variables resulting in maximum fluoride adsorption efficiency. This design was applied using Design Expert Software 7.0 with six vari-ables at 3 levels. Four different parameters such as initial fluoride concentration, pH, contact time and temperature were selected as the critical variables. A total of 17 ex- periments have been employed in this work to estimate the effects of the six main independent variables on fluo- ride adsorption efficiency.
This present study searches new technology involving the removal of fluoride from contaminated water due to adsorption based on binding capacities of calcium (with fluoride) presented in lemon leaf. The major advantages of this study fluoride adsorption by lemon leaf powder, activated carbon and chemically treated lemon leaf pow- der also include low cost, high efficiency and minimize- tion of fluoride contaminated water.
2. Adsorbents Development
The adsorbent material named as lemon leaves were ob-tained from University farm and were washed with dou-ble distilled water in the laboratory. Then the leaves were dried at 50˚C for 24 h. One-third leaves were cut and grinded well by using mortar and pestle and then sieved to obtain the desired size fractions (250 µm) and used as adsorbent LLD-1. Another 1/3 rd dried leaves are acti-vated with 1% HCHO solution and then again dried in oven maintained temperature range of 120˚C - 140˚C for a period of 12 hrs. After that the ash material were ground and sieved [6] and used as adsorbent LLD-2. And the remaining part of leaves were treated with Ca+2
solu-tion extracted from eggshell (LLD-3) [13] and used as adsorbent.
3. Fluoride Adsorption Experiments
The defluoridation studies were conducted for the opti-mization of various experimental conditions like pH, initial concentration, adsorbent dose, contact time, stir-ring rate and temperature through batch process. The adsorption isotherm, kinetics and thermodynamic study were also done in this study. All the experiments were
selective) by use of TISAB II solution to maintain pH 5 - 5.5.
The amount of fluoride adsorbed per unit adsorbent (mg fluoride/g adsorbent) was calculated according to a mass balance on the fluoride concentration using Equa- tion (1):
i e
e
C C xV
q
m
(1)
The percent removal (%) of fluoride was calculated using the following equation
Removal(%) i e 100
e
C C
x C
(2)
4. Results and Discussions
4.1. Characterization of the Adsorbents
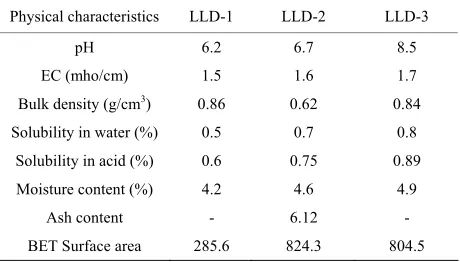
Physico-chemical characterizations of the adsorbents were shown in Table 1 and these characterizations were
done by using standard methods.
From Table 1 comparing the important characteristics
[image:2.595.309.539.605.736.2]of LLD-1, LLD-2 and LLD-3, the carbon content of LLD-2 was higher than others due to increasing in the ash content.
Table 1 shows that LLD-3 and LLD-2 have the higher
surface area and total pore volume than LLD-1 indicating the roughness of pore walls and increasing of additional active sites. Then more active sites are responsible for adsorption of fluoride ions onto the surface of the LLD-3 and LLD-2 than LLD-1.
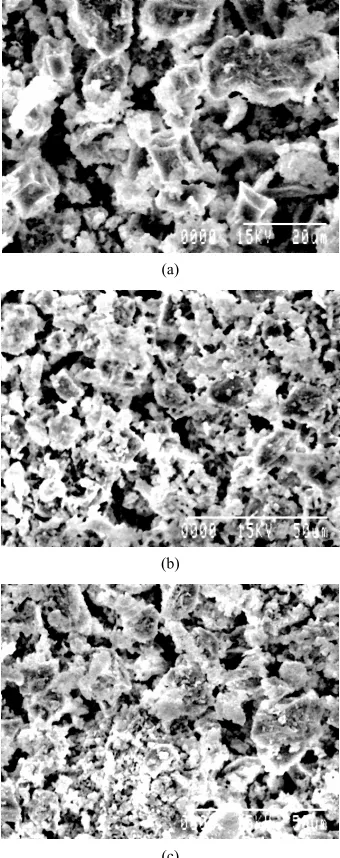
Scanning electron microscopy (SEM) (Figure 1) helps
to explain the surface structure of the powder consisting of the fine particles of irregular shape and size on exter-nal surface. Figure 1(c) shows SEM images of LLD-3
having particle size of 250 µm, where some deposits of calcium were observed only in the sample by modifica- tion of lemon leaf pure dust (LLD-1) (Figure 1).
Table 1. Physico-chemical Characteristics of LLD-1, LLD-2, LLD-3.
Physical characteristics LLD-1 LLD-2 LLD-3
pH 6.2 6.7 8.5
EC (mho/cm) 1.5 1.6 1.7
Bulk density (g/cm3) 0.86 0.62 0.84
Solubility in water (%) 0.5 0.7 0.8 Solubility in acid (%) 0.6 0.75 0.89
Moisture content (%) 4.2 4.6 4.9
Ash content - 6.12 -
(a)
(b)
[image:3.595.87.257.85.514.2](c)
Figure 1. Scanning Electron Microscopy (SEM) images of LLD-1 (a), LLD-2 (b), LLD-3 (c).
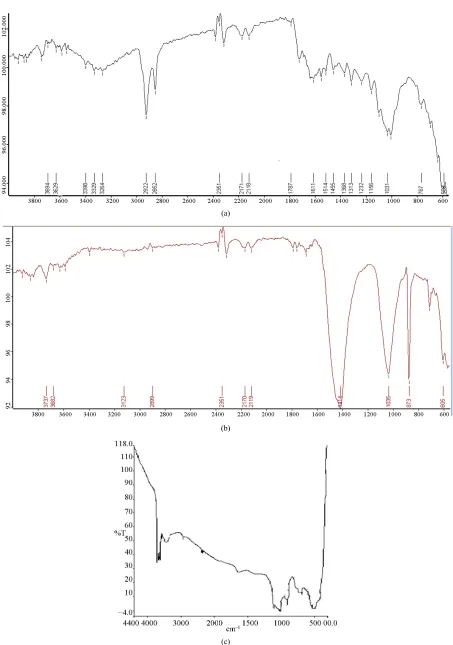
FTIR measurements (Figure 2) of LLD-1, LLD-2 and
LLD-3 showed the presence of peaks 589 - 607 cm−1 are due to P-O bending vibration, 882 - 1098 cm−1 are due to P-O stretching vibration. The inferred peaks at 2918 - 3628 cm−1 are due to adsorption water. An adsorption bands are shown at 691 - 696 cm−1 and at 3571 - 3694 cm−1 which are attributed to the OH groups.
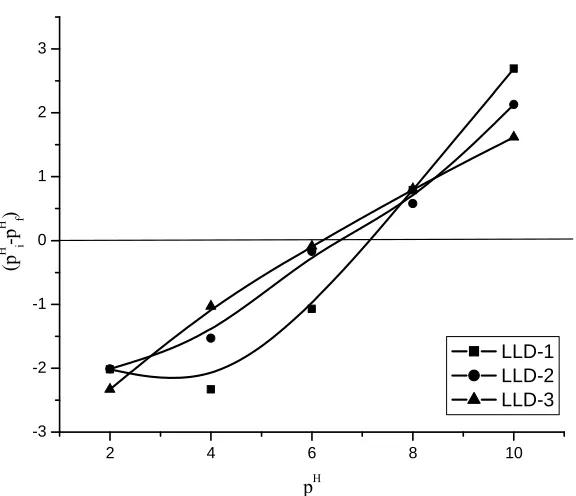
Zero point charge (pHZPC) of 3 adsorbents (LLD-1,
LLD-2 and LLD-3) was measured by the solid addition method [14]. Changes in final pH from initial pH indi-cate the adsorptive process through dissociation of func-tional groups as the active sites on the surface of adsorb-ents. Figure 3 shows the point of zero charge of LLD-1,
LLD-2 and LLD-3 7.0, 6.5 and 6.2 respectively. At low pH, the surface of the adsorbent is positive and reaction
predominates and at higher pH the surface of adsorbent is negative. Here, the pH of the fluoride solution becomes lower than point charge, the association of fluoride ions with the adsorbent surface easily takes place and this study the surface of LLD-3 is more effective than LLD-2 and LLD-1.
4.2. Effect of pH
The pH of the fluoride solution varied from 2 to 10 and the pH was adjusted by adding 0.1 (N) NaOH and 0.1 (N) HNO3 soultion. Figures 4(a) and (b) show that both ad-
sorption and fluoride uptake capacity are maximum at pH 6.0. Here, it is also shown that fluoride ions are more attached to the surface of LLD-3 due to chemically treated with Ca+2 solution (extracted from eggshell) at pH
lower than pH zpc. pH played a vital role in fluoride ad-sorption onto biosorbent [15]. However, many research-ers [16,17] reported that biosorption of fluoride depends on the functional groups on the adsorbent and their ionic states. There are several studies concluded that biomass based biosorbent have several functional groups (such as amines, carbaryl, thiol, sulfhydryl, alcohol, phenol and phosphate groups) [18,19]. Study results reveled that highest fluoride adsorption occur at acidic pH (6.0) for all adsorbents. These sorption characteristics could be attributed to the ionic sorption with cationic (H+) ad-
sorbent surface [17]. Under acidic condition the surface of the adsorbent transformed to a positively charged which facilitated the sorption of fluoride ion through anion exchange [18]. However, the percentage of fluo- ride removal inhibited at higher pH, this might be attrib- uted to the increase of hydroxyl ions leading to formation of aqua complexes.
4.3. Effect of Initial Concentration and Adsorption Isotherm Models
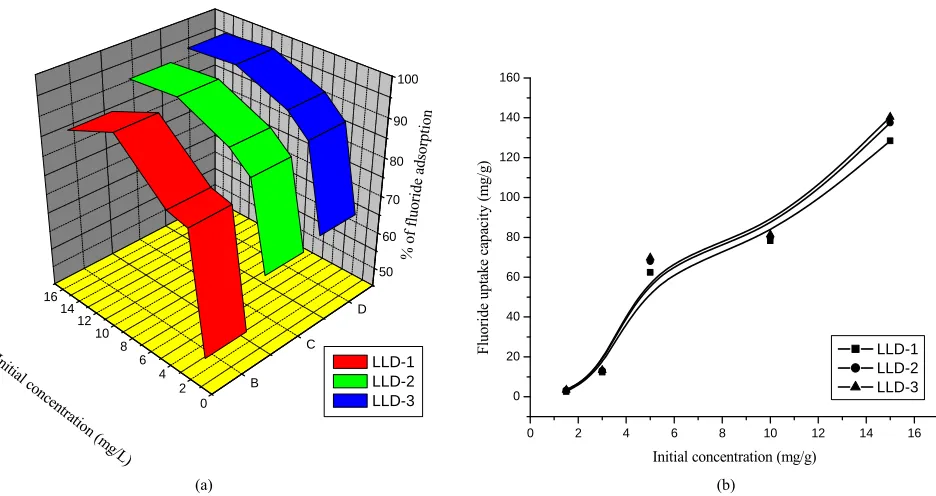
In the batch adsorption study after selection of pH the initial concentration (1.5, 3.0, 5.0, 10.0, 15.0 mg/L) is varied. Adsorption of fluoride (Figures 5(a) and (b))
increases up to initial concentration 10.0 mg/L (for all the three adsorbents) whereas at higher concentration adsorption is decreased. Lower concentration causes more interaction of fluoride ions with the binding sites and at higher concentration increase in the number of ions are responsible for competition in availability of binding sites in the adsorbent surface [20].
Moreover as the total available adsorption sites were limited, they became saturated at a higher concentration [14]. Similar trend has been reported for fluoride removal by using neem charcoal and eggshell dust [21,22]. The results of Figure 5 demonstrate that the amount of
(a)
(b)
[image:4.595.72.525.74.719.2](c)
2 4 6 8 10 -3
-2 -1 0 1 2 3
(p
H -p i H ) f
pH
[image:5.595.155.443.79.327.2]LLD-1 LLD-2 LLD-3
Figure 3. Zero point charge curve of LLD-1, LLD-2 and LLD-3.
2 4 6 8 10
0 20
40 60
80 100
B C
D
LLD-1 LLD-2 LLD-3
% o f fl
u ori de ad
s orp ito n
pH
2 4 6 8 10
60 62 64 66 68 70 72 74 76 78 80 82
Fl
uo
ri
de up
ta
ke
cap
aci
ty
(m
g/
g)
pH
LLD-1 LLD-2 LLD-3
(a) (b)
Figure 4. (a) Effect of pH on % of fluoride adsorption. (Initial fluoride concentration of 10 ppm; adsorbent dose 0.05 g/L of solution; contact time of 60 min, stirring rate 550 rpm, temperature 303 K). (b) Effect of pH on fluoride uptake capacity. (Ini-tial fluoride concentration of 10 ppm; adsorbent dose 0.05 g/L of solution; contact time of 60 min, stirring rate 550 rpm, tem-perature 303 K).
concentration is the main driving force behind overcom-ing all mass transfer resistance of the fluoride, between the aqueous and solid phases [18]. This phenomena lead to increase the equilibrium sorption, until whole adsorb-ent saturation was achieved [14]. In fluoride adsorption isotherm study the equilibrium data isotherm analysis onto LLD-1, LLD-2 and LLD-3 at pH 6.0 and 303 K temperature were analyzed using Langmuir, Freundlich,
D-R and Tempkin isotherms. The isotherm parameters with their linear form are listed in Table 2. The
maxi-mum adsorption capacity of fluoride (qmax, from Lang-muir model) onto LLD-3 surface is higher (38.46 mg/g) than LLD-2 and LLD-1 which correspond to complete monolayer coverage. The value of RL is also more in
[image:5.595.67.538.356.580.2]0 2 4 6 8 10 12 14 16
50 60 70
80 90
100
B C
D
LLD-1 LLD-2 LLD-3
% of fluor
ide ads orpt
ion
Initial co ncen
tration (
mg/L)
0 2 4 6 8 10 12 14 16
0 20 40 60 80 100 120 140 160
Fluori
de
uptak
e
ca
pa
cit
y (m
g/
g)
Initial concentration (mg/g)
LLD-1 LLD-2 LLD-3
(a) (b)
[image:6.595.65.533.83.331.2]Figure 5. (a) Effect of initial concentration on % of fluoride adsorption (pH 6.0; adsorbent dose 0.05 g/L of solution; contact time of 60 min, stirring rate 550 rpm, temperature 303 K). (b) Effect of initial concentration on fluoride uptake capacity. (pH 6.0; adsorbent dose 0.05 g/L of solution; contact time of 60 min, stirring rate 550 rpm, temperature 303 K).
Table 2. Parameters of isotherm models of fluoride adsorption onto LLD-1, LLD-2 and LLD-3.
Isotherm models LLD-1 LLD-2 LLD-3
KL = 0.072 KL = 0.204 KL = 0.083
RL = 0.93 RL = 0.83 RL = 0.92
qm = 7.63 qm = 27.03 qm = 38.46
Langmuir
R2 = 0.84 R2 = 0.98 R2 = 0.99
Kf = 0.45 Kf = 0.035 Kf = 0.036
n = 1.72 n = 6.06 n = 6.53
Freundlich
R2 = 0.73 R2 = 0.96 R2 = 0.96
qmax = 42.5 qmax = 27.41 qmax = 27.03
KDR = 0.123 KDR = 0.01 KDR = 0.007
ES = 2.85 ES = 10 ES = 11.95
D-R
R2 = 0.94 R2 = 0.92 R2 = 0.92
B1 = 5.18 B1 = 5.44 B1 = 4.79
KT = 9.43 KT = 1.71 KT = 1.81
Tempkin
R2 = 0.76 R2 = 0.89 R2 = 0.89
and LLD-3, which also indicates both (6.06 and 6.53 respectively) adsorbents are more effective in fluoride adsorption process than LLD-1. The maximum adsorpi-ton capacity (qmax) obtained from D-R isotherm of LLD-1, LLD-2 and LLD-3 are 4.25, 27.41, 27.03 respectively lower than the value of adsorption capacity obtained from Langmuir isotherm. D-R isotherm gives β constant, and idea about the mean free energy (Es, kJ·mol−1) of
[image:6.595.58.537.393.630.2]adsorbate when it is transferred to the surface of the solid from infinity in the solution. The Es value of LLD-1, LLD-2 and LLD-3 are 2.85, 10 and 11.95 directing the physical adsorption mechanism of fluoride onto these adsorbents [22]. Tempkin isotherm constant are shown in
Table 2. From the isotherm analysis, it is clear that
therm model which suggests uniform binding energy on the whole surface of the adsorbents. These results also signify that fluoride ions were adsorbed by a monolayer formation.
4.4. Effect of Adsorbent Dose
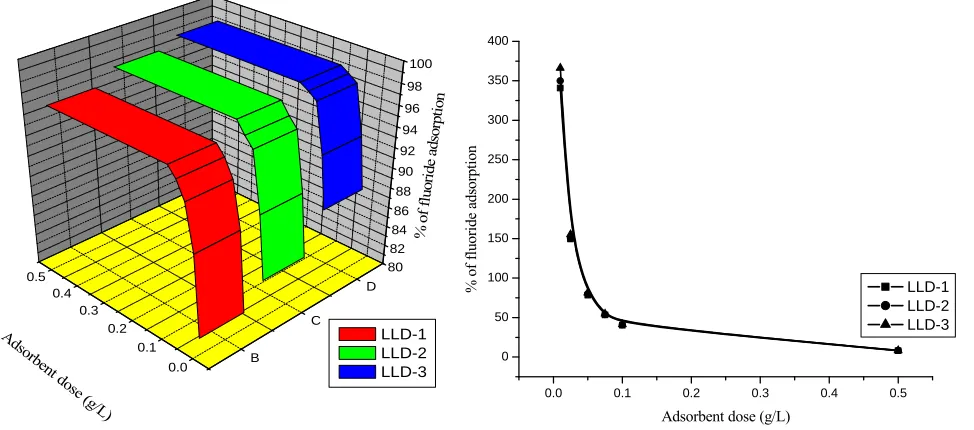
At lower adsorbent dose, Figure 6(a) shows in case of
LLD-1, LLd-2 and LLD-3 percentage of fluoride adsorp-tion is low but fluoride uptake capacity is high (Figure 6(b)). The B-Sp line as flat suggesting the highest
fluo-ride adsorption occurs at 0.1 g/L and the followings re-mains constant. This is probably due to the overlapping of active sites at higher dosage and subsequently reduc-ing the net surface area [23].
4.5. Effect of Contact Time
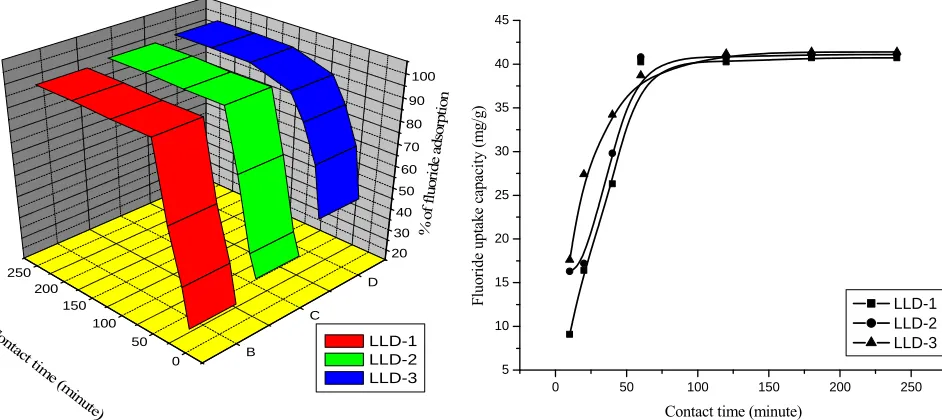
Figures 7(a) and (b) indicate the variations of fluoride
adsorption by LLD-1, LLd-2 and LLD-3 adsorbents with respect to contact time. It has been revealed form this study that percentage of fluoride adsorption and adsorp-tion capacity both increased due to increasing of contact time and the curve gets equilibrium after 120 minutes. The removal efficiency of fluoride was increased which in-creasing time is probably due to participation of specific functional groups and active surface sites on adsorbents surfaces [17,24]. Similar findings were also reported by [24] for fluoride removal on biomass of Spirogyra sp. However, removal decreased after 120 minutes indicat- ing the possible monolayer of fluoride ions on the outer surface, pores of both the adsorbents and pore diffusion onto inner surface of adsorbent particles [14].
4.6. Effect of Stirring Rate
The stirring rate in adsorption study is an essential pa-rameter which can enhance a certain turbulance insuring a good contact between the adsorbate and adsorbent [24]. To determine the effect of stirring rate 250 rpm to 850 rpm speeds were chosen. Figures 8(a) and (b) show
fluoride adsorption occurred rapidly in the first stirring rate from 250 rpm and at 550 rpm the fluoride adsorption rate and uptake capacity both are highest. Then beyond 550 rpm both remain more or less constant in case of these adsorbents due to higher speeds better contact be-tween the fluoride ions and adsorbent surface is possible. In this study at 550 rpm, LLD-3 shows better fluoride adsorption rate (98.8%) and uptake capacity (41.4 mg/g) than other.
4.7. Effect of Temperature and Thermodynamic Study
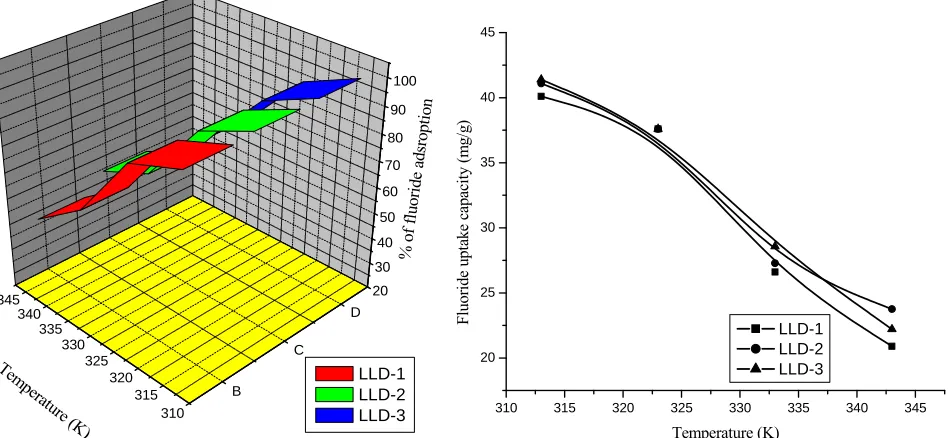
The influence of temperature in adsorption process is very important because increasing the temperature in-duces a decrease in the adsorption capacity of fluoride on the adsorbent surface. Figures 9(a) and (b) shows re-
ducing percentage of both fluoride adsorption and adsorp- tion capacity due to increase of temperature beyond 313 K to 333 K. From Table 3 the values of ΔG0 (Gibbs free
energy of adsorption, kJ·mol−1) at different temperatures,
indicates the feasibility of the process and the spontane-ous nature of fluoride ions onto adsorbents [22]. In case of tested adsorbents, during values of ΔG0 due to
in-creasing temperatures suggests the lower temperature makes the adsorption easier [22]. The value of ΔH0
0.0 0.1 0.2 0.3 0.4
0.5 80
82 84 86 88 90 92
94 96 98 100
B C
D
LLD-1 LLD-2 LLD-3
% o f fluo ride
ads orpt ion
Adsorb
ent dose
(g/L) 0.0 0.1 0.2 0.3 0.4 0.5
0 50 100 150 200 250 300 350 400
%
o
f fl
uo
ri
de adsorpt
io
n
Adsorbent dose (g/L)
LLD-1 LLD-2 LLD-3
[image:7.595.58.545.485.700.2]0 50 100 150 200 250 20 30 40 50 60 70 80 90 100 B C D LLD-1 LLD-2 LLD-3
% o f fluo
ride ads orpt ion
Con
tact tim
e (m inu
te)
0 50 100 150 200 250
5 10 15 20 25 30 35 40 Fl uo ride up tak e c ap ac ity (m g/ g)
Contact time (minute)
LLD-1 LLD-2 LLD-3
Figure 7. (a) Effect of contact time (minute) on % of fluoride adsorption. (Initial fluoride concentration of 10 ppm; pH 6.0; adsorbent dose 0.1 g/L; stirring rate 550 rpm, temperature 303 K). (b) Effect of contact time (minute) on fluoride uptake ca-pacity. (Initial fluoride concentration of 10 ppm; pH 6.0; adsorbent dose 0.1 g/L; stirring rate 120 rpm, temperature 303 K).
200 300 400 500 600 700 800 900 40 50 60 70 80 90 100 B C D LLD-1 LLD-2 LLD-3
% o f fluo
ride ads orpi ton
Stirring
rate (rp
m) 200 300 400 500 600 700 800 900
15 20 25 30 35 40 Fl uo ri de up ta ke cap ac ity ( m g/ g)
Stirring rate (rpm)
LLD-1 LLD-2 LLD-3
Figure 8. (a) Effect of stirring rate (rpm) on % of fluoride adsorption (Initial fluoride concentration of 10 ppm; pH 6.0; ad-sorbent dose 0.1 g/L; contact time 180 min; temperature 303 K). (b) Effect of stirring rate (rpm) on fluoride uptake capacity. (Initial fluoride concentration of 10 ppm; pH 6.0; adsorbent dose 0.1 g/L; contact time 180 min; temperature 303 K).
(enthalpy change of adsorption, kJ·mol−1) and ΔS0
(en-tropy change of adsorption, kJ·mol−1) are also shown in
Table 3, which indicate fluoride adsorption process onto
LLD-1, LLD-2 and LLD-3 are explained by the exo-thermic in nature and the negative values of ΔS0 indicate
that during the fluoride adsorption the solid-solution in- terface researches a more organized structure (decrease of randomness).
4.8. Adsorption Kinetics Study
The experimental parameters (pH, initial concentration,
adsorbent dose, contact time, stirring rate and tempera-ture) are responsible for their potential impact on per-centage of fluoride adsorption and uptake capacity. These parameters also greatly influence on the external surface available for fluoride ion binding, diffusion properties and concentration gradient. Table 4 shows the
values of pseudo-first, pseudo-second order kinetic con- stants and intraparticle diffusion model. Comparing these models, the fluoride adsorption is well fitted to the pseudo-second order kinetic model and the adsorption rate (h, mg·g−1·min−1) was calculated shown in
[image:8.595.63.534.87.297.2] [image:8.595.62.537.351.556.2]310 315 320 325 330 335 340
345 20
30 40 50 60 70 80 90 100
B C
D
LLD-1 LLD-2 LLD-3
% o f fluo
ride ads
ropt ion
Tem pera
ture (K )
310 315 320 325 330 335 340 345 20
25 30 35 40 45
Fl
uori
de u
pt
ak
e cap
aci
ty
(m
g/
g)
Temperature (K)
LLD-1 LLD-2 LLD-3
[image:9.595.64.538.92.311.2]Figure 9. (a) Effect of temperature (K) on % of fluoride adsorption. (Initial fluoride concentration of 10 ppm; pH 6.0; ad-sorbent dose 0.1 g/L; contact time 180 min; stirring rate 650 rpm). (b) Effect of temperature (K) on fluoride uptake capacity. (Initial fluoride concentration of 10 ppm; pH 6.0; adsorbent dose 0.1 g/L; contact time 180 min; stirring rate 650 rpm).
Table 3. Thermodynamic parameters of fluoride adsorption onto LLD-1, LLD-2 and LLD-3.
Thermodynamic parameters Temperature (K) LLD-1 LLD-2 LLD-3
303 −7.792 −9.321 −10.01
313 −5.332 −6.191 −6.41
323 −2.872 −3.061 −2.81
∆G0
333 −0.412 −0.069 −0.79
∆H0 −82.33 −104.16 −119.09
∆S0 −0.246 −0.313 −0.36
The value of h is high in LLD-3, LLD-2 and LLD-1 re-spectively which indicates all tested adsorbents are effec-tive in fluoride adsorption.
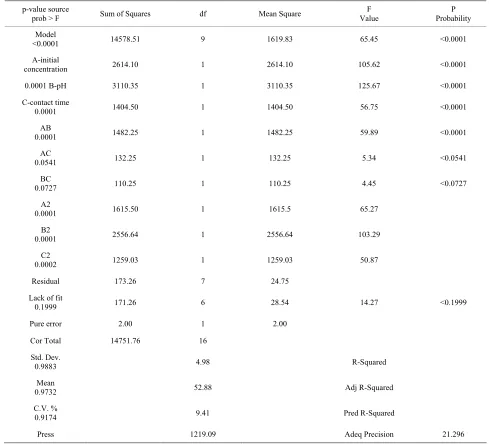
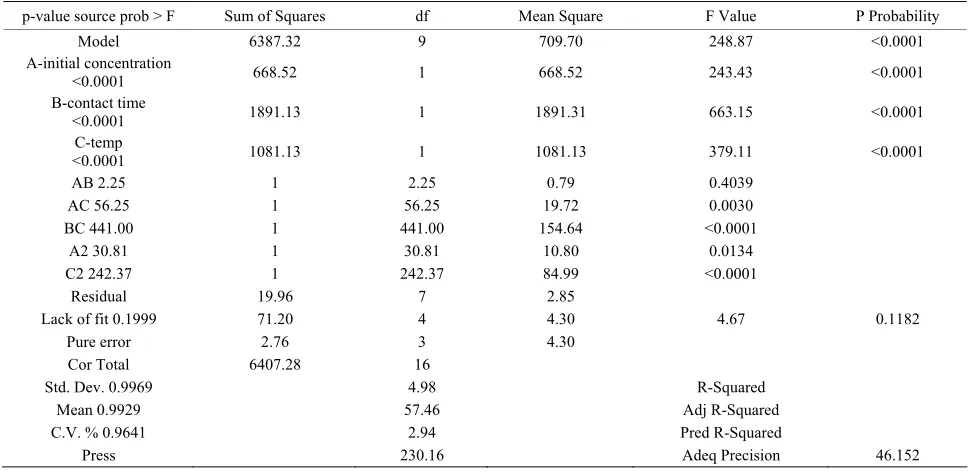
4.9. Box-Behnken Statistical Analysis
In the present study, Box Behnken design was used to predict the fluoride adsorption rate. The complete design model was composed of 17 experimental runs with three replicates at the center points. The significant of the model was justified by the ANOVA. The ANOVA of fluoride adsorption rate is given in Tables 5-7. The
model F-value is the ratio of mean square for the indi-vidual term to the mean square for the residual. The Prob > F value is the probability of F-statistics value and is used to test the null hypothesis. The parameters having an F-statistics probability value less than 0.05 are said to be significant. The pH of the solution, adsorbent dose, contact time, initial fluoride concentration, stirring rate and temperature are very effective in fluoride adsorption. Among these output variables, pH of the solution, initial
fluoride concentration, contact time and temperature had a significant effect on fluoride adsorption. Once the op-timization was ever the experimental and model pre-dicted values of the response variables were compared. The plot between experimental (actual) and predicted values of fluoride adsorption rate is shown in Figures 10(a), (b) and (c). A good correlation between input and
output variables are also shown by the model.
4.10. Effects of Experimental Parameters on Fluoride Adsorption
The effects of different experimental parameters such as solution pH, initial fluoride concentration, contact time and temperature on the fluoride adsorption is shown in
Figures 11 (a)-(i). The fluoride adsorption capacity was
increased with increase in initial fluoride concentration, contact time and decreased in solution pH and tempera-ture. The adsorption of fluoride adsorption favors com-paratively at low pH and room temperature. Tables 5-7
[image:9.595.55.540.378.479.2]Kinetic models LLD-1 LLD-2 LLD-3
qe1 = 2.33 qe1 = 1.01 qe1 = 1.14
Kad1 = 0.009 Kad1 =0.01 Kad1 = 0.014
Pseudo-first-order
R2 = 0.25 R2 = 0.8 R2 = 0.41
qe2 = 47.62 qe2 = 45.45 qe2 = 48.91
Kad2 = 0.07 Kad2 = 0.001 Kad2 = 0.002
Pseudo-second-order
R2 = 0.99 R2 = 0.99 R2 = 0.99
Kit = 2.03 Kit = 1.13 Kit = 0.691
I = 4.07 I = 25.44 I = 31.92
Intra-particle diffusion
[image:10.595.58.538.100.255.2]R2 = 0.97 R2 = 0.79 R2 = 0.72
Table 5. Analysis of variance for fluoride adsorption rate onto LLD-1. ANOVA for response surface Quadratic Model Analy-sis of variance table [Partial sum of squares-Type III].
p-value source
prob > F Sum of Squares df Mean Square
F Value
P Probability
Model
<0.0001 14578.51 9 1619.83 65.45 <0.0001
A-initial
concentration 2614.10 1 2614.10 105.62 <0.0001
0.0001 B-pH 3110.35 1 3110.35 125.67 <0.0001
C-contact time
0.0001 1404.50 1 1404.50 56.75 <0.0001
AB
0.0001 1482.25 1 1482.25 59.89 <0.0001
AC
0.0541 132.25 1 132.25 5.34 <0.0541
BC
0.0727 110.25 1 110.25 4.45 <0.0727
A2
0.0001 1615.50 1 1615.5 65.27
B2
0.0001 2556.64 1 2556.64 103.29
C2
0.0002 1259.03 1 1259.03 50.87
Residual 173.26 7 24.75
Lack of fit
0.1999 171.26 6 28.54 14.27 <0.1999
Pure error 2.00 1 2.00
Cor Total 14751.76 16
Std. Dev.
0.9883 4.98 R-Squared
Mean
0.9732 52.88 Adj R-Squared
C.V. %
0.9174 9.41 Pred R-Squared
[image:10.595.52.541.291.735.2]Table 6. Analysis of variance for fluoride adsorption rate onto LLD-2.
p-value source prob > F Sum of Squares df Mean Square F Value P Probability
Model 6387.32 9 709.70 248.87 <0.0001
A-initial concentration
<0.0001 668.52 1 668.52 243.43 <0.0001
B-contact time
<0.0001 1891.13 1 1891.31 663.15 <0.0001
C-temp
<0.0001 1081.13 1 1081.13 379.11 <0.0001
AB 2.25 1 2.25 0.79 0.4039
AC 56.25 1 56.25 19.72 0.0030
BC 441.00 1 441.00 154.64 <0.0001
A2 30.81 1 30.81 10.80 0.0134
C2 242.37 1 242.37 84.99 <0.0001
Residual 19.96 7 2.85
Lack of fit 0.1999 71.20 4 4.30 4.67 0.1182
Pure error 2.76 3 4.30
Cor Total 6407.28 16
Std. Dev. 0.9969 4.98 R-Squared
Mean 0.9929 57.46 Adj R-Squared
C.V. % 0.9641 2.94 Pred R-Squared
Press 230.16 Adeq Precision 46.152
Table 7. Analysis of variance for fluoride adsorption rate onto LLD-3.
p-value source prob > F Sum of Squares df Mean Square F Value P Probability Model
<0.0001 2784.73 14 198.91 209.93 <0.0001
A-initial concentration
<0.0001 802.32 1 802.32 846.76 <0.0001
B-pH
<0.0001 111.93 1 111.93 118.13 <0.0001
C-temp <0.0001 D-contact time
<0.0001
247.45
101.12
1
1
247.45
101.12
261.16
106.72
<0.0001
<0.0001
AB 0.0002 25.00 1 25.00 26.38
AC 0.0591 4 1 4 4.22 0.0591
AD 0.0051
BC 0.1637
BD <0.0001
CD 0.3217
10.42
2.05
210.25
1.00
1
1
1
1
10.42
2.05
210.25
1.00
10.99
2.16
221.9
1.06
0.0051
0.1637
<0.0001
0.3217
A2 <0.0001
B2
<0.0001
167.86
443.06
1
1
167.86
443.06
177.16
464.00
<0.0001
<0.0001 C2
<0.0001 D2
<0.0001
42.77
49.50
1
1
42.77
49.50
45.14
52.24
< 0.0001
< 0.0001
Residual 13.27 14 0.95
Lack of fit 0.0412 12.52 10 1.25 6.67 0.0412
Pure error 0.75 4 0.19
Cor Total 2798.00 28
Std. Dev. 0.9953 0.97 R-Squared 0.9953
Mean 0.9905 75.00 Adj R-Squared 0.9905
C.V. % 0.9695 1.30 Pred R-Squared 0.9695
[image:11.595.65.537.363.739.2]Color points by v alue of remov al:
92
13
Actual
P
redi
c
ted
94.00
73.25
52.50
31.75
11.00
11.76 32.08 52.39 72.71 93.02
(a)
Design-Expert® Software Removal
Color points by value of Removal:
92
56
2
3
Predicted vs. Actual
93.0083.75
Pr
ed
ic
te
d
74.50
65.25
56.00
56.00 65.04 74.07 83.11 92.14
Design-Expert® Software Removal
Color points by value of Removal:
92
56
2
3
Predicted vs. Actual
93.00
83.75
Pr
ed
ic
te
d
74.50
65.25
56.00
56.00 65.04 74.07 83.11 92.14
[image:13.595.188.519.80.432.2]Actual (c)
Figure 10. The plot of predicted versus actual values for fluoride adsorption rate onto (a) LLD-1, (b) LLD-2, (c) LLD-3.
LLd-3 are 65.45, 248.87 and 209.93 respectively which imply the model is significant. There is only 0.01% of chance that a “model F value” this large could occur due to noise. The values of “prob > F” less than 0.05 indicate model terms are significant, where values greater than 0.1 direct the model terms are not significant.
4.11. Optimization of Process Variables
The numerical optimization was applied to optimize the fluoride adsorption process and the optimum values of various parameters are provided in Table 8. A desirabil-
ity value of 1.0 was obtained after optimizing the process parameters.
5. Conclusion
This work investigated the adsorption of fluoride onto LLD-1, LLD-2 and LLD-3. Experiments were made as a function of different adsorption parameters (pH, initial fluoride concentration, adsorbent dose, contact time and stirring rate and temperature). Response surface method-ology by the Box-Behnken model was used to examine the role of three process factors on fluoride removal. It
was shown that a second-order polynomial regression model could properly interpret the experimental data with coefficient of determination (R2) value of 0.9969
and an F value of 248.87. The simultaneous optimization of the multiresponse system by desirability function in-dicated that 92.74%, 92.52%, 92.24% adsorption of fluo-ride can be possible by using the optimal conditions of pH, initial fluoride concentration, contact time and tem-perature. The Langmuir, Freundlich, D-R and Tempkin isotherm models were used for the description of fluoride adsorption phenomenon. The data were good agreement with both Langmuir and D-R isotherms. The kinetics of fluoride adsorption was controlled by pseudo-second order kinetic model for all the tested adsorbents. How-ever, LLD-1 also showed the agreement with in-tra-particle diffusion model. The adsorptions of fluoride onto LLD-1, LLD-2 and LLD-3 were found to be exo-thermic in nature. This study shows that the Box- Behnken model is suitable to optimize the experiments for fluoride removal through adsorption.
6. Acknowledgements
remov al Design Points 92 13
X1 = A: initial concentration X2 = B: pH Actual Factor C: contact time = 125.00
0.26 2.02 3.77 5.53 7.29 2.00
4.00 6.00 8.00
10.00 removal
A: i nitial concentration
B:
p
H
28.6203 42.0374 28.6203
42.0374 55.4546 68.8718 82.2889 2 2 (a) remov al Design Points 85 24
X1 = A: initial con X2 = B: contact time Actual Factor C: temp = 328.00
0.26 2.02 3.77 5.53 7.29 10.00
67.50 125.00 182.50
240.00 removal
A: initial con
B : c o n ta c t ti m e 34.5681 43.7767 52.9852 62.1937 62.1937 71.4022 4 4 4 4 (d) Remov al Design Points 92 56
X1 = A: initial concentration X2 = B: PH Actual Factors C: temp = 328.00 D: contact time = 125.00
0.26 2.02 3.77 5.53 7.29 2.00
4.00 6.00 8.00
10.00 Removal
A: initial concentration
B: P H 61.5576 66.2938 66.2938 71.0301 75.7663 80.5025 4 4 4 4 (g)
Design-Expert® Sof tware remov al
Design Points 92 13
X1 = A: initial concentration X2 = C: contact time Actual Factor B: pH = 6.00
0.26 2.02 3.77 5.53 7.29 10.00
67.50 125.00 182.50
240.00 removal
A: initial concentration
C : c o n ta c t ti m e 32.9334 44.374655.8158 67.2571 78.6983 (b)
Design-Expert® Sof tware remov al
Design Points 85 24
X1 = A: initial con X2 = C: temp Actual Factor B: contact time = 125.00
0.26 2.02 3.77 5.53 7.29 313.00
320.50 328.00 335.50
343.00 removal
A: initial con
C : te m p 51.3637 58.1178 64.8719 71.626 78.3801 4 4 4 4 (e)
Design-Expert® Sof tware Remov al
Design Points 92 56
X1 = A: initial concentration X2 = C: temp Actual Factors B: PH = 6.00 D: contact time = 125.00
0.26 2.02 3.77 5.53 7.29 313.00
320.50 328.00 335.50
343.00 Removal
A: initial concentration
C: t e m p 62.5822 67.2605 71.9387 76.617 81.2952 4 4 4 4 (h)
Design-Expert® Sof tware remov al
Design Points 92 13
X1 = B: pH X2 = C: contact time Actual Factor A: initial concentration = 3.77
2.00 4.00 6.00 8.00 10.00 10.00 67.50 125.00 182.50 240.00 removal B: pH C : c ont ac t t im e 24.8296 37.8949 50.9602 50.9602 64.0255 77.0908 2 2 (c)
Design-Expert® Sof tware remov al
Design Points 85 24
X1 = B: contact time X2 = C: temp Actual Factor A: initial con = 3.77
10.00 67.50 125.00 182.50 240.00 313.00
320.50 328.00 335.50
343.00 removal
B: contact tim e
C: t e m p 36.5553 45.9826 45.9826 55.4098 64.8371 74.2644 4 4 4 4 (f)
Design-Expert® Sof tware Remov al
Design Points 92 56
X1 = A: initial concentration X2 = D: contact time Actual Factors B: PH = 6.00 C: temp = 328.00
0.26 2.02 3.77 5.53 7.29 10.00
67.50 125.00 182.50
240.00 Removal
A: initial concentration
D : c ont ac t t im e
[image:14.595.62.539.81.509.2]70.7102 74.9969 79.2836 83.5703 87.857 2 2 4 4 4 4 (i)
Figure 11. The effects of (a) and (g) solution pH and initial fluoride concentration, (b) and (d) and (i) contact time and initial fluoride concentration, (c) contact time and pH, (e) and (h)temperature and initial fluoride concentration, (f) temperature and contact time.
Table 8. The optimum values of the experimental parameters.
Parameters LLD-1 LLD-2 LLD-3
pH 6.15 - 7.34
Contact time (min) 143.73 45.97 203.47
Initial concentration (mg/L) 6.03 2.94 6.66
Temperature (K) - 328.09 336.10
Adsorption 92.74 92.52 92.24
[image:14.595.58.537.574.736.2]Datta for his encouragement and active support of doing such laborious work. Authors also like to express their gratitude.
REFERENCES
[1] V. Sivasankar, S. Murugesh, S. Rajkumar and A. Darchen, “Cerium Dispersed in Carbon (CeDC) and Its Adsorption Behavior: A First Example of Tailored Adsorbent for Fluoride Removal from Drinking Water,” Chemical
En-gineering Journal, Vol. 214, 2013, pp. 45-54.
doi:10.1016/j.cej.2012.10.023
[2] WHO, “Guidelines for Drinking Water Quality,” World Health Organization, Geneva, 2006.
[3] S. Ayoob and A. K. Gupta, “Fluoride in Drinking Water a Review on the Status and Stress Effects,” Critical
Re-views in environmental Science and Technology, Vol. 36,
No. 6, 2006, pp. 433-487.
doi:10.1080/10643380600678112
[4] M. H. Trivedi, R. J. Verma and N. J. Chinoy, “Effect of High Fluoride Water on Intelligence of School Children in India,” Fluoride, Vol. 40, No. 3, 2007, pp. 178-183. [5] A. J. Arulanantham, T. V. Ramakrishna and N. Balasu-
bramanium, “Studies on Fluoride Removal by Coconut Shell Carbon,” Indian Journal of Environmental Health, Vol. 13, No. 5, 1992, pp. 531-536.
[6] S. Kumar, A. Gupta and J. P. Yadav, “Fluoride Removal by Mixtures of Activated Carbon from Neem (Azadi- rachta) and Kikar (Acacia Arabica) Leaves,” Indian
Journal of Chemical Technology, Vol. 14, No. 4, 2007,
pp. 355-361.
[7] G. Alagumuthu, V. Veeraputhiran and R. Venkataraman, “Adsorption Isotherms on Fluoride Removal Batch Tech-niques,” Archives of Applied Science Research, Vol. 2, No. 4, 2010, pp. 170-185.
[8] S. Chakrabarty and H. P. Sarma, “Defluoridation of Con-taminated Drinking Water Using Neem Charcoal Adsorb-ent: Kinetics and Equilibrium Studies,” International Jour-
nal of ChemTech Research, Vol. 4, 2012, pp. 511-516.
[9] C. Gisele, S. Bazanella, G. F. Silva, A. M. Vieira and R. Bergamasco, “Fluoride Removal from Water Using Com-bined Moringa oleifera/Ultrafiltration Process,” Water,
Air, and Soil Pollution, Vol. 223, No. 9, 2012, pp. 6083-
6093.
[10] C. J. Atkinson, “The Flux and Distribution of Xylem Sap Calcium to Adaxial and Abaxial Epidermal Tissue in Re-lation to Stomatal Behavior,” Journal of Experimental
Botany, Vol. 42, 1991, pp. 987-993.
doi:10.1093/jxb/42.8.987
[11] M. Mourabet, A. El. Rhilassi, H. El. Boujaady, M. Ben-nani-Ziatni, R. El. Hamri and A. Taitai, “Removal Of-fluoride from Aquous Solution by Adsorption on Apatitic Tricalcium Phosphate Using Bix-Behnken Design and Desirability Function,” Applied Water Science, Vol. 258, 2012, pp. 4402-4410.
[12] Y. LiuZheng and A. Wang, “Response Surface Method-ology for Optimizing Adsorption Process Parameters for Methylene Blue by a Hydrogel Composite,” Adsorption
Science and Technology, Vol. 28, No. 10, 2010, pp. 913-
921. doi:10.1260/0263-6174.28.10.913
[13] V. Hernández-Montoyaa, L. A. Ramírez-Montoya, A. Bonilla-Petriciolet and M. A. Montes-Moránb, “Optimiz-ing the Removal of Fluoride from Water Us“Optimiz-ing New Car-bons Obtained by Modification of Nut Shell with a Cal-cium Solution from Egg Shell,” Biochemical Engineering
Journal,Vol. 62, 2012, pp. 1-7.
doi:10.1016/j.bej.2011.12.011
[14] M. K. Mondal, “Removal of Pb (II) from Aqueous Solu-tion by AdsorpSolu-tion Using Activated Tea Waste,” Korean
Journal of Chemical Engineering, Vol. 27, No. 1, 2010,
pp. 144-151. doi:10.1007/s11814-009-0304-6
[15] A. K. Yadav, R. Abbassi and A. Gupta and M. Dadash-zadeh, “Removal of Fluoride from Aquous Solution and Groundwater by Wheat Straw, Saw Dust and Activated Carbon of Sugarcane,” Ecological Engineering, Vol. 52, 2013, pp. 211-218. doi:10.1016/j.ecoleng.2012.12.069
[16] O. Genc, Y. Yalcinkaya, E. Buyuktuncel, A. Denilzili, M. Y. Arica and S. Bektas, “Uranium Recovery by Immobi-lized and Dried Powdered Biomass, Characterization and Comparison,” International J of Minerology Process, Vol. 68, 2003, pp. 93-107.
doi:10.1016/S0301-7516(02)00062-5
[17] S. V. Mohan and J. Karthikeyan, “Removal of Lignin and Tannin Aquous Solution by Adsorption onto Activated Charcoal,” Environmental Pollution, Vol. 97, 1997, pp. 183-197. doi:10.1016/S0269-7491(97)00025-0
[18] T. Ilhami, B. Gulay, Y. Emine and B. Gokben, “Equilib-rium and Kinetic Studies on Biosorption of Hg(II), Cd(II) and Pb(II) Ions onto Micro Algae Chlamydomonas- reinhardtii,” Journal of Environmental Management, Vol. 77, No. 2, 2005, pp. 85-92.
doi:10.1016/j.jenvman.2005.01.028
[19] S. Panumati, K. Chudecha, P. Vankhaew, V. Choolert, L. Chuenchom, W. Innajitara and O. Sirichote, “Adsorption of Phenol from Diluted Aqueous Solutions by Activated Carbons Obtained from Bagasse, Oil Palm Shell and Peri-carp of Rubber Fruit,” Songklanakarin Journal of Science
& Technology, Vol. 30, No. 2, 2008, pp. 185-189.
[20] M. Murugan and E. Subremanian, “Studies on Defluori-dation of Water by Tamarindseed, an Unconventional Biosorbent,” Journal of Water and Health, Vol. 4, No. 4, 2006, pp. 453-461.
[21] R. Bhaumik, N. K. Mondal, B. Das, P. Roy, K. C. Pal, C. Das, A. Banerjee and J. K. datta, “Eggshell Powder as an Adsorbent for Removal of Fluoride from Aquoussolution : Equilibrium, Kinetic and Thermodynamic Studies,” E-
Journal of Chemistry, Vol. 9, 2012, pp. 1457-1480.
doi:10.1155/2012/790401
[22] D. J. Killedar and D. S. Bhargava, “Effects of Stirring Rate Temperature on Luoride Removal by Fishbone Charcoal,” International Journal of Occupational and
Environmental Health, Vol. 35, No. 2, pp. 1993, pp. 81-
87.