http://www.scirp.org/journal/am ISSN Online: 2152-7393 ISSN Print: 2152-7385
Efficient Simulation of Stationary Multivariate
Gaussian Random Fields with Given
Cross-Covariance
Jakob Teichmann, Karl-Gerald van den Boogaart
Helmholtz-Zentrum Dresden-Rossendorf, Helmholtz Institute Freiberg for Resource Technology, Freiberg, Germany
Abstract
The present paper introduces a new approach to simulate any stationary multivariate Gaussian random field whose cross-covariances are predefined continuous and in-tegrable functions. Such a field is given by convolution of a vector of univariate ran-dom fields and a functional matrix which is derived by Cholesky decomposition of the Fourier transform of the predefined cross-covariance matrix. In contrast to common methods, no restrictive model for the cross-covariance is needed. It is sta-tionary and can also be reduced to the isotropic case. The computational effort is very low since fast Fourier transform can be used for simulation. As will be shown the algorithm is computationally faster than a recently published spectral turning bands model. The applicability is demonstrated using a common numerical example with varied spatial correlation structure. The model was developed to support simu-lation algorithms for mineral microstructures in geoscience.
Keywords
Image Processing, Convolution, Cross-Covariance, Cholesky Decomposition, Fourier Transformation
1. Introduction
The theory of uni- and multivariate random fields has been used extensively in a broad range of science and engineering disciplines such as meteorology, astrophysics and geosciences ([1] [2]) over the last decades. The multivariate case is still topic of modern spatial statistics research ([3] [4] [5]).
Of particular interest is the general case when the components of the multivariate vector are not independent. Numerous models of the resulting so-called cross- How to cite this paper: Teichmann, J. and
van den Boogaart, K.-G. (2016) Efficient Simulation of Stationary Multivariate Gaus-sian Random Fields with Given Cross- Covariance. Applied Mathematics, 7, 2183- 2194.
http://dx.doi.org/10.4236/am.2016.717174
Received: September 18, 2016 Accepted: November 19, 2016 Published: November 22, 2016
Copyright © 2016 by authors and Scientific Research Publishing Inc. This work is licensed under the Creative Commons Attribution International License (CC BY 4.0).
http://creativecommons.org/licenses/by/4.0/
covariance and methods for simulation of such fields have been given in the literature (see [6]).
A common classification is to distinguish between algorithms giving realizations which are exactly Gaussian (autoregressive, moving-average, circulant-embedding, dis-crete spectral simulation, see [7] [8] [9] [10] [11]) and those which produce approx-imately Gaussian realizations. The later are based on the central limit theorem such as Poisson dilution, tessellation, continuous spectral and turning bands algorithms ([2] [12] [13] [14]).
Another distinction is whether the approach is restricted to the simulation of the fields at regular grid locations (e.g. the ones mentioned for exactly Gaussian) or not (e.g. the ones for approx. Gaussian), the Cholesky decomposition approach ([15] [16]) and sequential algorithms ([17]). Unfortunately the later became computationally too costly when the number of locations exceeds a few thousands.
Many models are also limited to certain parametric models for the cross-covariances. Such as the methods based on convolution, e.g., the so-called kernel convolution and covariance convolution approach ([6], p. 739). Both are suitable for the isotropic case but the number of parameters is limited to N (or N−1) functions, while a cross-
covariance has
(
1)
2
N N−
functional parameters in general.
Recently, a very interesting ansatz without this limitation was given in [3]. Similar to a kind of spectral turning-bands algorithm it is available for non-grid positions but it creates only approximately Gaussian fields.
The spectrum convolution approach proposed in this paper creates exact stationary Gaussian random fields. Such a multivariate field with values in N is given by con- volution of a N dimensional vector of univariate Gaussian random fields and a functional N×N matrix. Note that this model is completely different from the
Cholesky decomposition approach ([15] [16]) and requires only decomposition of
N×N matrices. The functional matrix is derived by Cholesky decomposition of the
Fourier transform of the predefined cross-covariance matrix (with some normalization). It will turn out that this approach allows fast generation of large samples since only Fourier transform and matrix multiplication of the initial vector of univariate Gaussian fields is required. Unfortunately, in the present form, the method seems only appro- priate for grid locations. Relevant for many research fields, the new model will be used in our research group in a geostatistical framework. It serves as a basis for models of mineral microstructure. For that a very fast algorithm is required since the grids contain several million locations.
In a certain sense it is similar to coregionalization ([18]), which may also be defined for a functional transformation matrix but unfortunately this approach cannot be made stationary (besides trivial cases).
model in section three, which contains the proof of validity. Example simulation and a comparison of the computation effort to another model is done in the second last section. The paper is topped off with a conclusion section.
2. Theory
This section is intended to make the reader familiar with notation, the mathematical objects used in this paper and some theoretical results.
2.1. Multivariate Random Fields
A N-variate second-order random field Z:d ⊇ →T N is a collection of real- valued random vectors Z x
( )
=(
Z1( )
x ,,ZN( )
x)
indexed by x∈T with existing second moments.Common first and second-order characteristics are the field m x
( )
=EZ x( )
calledtrend of Z and the matrix ρ=
( )
ρi j, 1 ,≤ ≤i j N of functions( )
(
( ) ( )
)
, , cov , , ,
i j x y Z x Zi j y x y T
ρ = ∈
which is called cross-covariance function of Z. This function satisfies positive semi- definiteness in the sense that
(
)
1 1
, 0
n n
t
p q
p q
a ρ x y a
= =
≥
∑∑
for all n∈N, x1,,xn∈d and a1,,an∈N. If the cross-covariance function
depends on x and y only through the distance vector h= −x y, then Z is called stationary.
Without loss of generality, throughout the rest of the paper, the trend m of the random fields is assumed to be constant equal to o=
(
0,, 0)
.In contrast to the univariate case, isotropy has different interpretations in the multi- variate case (see [4]). In this paper Z is called isotropic if ρ
(
x y,)
does only dependon the lag r= x−y , where ⋅ denotes the euclidean norm.
A multivariate Gaussian field is a random field where all finite dimensional distri- butions are normal distributions. Similar to the univariate case it is fully described by the aforementioned characteristics m and ρ.
The main theorem of this paper makes use of the famous Kolmogorov-Chentsov theorem. See [19] (thm 2.2.3) or [20] (thm 1) for the proof. It provides a useful cri- terion for establishing the existence of versions of stochastic processes or fields with continuous sample paths.
Theorem 1 (Kolmogorov continuity) Suppose that the random field X =
( )
Xt t T∈on an open domain d
T ⊆ satisfies the following condition: There exist positive
constants α β, ,D such that
E Xt Xs D t sd , ,s t T.
α +β
− ≤ − ∈
Corollary 1 A stationary random field X =
( )
Xt t T∈ ond
T ⊆ with continuous
and integrable covariance function ρ has a version with a.s. continuous paths on T. Proof. On the one hand, by continuity, ρ is bounded on every bounded subset of T. On the other hand, it holds limh→∞ρ
( )
h =0 since it is integrable. Overall, this implies( )
(
)
(
)
2
E Xt−Xs =2 ρ o −ρ t−s ≤D s t, , ∈T.
From Theorem 1 follows the statement.
The following theorem from [21] is required for the proof of Lemma 2. Lemma 1 Suppose
( )
Xn n∈ is a sequence of normal distributed vectors andlimn→∞ Xn =X , almost surely. If
: lim E n and : lim cov n
n n
b X C X
→∞ →∞
= =
exist then X is normal with mean vector b and covariance matrix C. Also important for our main result is the next lemma.
Lemma 2 Suppose
( )
Zn n∈ is a sequence of Gaussian random fields andlimn→∞Zn =Z, almost surely. If
: lim E n and : lim cross-cov n
n n
m Z ρ Z
→∞ →∞
= =
exist then Z is Gaussian with trend m and covariance function ρ.
Proof. The finite dimensional distributions of Zn are all normal. Mean vectors and covariance functions of the finite dimensional distributions converge since EZn and
covZn do by assumption. From Lemma 1 and since almost sure convergence
implies convergence in distribution it follows that the finite dimensional distributions of Z are also normal, which gives that Z is Gaussian.
Also required in what follows is the following easy to prove result from linear algebra.
Lemma 3 For all integers n∈, vectors v∈n and matrices A B, ∈n n× it holds
( )
Avt tBvt =Av vBt t.2.2. Previous Simulation Approaches
As introduced in the beginning there are several procedures to construct and sample random fields with predefined cross-covariance ([5] and [18] section 28.9). Two pro- mising ways are given in detail below.
a) A common method to correlate several random fields is called coregionalization (see [4] section four). For this, let
{
( )1 ( )}
, , N
Y = Y Y be a vector of independent
stationary and isotropic Gaussian random fields. For a matrix M define the vector of random fields Z by
. t
Z =M Y
The cross-correlation of Z is now given by the positive semi-definite matrix ([4])
( )
, 1 , ,t
i j i j N MCM
ρ
where C=diag cov
(
Y( )1,, covY( )N)
is the diagonal matrix of covariances. To get EZ≡o it is sufficient to assume EY ≡0.b) Recently, an improved spectral turning-bands algorithm for simulating stationary multivariate Gaussian random fields was presented in [3]. Using this one can simulate any multivariate Gaussian field whose cross-covariance function is continuous and absolutely integrable for each entry.
The approach reformulated and reduced in what follows for the stationary isotropic case in 2 which makes the cross-covariance symmetric such that the imaginary part
in the model vanishes. In general it is also available for the anisotropic case.
Extending the very famous result of Bochner for the multivariate case the isotropic cross-covariance at lag r:= h can be written as (see [22])
( )
r 2cos(
h u,) ( )
F u du ρ =∫
where F: 0,
[
∞ →[
H+ is called the matrix of spectral densities (H+ denotes the set of symmetric positive semi-definite matrices). It is given by( )
2cos(
,) ( )
d , : ,F s =
∫
u h ρ h h s = u
which can be rewritten using Hankel transform (see [23]) as
( )
2π 0( ) ( )
0 d ,F s =
∫
∞ρ r J sr r rwhere J0 is the 0-th order Bessel function of the first kind.
Fix an arbitrary probability density h: 0,
[ [ [ [
∞ → 0,∞ with infinite and positivesupport. For
(
)
2sin x, cos x
x= x θ θ ∈ define the random vector
( )
(
,(
,)
,)
( )
,1 1
1
: cos cos ,
L N
l n x l n l n l n n
l n
Z x x X A X e
L = = θ θ φ
=
∑∑
− + (1)where L1, Xl n, are mutually independent non-negative random reals with density h and θ φl n, , l n, are mutually independent random variables uniformly distributed over
the interval
[
0, 2π[
and independent of the Xl n, . Note that en=(
0,, 0,1, 0,, 0)
with 1 at position n. The deterministic “lower triangular matrix”-valued function A is uniquely given by Cholesky decomposition such that( ) ( )
t 4πsF s( )
( )
A s A s
h s
=
for all s≥0.
As shown in [3] the random field Z is approximately multivariate Gaussian (for large L) with trend o and cross-covariance ρ.
3. Spectrum Convolution Approach
The main part of the paper is given in what follows. The following model can be seen as a spectral variant of coregionalization (Section 2.2) but also bears analogy to the spectral turning bands method.
Let Y=
(
Y1,,YN)
be a stationary multivariate Gaussian random field on dmean EY ≡o, covariance functions cov i
Y =R and spectrum functions Rˆ, 1≤ ≤i N. Furthermore, let R be continuous and integrable and A:d→N N× be a mapping such that A h
( )
=A( )
−h and Ai j, are integrable functions.Theorem 2 The random vector field Z on d with values in N defined by t
Z = ∗A Y
is multivariate Gaussian with trend EZ ≡o and stationary cross-covariance
. t N
A RI A
ρ= ∗ ∗
For the spectrum it holds
( )
ˆ( ) ( ) ( )
ˆ ˆˆ R A A t.
ρ ξ = ξ ξ ξ
Proof.
• Let d be the d-dimensional hypertorus, the product space of d circles
1 1 times : . d d S S =× ×
Equivalently, the d-torus is obtained from the d-dimensional hypercube by gluing the opposite faces together giving a cubic domain with periodic boundaries. Because of periodicity for a continuous function f :d→ and for every a∈d it holds
(
)
d( )
d .df x+a x= df x x
∫
∫
(2)• For n∈ define the random field
( )
d(
) ( )
td , d.n n
Z x =
∫
A x−y Y y y x∈
It can be written as
( )
,(
) ( )
=1, ,
d ,
d
n n i j j
j i N
Z x = A x−y Y y y
∑∫
for d
x∈ , showing that it is well-defined and Gaussian, since the sum and Riemann integral over a bounded domain of a Gaussian processes with a.s. continuous paths are Gaussian processes again [24] [25]. There is a version of Yj with a.s. continuous paths, since its correlation function was assumed to be continuous and integrable such that Corollary 1 can be applied.
• For the trend it follows
( )
(
)
( )
(
) ( )
(
)
(
( )
)
E E E d E d , d d t n t n t nZ x A Y x
A x y Y y y
A x y Y y y
o = ∗ = − = − ≡
∫
∫
since EYi ≡0 for 1≤ ≤i d.
( )
( )
(
)
( )
(
)
( )
(
) ( )
(
)
(
) ( )
(
) ( )
(
)
(
) ( )
(
) ( ) ( ) (
)
E EE d d
E d d
E d d
d d
d d
d d
t t t t
n n t t t n n t t t n n t t n n
Z x Z y A Y x A Y y
A x s Y s s A y t Y t t
A x s Y s A y t Y t s t
A x s Y s Y t A y t s t
= ∗ ∗ = − − = − − = − −
∫
∫
∫ ∫
∫ ∫
with Lemma 3
(
) ( ) ( ) (
)
(
) (
)
( )
E d d
d d d d d d t t n n t N n n
A x s Y s Y t A y t s t
A x y u R u v I A v u v
= − − = − − − −
∫ ∫
∫ ∫
using the transformation u= −s y v, = −t y and Equation (2). From that, one can deduce
( ) ( )
( )
( )
(
) (
)
( )
(
)
(
)
( )
(
)
(
)
E lim E
d d d d d d t t n n n t N t N t N
Z x Z y Z x Z y
A x y u R u v I A v u v
A x y u RI A u u
A RI A x y
→∞ = = − − − = − − ∗ = ∗ ∗ −
∫ ∫
∫
(3)which does exist since all components were assumed to be integrable. According to Lemma 2 the limit d
(
) ( )
dt
Z=
∫
A x−y Y y y is well-defined and Gaussian.
• Furthermore, from (3) it follows that Z is stationary and by the convolution theorem the spectrum becomes
( )
ˆ( ) ( ) ( )
ˆ ˆ( ) ( ) ( )
ˆ ˆˆ A EY A t R A A t.
ρ ξ = ξ ξ ξ = ξ ξ ξ
Modeling and simulation is based on the following corollary.
Corollary 2 If a cross-covariance ρ is previously defined, the matrix A is given by Fourier transform of Aˆ, which can be deduced by
ˆ ˆ ˆ ˆ
t
AA R ρ =
using Cholesky decomposition such that Z has cross-covariance ρ.
4. Simulation
This section is intended to describe and to demonstrate how simulation of the new model works by means of a popular example. The second part evaluates the compu- tational effort in comparison to the spectral turning bands approach.
4.1. Simulation Procedure and Example
Based on Theorem 2 and Corollary 2 one can describe a very simple simulation algorithm. Let functions Ai j, and R be given. For simulation in a bounded domain do the
following.
• For i=1,,N create a univariate Gaussian field Yi on with covariance R. • Calculate the discrete Fourier transform Yi of Yi.
• For each grid point g∈ deduce the vector Z gˆ
( )
by multiplication of the matrix A gˆ( )
and the vector(
( )
( )
)
1 , ,
t
d
Y g Y g .
• Apply the inverse discrete Fourier transform to Zˆ to obtain the field Z.
The algorithm uses the same steps as the usual approach based on Fourier transform for an arbitrary Gaussian field ( [7] [10] [26]) with additional multiplication of A gˆ
( )
.There are numerous models to obtain valid cross-covariance functions. The popular multivariate Matérn model ([3] [27]) extending the univariate case has only a finite number of real parameters for scale and shape of the field.
Define the isotropic Matérn covariance function, that is
(
)
2( )
1, , h h , d.
M h a K h
a a
ν ν
ν
ν ν
−
=Γ ∈
The spectrum is given by (see [3])
(
)
(
)
( )
2(
)
22 2
2 1
ˆ , , , .
π 1
d
d
d d
a d
M u a u
a u
ν
ν ν
ν +
Γ +
= ∈
Γ +
Here Kν is a modified Bessel function of the second kind and a>0 is a spatial
scale parameter referred to as a correlation length. The smoothness parameter ν >0
defines the Hausdorff dimension and the differentiability of the sample paths, since for a positive integer k, the sample paths are k times differentiable if and only if ν >k ([27]).
For d=2 and N =2 the so-called full bivariate model can be derived by setting
(
)
, , , , ,
i j M ai j i j
ρ = ⋅ ν . In [27] conditions on ai j, ,νi j, were derived such that ρ is a
valid cross-covariance. Following [3]
( )
(
(
, 20,1.5)
)
0.5(
(
,100 3,1)
)
0.5 ,100 3,1 ,100, 0.5
M h M h
h
M h M h
ρ =
is a valid function.
Let us consider the quadratic domain
[
0, 500] [
× 0, 500]
discretized by a grid of 500 500× nodes. The model and simulation procedure was implemented using thecommercial software Mathematica®
.
The components of ρ are shown in Figure 1.
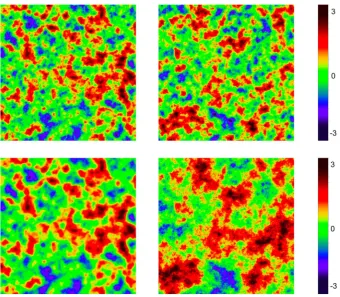
A realization of the initial univariate random fields Y1 and Y2 such as a sample of
the resulting cross-correlated bivariate Gaussian field is illustrated in Figure 2.
4.2. Computational Effort
This short paragraph compares theoretical and practical computation times of spectral turning bands and spectrum convolution on the same machine for varying numbers of sample locations.
Figure 1. Left, covariance functions ρ1,1 (blue), ρ1,2 (red) and ρ2,2 (green). Right, corresponding
Fourier transforms.
Figure 2. Top, samples of the univariate Gaussian random fields. Bottom, resulting sample of the bivariate Gaussian field, x-component (left), y (right).
summands. For a common choice of L≈ M it follows O M
(
3 2)
. An advantage over circulant-embedding techniques is the possibility to split the area of locations into small subsets allowing for a considerable reduction of memory storage requirements and for parallel computations.Considering the computational costs for our spectrum convolution approach, since d and N are small numbers, matrix multiplication and Fourier transform are the main operations to be considered. Both can be performed in O M
(
logM)
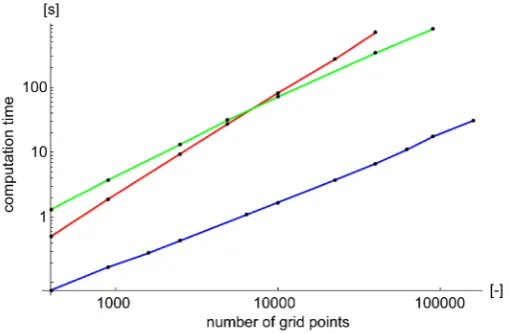
. Thus, the [image:9.595.204.545.230.527.2]Figure 3. Computation time as a function of the number of sample locations for spectral turning bands with L= M (red), L=10logM (green) and spectrum
convolution approach (blue).
and process these subsets consecutively and/or independently.
Considering a practical example performed on a single core 2 ghz laptop cpu. Recall that all code was written in Mathematica software. In Figure 3 the computational time for 10 realizations and different numbers of sample locations M for each approach is shown. Spectrum convolution (blue) is much faster than spectral turning bands, which was computed for L= M (red) and L=10 logM (green). If L scales logarithmic both implementations have the same asymptotic, which is also verified theoretically, but spectrum convolution is still more than 40 times faster.
5. Conclusion
As a contribution to the topic of stochastic processes in general and to random fields in particular, a new multivariate modeling approach was presented. It allows modeling and simulation of exact stationary multivariate Gaussian random fields where also the case of isotropy is covered. It is remarkable that any such a random field can be ob-tained, provided the components of its cross-covariance are continuous and integrable functions. The model is easy to implement since only simulation of normal variables, matrix multiplication, Cholesky decomposition and Fourier transform are required tools. It is shown numerically that the algorithm is more than 40 times faster than spec-tral turning bands and it can also be modified for parallel computing but, unfortunately, it is limited to sampling in locations on a regular grid.
Acknowledgements
References
[1] Bilodeau, M., Meyer, F. and Schmitt, M. (2005) Space, Structure and Randomness. Sprin-ger, Berlin. http://dx.doi.org/10.1007/0-387-29115-6
[2] Lantuéjoul, C. (2013) Geostatistical Simulation: Models and Algorithms. Springer Science & Business Media, Berlin.
[3] Emery, X., Arroyo, D. and Porcu, E. (2016) An Improved Spectral Turning-Bands Algo-rithm for Simulating Stationary Vector Gaussian Random Fields. Stochastic Environmental Research and Risk Assessment, 30, 1863-1873.
[4] Schlather, M., Malinowski, A., Menck, P.J., Oesting, M. and Strokorb, K. (2015) Analysis, Simulation and Prediction of Multivariate Random Fields with Package Random Fields.
Journal of Statistical Software, 63, 1-25. http://dx.doi.org/10.18637/jss.v063.i08
[5] Genton, M.G., Kleiber, W., et al. (2015) Cross-Covariance Functions for Multivariate Geostatistics. Statistical Science, 30, 147-163. http://dx.doi.org/10.1214/14-STS487
[6] Gaspari, G. and Cohn, S.E. (1999) Construction of Correlation Functions in Two and Three Dimensions. Quarterly Journal of the Royal Meteorological Society, 125, 723-757.
http://dx.doi.org/10.1002/qj.49712555417
[7] Wood, A.T.A. and Chan, G. (1994) Simulation of Stationary Gaussian Processes in [0, 1]d.
Journal of Computational and Graphical Statistics, 3, 409-432.
[8] Box, G.E.P., Jenkins, G.M., Reinsel, G.C. and Ljung, G.M. (2015) Time Series Analysis: Fo-recasting and Control. John Wiley & Sons, Hoboken.
[9] Chan, G. and Wood, A.T.A. (1999) Simulation of Stationary Gaussian Vector Fields. Statis-tics and Computing, 9, 265-268. http://dx.doi.org/10.1023/A:1008903804954
[10] Chiles, J.P. and Delfiner, P. (1997) Discrete Exact Simulation by the Fourier Method. Geos-tatistics Wollongong, 96, 258-269.
[11] Dietrich, C.R. and Newsam, G.N. (1993) A Fast and Exact Method for Multidimensional Gaussian Stochastic Simulations. Water Resources Research, 29, 2861-2869.
http://dx.doi.org/10.1029/93WR01070
[12] Chilès, J.-P. and Delfiner, P. (2013) Geostatistics: Modeling Spatial Uncertainty. Mathe-matical Geosciences, 1-4.
[13] Emery, X. (2008) A Turning Bands Program for Conditional Co-Simulation of Cross-Cor- related Gaussian Random Fields. Computers & Geosciences, 34, 1850-1862.
http://dx.doi.org/10.1016/j.cageo.2007.10.007
[14] Shinozuka, M. (1971) Simulation of Multivariate and Multidimensional Random Processes.
The Journal of the Acoustical Society of America, 49, 357-368.
http://dx.doi.org/10.1121/1.1912338
[15] Alabert, F. (1987) The Practice of Fast Conditional Simulations through the Lu Decomposi-tion of the Covariance Matrix. Mathematical Geology, 19, 369-386.
http://dx.doi.org/10.1007/BF00897191
[16] Davis, M.W. (1987) Production of Conditional Simulations via the Lu Triangular Decom-position of the Covariance Matrix. Mathematical Geology, 19, 91-98.
[17] Ripley, B.D. (2009) Stochastic Simulation. Vol. 316, John Wiley & Sons,Hoboken.
[18] Gelfand, A.E. and Banerjee, S. (2010) Multivariate Spatial Process Models. In: Gelfand, A.E., Diggle, P. and Guttorp, P., Eds., Montserrat Fuentes Handbook of Spatial Statistics, CRC Press, Boca Raton, 495-515. http://dx.doi.org/10.1201/9781420072884-c28
Springer, Berlin.
[20] Andreev, R. and Lang, A. (2014) Kolmogorov-Chentsov Theorem and Differentiability of Random Fields on Manifolds. Potential Analysis, 41, 761-769.
http://dx.doi.org/10.1007/s11118-014-9392-y
[21] Mörters, P. and Peres, Y. (2010) Brownian Motion. Vol. 30, Cambridge University Press, Cambridge. http://dx.doi.org/10.1017/CBO9780511750489
[22] Cramér, H. (1940) On the Theory of Stationary Random Processes. Annals of Mathematics, 41, 215-230. http://dx.doi.org/10.2307/1968827
[23] Layman, J.W. (2001) The Hankel Transform And some of Its Properties. Journal of Integer Sequences, 4, Article 01.1.5.
[24] Lifshits, M. (2012) Lectures on Gaussian Processes. Springer, Berlin.
http://dx.doi.org/10.1007/978-3-642-24939-6
[25] Rozanov, Y. (2013) Random Fields and Stochastic Partial Differential Equations. Vol. 438, Springer, Berlin.
[26] Bertschinger, E. (2001) Multiscale Gaussian Random Fields and Their Application to Cos-mological Simulations. The Astrophysical Journal Supplement Series, 137, 1-20.
http://dx.doi.org/10.1086/322526
[27] Gneiting, T., Kleiber, W. and Schlather, M. (2012) Matérn Cross-Covariance Functions for Multivariate Random Fields. Journal of the American Statistical Association, 105, 1167- 1177. http://dx.doi.org/10.1198/jasa.2010.tm09420
Submit or recommend next manuscript to SCIRP and we will provide best service for you:
Accepting pre-submission inquiries through Email, Facebook, LinkedIn, Twitter, etc. A wide selection of journals (inclusive of 9 subjects, more than 200 journals)
Providing 24-hour high-quality service User-friendly online submission system Fair and swift peer-review system
Efficient typesetting and proofreading procedure
Display of the result of downloads and visits, as well as the number of cited articles Maximum dissemination of your research work
Submit your manuscript at: http://papersubmission.scirp.org/