ISSN Online: 2329-3292 ISSN Print: 2329-3284
The Empirical Analysis of Chinese Listed
Enterprises Cross-Border M&A Performance
Dengge Wang, Shuolong Peng
School of Business Administration, South China University of Technology, Guangzhou, China
Abstract
In recent years, Chinese enterprises have conducted cross-border M&A more and more frequently. Cross-border M&A becomes an important way to achieve interna-tionalization strategy for Chinese enterprises. In this paper, taking China’s A shares listed companies’ cross-border M&A in 2011 as samples, using the factor analysis method to conduct Principal Component Analysis of multiple financial indicators, establishing comprehensive score function of each year’s performance, we then compared and analyzed the performance before and after the M&A of listing enter-prises in China by the difference analysis table. We find that lots of cross-border M&A don’t bring significant benefits to growth, so we think that Chinese enterprises should be cautious about cross-border M&A. At last, we give some suggestions to cross-border M&A.
Keywords
Listed Enterprises, Cross-Border M&A, Performance, Factor Analysis
1. Introduction
Cross-border M&A’s essence is to restructure and configure enterprises’ resource, which is based on enterprise’s organization. Enterprises can not only achieve integra-tion of resources, but also effectively avoid internaintegra-tional trade barriers. It’s helpful to access to international markets, in order to achieve the strategic goal of internationali-zation. In recent years, cross-border M&A in Chinese enterprises has developed rapid-ly. Based on “2014 Annual China M&A market research report”, from 2007 to 2014, Chinese enterprises overseas M&A increased from 35 cases to 152, and the amount of M&A increased from 12.67 billion to 32.42 billion dollars. With domestic industrial transformation and upgrading, cross-border M&A have become an important way of gaining overseas resources technology, improving production efficiency and developing
How to cite this paper: Wang, D.G. and Peng, S.L. (2016) The Empirical Analysis of Chinese Listed Enterprises Cross-Border M&A Performance. Open Journal of Business and Management, 4, 741-750.
http://dx.doi.org/10.4236/ojbm.2016.44072 Received: September 7, 2016
Accepted: October 10, 2016 Published: October 13, 2016 Copyright © 2016 by authors and Scientific Research Publishing Inc. This work is licensed under the Creative Commons Attribution International License (CC BY 4.0).
the international market [1].
Cross-border M&A activities have a profound impact on business, so the study of M&A on the business performance is necessary. Chinese scholars have analyzed in many directions (such as ownership structure, equity incentive and agency costs). Some of them are empirical analysis. This study will examine the performance of listed com-panies in cross-border M&A by factor analysis, and make some advice.
2. Literature Review
At present, there are many domestic and foreign researches on cross-border M&A per-formance of listed companies. Mergers and acquisitions will have an impact on stock prices, financial indicators of listed companies. Mainstream research method accor-dingly divided into two categories. One is Event Study, based on change of stock price. The other is financial index method, examining changes in financial indicators.
Foreign scholars examine overseas M&A performance mainly use Event study. Gurgler. K compared enterprises which conducted cross-border M&A with other en-terprises in the United States, the United Kingdom, continental Europe, Japan, Aus-tralia, New Zealand, Canada and other countries from 1981 to 1998, found that the en-terprises which conducted cross-border M&A increased profits to some extent, while the sales revenue has declined [2]. Boubakri, Dionne, Triki found that mergers and ac-quisitions can create value for the shareholders of enterprises in the long term [3]. Chakrabarti, Gupta-Mukherjee, Jayaraman examined 1157 samples from 43 countries in 1991-2004, found that cross-border M&A’s performance was better in the long run
[4]. Aybar and Ficici studied 433 mergers and acquisitions cases and 58 cross-border M&A cases from 1991 to 2004 by event study method, claimed that it did not bring a good performance through cross-border mergers and acquisitions [5].
Chinese scholars examined the impact of cross-border mergers and acquisitions on firm performance mainly through financial index method. Li and Zhu selected 10 Chi-na A-share listed companies which occurred cross-border M&A in 2003, found that it did not significantly improve business performance [6]. Gu and Reed used market model and event study method to assess short term and long term performance of 157 Chinese enterprises. They concluded that those enterprises gained a positive wealth ef-fect from overseas M&A [7]. Dong filtered 142 enterprises which conducted cross- border M&A from 1998 to 2009, used event study method, Tobin’s Q study method and financial index method, found that cross-border mergers and acquisitions of Chi-nese enterprises had been effective on the whole [8]. Lv found that enterprises’ perfor-mance has improved significantly among the year when mergers and acquisitions hap-pened, a year after the merger situation had stabilized. He believed that enterprises’ solvency and asset management capabilities had been enhanced and offset the negative impact caused by other factors. Tian and Huang took 126 cross-border M&A events as samples to examine short term performance with event study method. They found that enterprises’ performance had been improved on the whole [9].
com-pleteness of the information is still inadequate, the stock price is subject to the manipu-lation of the banker, the stock price of listed companies cannot fully reflect the infor-mation of listed companies. At the same time, China’s securities market has reached weak form efficiency is still controversial, with long-term event study method’s defects. Therefore, this paper evaluates the long-term performance of the company’s cross-bor- der mergers and acquisitions with financial index method.
3. Research Design
Due to the changes in M&A performance will take some time to figure out, this paper will choose 3 years to examine the performance, the total period includes the previous year, the present year, first year, second year, third year, a total of five years. Then based on the financial data of samples in each year, the paper sets up the index analysis sys-tem and uses the comprehensive comparative analysis method to conduct principal component analysis on M&A performance. Next, it makes comprehensive scores on the extracted principal components according to the variance contribution rate and calcu-lates the sample companies’ comprehensive scores in each year. Last, it examines the cross-border M&A behavior’s impact on performance of listed companies in China through the difference analysis table.
3.1. Model Hypothesis
1) Consistency of financial management rules. It is assumed that all listed companies deal with the financial data in accordance with the unified regulations of the state, that is, the financial data of different listed companies are comparable.
2) Authenticity of financial statements. With the continuous strengthening of gov-ernment supervision and the policies, we assumed that the listed company’s financial statements are true and believable, evaluation index can be calculated based on publicly disclosed information of listed companies, so that subjective factors minimize the in-fluence.
3.2. Sample Selection and Data Sources
This paper establishes the following criteria to select M&A events as samples:
1) The cross-border M&A events happened between January 1st, 2011 and December 31st, 2011.
2) Acquirer is China A-shares in Shanghai and Shenzhen-listed Chinese companies. The merged party is outside of mainland China national and regional enterprises.
3) The overseas M&A sample includes not only the assets acquisition, but also the equity merger and acquisition. For equity mergers and acquisitions, the actual holding ratio to reach more than 10%.
4) If a company conducted cross-border M&A many times within one year, we take it as one sample.
6) Due to differences in accounting policies, the article does not consider the cross- border M&A of financial industry.
7) Excluding the case for a number of enterprises joint acquisition.
8) Excluding the acquisition of related party transactions between Chinese compa-nies and the company’s overseas holding compacompa-nies.
9) Excluding the acquirer deals with incomplete transaction information and finan-cial data.
According to the sample selection criteria, in contrast to the Wind financial database and the investments tide official website, this paper finally get 33 sample enterprises.
3.3. Descriptive Statistics of Sample Events
1) Industry distribution of M&A enterprises
Table 1 shows the industry distribution of M&A enterprises in the event of Chinese
enterprises’ overseas mergers and acquisitions.
From Table 1, we can see that Chinese enterprises in the materials sector were the largest number of M&A events, reaching 10 cases, accounted for more than 30%; fol-lowed by industrial and information technology sector, were 5 cases, accounted for about 15%; Consumer Discretionary sector were 4 cases; energy source sector’s mergers and acquisitions were 3 cases; finally for daily consumption, health care and public util-ities, were 2 cases. It seems that Chinese enterprises overseas mergers and acquisitions events are more concentrated in some sectors.
2) Acquirer Ownership distribution
Table 2 shows the distribution of the nature of the acquirer enterprises in the event
of Chinese enterprises’ overseas mergers and acquisitions.
From Table 2, there are 15 State-owned enterprises conducting overseas mergers and acquisitions, accounting for 45%. Eighteen non state-owned enterprises conducted cross-border M&A, accounting for 55%. Both distributed more evenly.
3) Geographical distribution of the acquired company
Table 3 shows the geographical distribution of acquired company in Chinese
enter-prises overseas M&A sample of events.
As can be seen from Table 3, in the Chinese enterprises’ overseas mergers and ac-quisitions events, acquired companies in North America (USA, Canada) are the most,
Table 1. Industry distribution of M&A enterprises.
Industry Energy Materials Industrials Consumer health Discretionary staples Consumer care Information technology Utilities Number 3 10 5 4 2 2 5 2 Sources of data: Wind industry classification standards.
Table 2. Acquirer ownership distribution.
Enterprise ownership State-owned enterprises Non state-owned enterprises
reaching to 13 cases, accounting for 39.4%; followed by Europe, reaching 10 cases, ac-counting for 30.3%; followed by Oceania (Australia) and Asia, while Africa is minimal, only one case. Geographically, the acquired company is unevenly distributed, mostly concentrated in Europe, North America and other developed countries and regions.
4) Distribution of M&A transactions
Table 4 shows the distribution of M&A transactions in the event of Chinese
enter-prises’ overseas M&A.
From Table 4, it can be seen that the volume of transactions between 1 - 5 million yuan for M&A events are most. There are 10 cases, accounted for 30.3%; followed by 100 - 500 million yuan; number of transactions reached nine, accounted for 27.3%; 1000 million yuan of above are 7 cases, accounting for 21.2%. From the point of view of the distribution of transactions, the amount of Chinese enterprises’ overseas mergers and acquisitions continued to grow, more than 100 million yuan of transactions reached 19 cases; the proportion reached 57.6%. The cross-border M&A’s scale is very large.
3.4. Selection of Financial Indicators and Data Sources
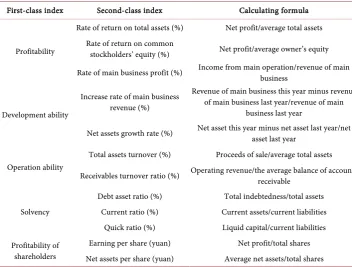
According to the annual reports of listed companies and the Ministry of Finance “En-terprise Performance Evaluation System”, this paper examines the impact on listed company’s performance by enterprises’ M&A behavior, mainly from the corporate profitability, development ability, operation ability, solvency and profitability of share-holders five aspects for a total of 12 financial indexes, specific as shown in Table 5.
Above financial data of samples are taken from Netease official website of the Shanghai and Shenzhen stock market listed company’s financial indicators, combined with the listed company financial statements of annual data in Wind financial database.
3.5. Constructions of Comprehensive Score Model
In order to facilitate the comparison of the company’s operating performance before and after M&A, this paper uses factor analysis method to construct the comprehensive score function to compress the financial indicators into a comprehensive score. Factor analysis method’s core is to extract the common factor from a number of indicators, then take the variance contribution rate of each factor as the weights and the factor scores weighted sum, in order to construct a comprehensive score function. It is:
Table 3. Geographical distribution of the acquired company.
Region Europe North America Oceania Asia Africa Number 10 13 6 3 1
Table 4. Distribution of M&A transactions.
Table 5. Comprehensive financial index.
First-class index Second-class index Calculating formula
Profitability
Rate of return on total assets (%) Net profit/average total assets Rate of return on common
stockholders’ equity (%) Net profit/average owner’s equity Rate of main business profit (%) Income from main operation/revenue of main business
Development ability
Increase rate of main business revenue (%)
Revenue of main business this year minus revenue of main business last year/revenue of main
business last year
Net assets growth rate (%) Net asset this year minus net asset last year/net asset last year
Operation ability
Total assets turnover (%) Proceeds of sale/average total assets Receivables turnover ratio (%) Operating revenue/the average balance of accounts
receivable
Solvency
Debt asset ratio (%) Total indebtedness/total assets Current ratio (%) Current assets/current liabilities
Quick ratio (%) Liquid capital/current liabilities Profitabilityof
shareholders
Earning per share (yuan) Net profit/total shares Net assets per share (yuan) Average net assets/total shares
1 1
i i i in in
ZF =W ×FAC + ⋅⋅⋅ +W ×FAC
ZFi represents the comprehensive score of the operating performance of the ith sam-ple firms, Win represents the variance contribution rate of the nth common factor of the ith sample firms, FACin for the score of the nth common factor in the ith sample firms.
4. Empirical Test and Results
This paper collates and calculates the annual financial data of sample firms to get the performance indicators that can be used for the principal component analysis by Excel software. Then through the SPSS software, in accordance with one year before M&A, the present year, the first year after mergers and acquisitions, the second year, the third year, calculated the above variables by principal component analysis. Finally, this paper calculated the comprehensive score of all sample enterprises according to the factor score functions.
4.1. Data Preprocessing
In order to evaluate the data, we must first make the indicators of the same trend. So this paper reversed the inverse indicators into positive indicators, using the inverse in-dex’s reciprocal to replace the original index values. Therefore, this paper used its reci-procal to replace the financial indicators “the asset liability ratio”.
4.2. Correlation Test
the correlation between various financial indicators in each year. The test results were shown in Table 6.
KMO statistic value is generally between 0 - 1, if the statistical indicators is between 0.5 and 1, it can conduct factor analysis. In Table 6, the critical value of KMO statistic is more than 0.5, and the significant probability of Bartlett’s spherical test is less than 0.01, which indicates that there is a significant correlation between the selected index data. Therefore it can make the factor analysis.
4.3. Principal Component Analysis
This paper analyzed the 12 indexes of sample firms in each year by factor analysis. We extracted 5 common factors in those financial data, the rotation of the cumulative va-riance contribution rate were 88.665%, 83.855%, 89.465%, 87.098%, 82.966%. They were all more than 80%. So it can be suggested that these five common factors can bas-ically reflect most information of original data. Then, according to the factor score and the variance contribution rate, five comprehensive score functions are obtained, which are denoted as ZFi. The specific form of the comprehensive score function is as follows: 1
1 2 3 4 5
42.148% 18.927% 9.776% 9.053% 8.762%
i i i i i i
ZF− = ×FAC + ×FAC + ×FAC + ×FAC + ×FAC
0
1 2 3 4 5
27.863% 23.085% 12.084% 9.941% 9.862%
i i i i i i
ZF− = ×FAC + ×FAC + ×FAC + ×FAC + ×FAC
1
1 2 3 4 5
32.075% 26.491% 11.304% 10.774% 8.820%
i i i i i i
ZF = ×FAC + ×FAC + ×FAC + ×FAC + ×FAC
2
1 2 3 4 5
26.817% 25.521% 14.233% 11.069% 9.458%
i i i i i i
ZF = ×FAC + ×FAC + ×FAC + ×FAC + ×FAC
3
1 2 3 4 5
26.845% 22.018% 15.857% 9.466% 8.778%
i i i i i i
ZF = ×FAC + ×FAC + ×FAC + ×FAC + ×FAC
According to the above five comprehensive score functions, we can calculate perfor-mance of the sample enterprises before and after cross-border M&A by comprehensive score, then compare and analyze these scores.
4.4. Evaluation Result Analysis
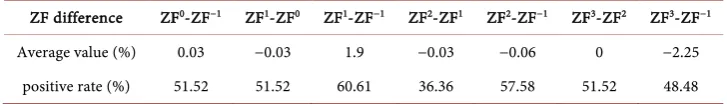
Based on the comprehensive score, this paper evaluates the operating performance of Chinese enterprises’ cross border mergers and acquisitions according to the average value and positive rate of the comprehensive score difference of the year before and af-ter the merger, and the evaluation results are shown in Table 7.
It can be seen from the table that the average operating performance of Chinese en-terprises’ cross-border mergers and acquisitions has increased by 0.03% in the year, and
Table 6. KMO and Bartlett’s test results.
Kaiser-Meyer-Olkin Measure of Sampling Adequacy −1
st year 0 year 1st year 2nd year 3rd year
0.687 0.572 0.694 0.604 0.577
Bartlett’s Test of Sphericity
Approx.
Table 7. The average value and positive rate of the comprehensive score difference of the operat-ing performance of the Sample Firms.
ZF difference ZF0-ZF−1 ZF1-ZF0 ZF1-ZF−1 ZF2-ZF1 ZF2-ZF−1 ZF3-ZF2 ZF3-ZF−1
Average value (%) 0.03 −0.03 1.9 −0.03 −0.06 0 −2.25 positive rate (%) 51.52 51.52 60.61 36.36 57.58 51.52 48.48 Note: Average value is the arithmetic mean value of comprehensive score difference ZF, and the positive or negative indicates the rise or fall of performance, and the mean value indicates the relative degree of performance change. Positive ratio is the ratio of the comprehensive score difference to the positive number of sample firms accounting for all samples.
51.52% of the enterprises had achieved the growth of performance. In the first year af-ter the merger, although 51.52% of the enaf-terprises achieved the performance’s growth, the overall average performance had declined by 0.03%. In the second year after M&A, the operating performance of the enterprise was obviously decreased, the average per-formance was down by 0.03%, and only 36.36% of the enterprise perper-formance had in-creased. In the third year after M&A, the operating performance had not changed sig-nificantly, and only 51.52% of the enterprises had achieved the performance’s growth.
5. Conclusions and Implications
In this paper, we used the accounting research method to evaluate the performance of enterprises’ mergers and acquisitions. And from the perspective of the sample firms, the performance of their M&A is not optimistic. We found that most of the sample en-terprises’ performance had increased only in the year of the merger, that is, the finan-cial situation of acquirer had improved in the short term, but it had been in a state of decline in long term. Overall, cross border mergers and acquisitions did not signifi-cantly improve the operating performance of enterprises. The conclusion of this paper has a certain reference value for Chinese enterprises to implement internationalization strategy through overseas mergers and acquisitions.
strategy for development.
When Chinese enterprises want to conduct cross-border mergers and acquisitions, first of all they should understand the local industrial policy and know about the local laws and regulations. If Chinese enterprises acquire foreign companies, what they should do is to follow the local law and make the full survey of financial, legal, business and so on. At the same time, the acquirer should have sufficient investigation and un-derstanding on target enterprises and choose target rationally. In the other hand, en-terprises should clear the purpose of M&A and do not conduct mergers and acquisi-tions blindly, only for international expansion. In addition, the integration of enter-prises after cross-border M&A is the key to success. Enterenter-prises should focus on how to realize the integration of synergies in the integration process. These things, such as strategic objectives, market, enterprise resource, enterprise operation, enterprise or-ganization, andnational and enterprise culture, should be taken into account carefully. How to allocate and combine these elements and resources is an important task for en-terprises after mergers and acquisitions [10]. And cultural integration is the most im-portant one. Since cross-border mergers and acquisitions involve different regions and countries, the enterprises must be bound to face the problem of cultural differences. Chinese enterprises should fully respect the target firm’s traditional culture and achieve the “localization” goal as much as possible. At the same time, what they should do is to draw up the cultural integration plan, establish professional team of cultural integra-tion, and finally realize the cultural integration between the acquirer and the target.
References
[1] Zhu, L. (2013) Empirical Analysis on Influencing Factors of Financial Performance of Cross-Border Mergers by China’s Listed Companies. Journal of International Trade, 8, 151- 160. http://or.nsfc.gov.cn/handle/00001903-5/116523
[2] Gurgler, K., et al. (2003) The Effects of Merger: An International Comparison. International Journal of Industrial Organization, 21, 625-653.
http://dx.doi.org/10.1016/S0167-7187(02)00107-8
[3] Boubakri, N., Dionne, G. and Triki, T. (2006) Consolidation and Value Creation in the In-surance Industry: The Role of Governance. SSRN Electronic Journal, 32, 56-68.
http://dx.doi.org/10.2139/ssrn.908660
[4] Chakrabarti, R., Gupta-Mukherjee, S. and Jayaraman, N. (2009) Mars-Venus Marriages: Culture and Cross-Border M&A. Journal of International Business Studies, 40, 216-236.
http://dx.doi.org/10.2139/ssrn.869307
[5] Aybar, B. and Ficici, A. (2009) Cross-Border Acquisitions and Firm Value: An Analysis of Emerging-Market Multinationals. Journal of International Business Studies, 40, 1317-1338.
http://dx.doi.org/10.1057/jibs.2009.15
[6] Li, P.H., Zhu, W.J. and Li, Y. (2010) The Performance of Cross-Border M&A by Chinese Listed Firms: An Empirical Analysis Based on Factor Analysis. Industrial Economic Review,
3, 140-148. http://dx.chinadoi.cn/10.3969%2fj.issn.1674-8298.2010.03.016
[7] Gu, L.L. and Robert, R. (2011) Do Chinese Acquirers Fail in Overseas M&As? Economic Research Journal, 7, 116-129.
Border M&A. Finance and Accounting Monthly, 2, 19-21.
[9] Tian, H.F., Huang, W. and Sun, G.S. (2015) An Analysis on Institutional Factors Influen-cing Cross-Border M&A Performance: Based on the Data of Chinese Listed Companies from 2000 to 2012. World Economy Studies, 6, 111-118.
[10] Ran, Z.R. (2006) The Integration Risk of Chinese Enterprises’ Cross Border Merger and Acquisition and Countermeasures. Journal of International Trade, 5, 75-79.
Submit or recommend next manuscript to SCIRP and we will provide best service for you:
Accepting pre-submission inquiries through Email, Facebook, LinkedIn, Twitter, etc. A wide selection of journals (inclusive of 9 subjects, more than 200 journals)
Providing 24-hour high-quality service User-friendly online submission system Fair and swift peer-review system
Efficient typesetting and proofreading procedure
Display of the result of downloads and visits, as well as the number of cited articles Maximum dissemination of your research work