Design and application of computer software for collecting
color data about urine reagent strips
Longcong Chen1, Hongming Tan2, Gaiqin Liu3, Changyou Chen4, Ping Chen1, Qifeng Jiang1, Bin Gao1, Xingliang Xiong1*
1Laboratory of Forensic Medicine and Biomedical Information, Chongqing Medical University, Chongqing, China
2Department of the Accident Handling, Traffic & Patrol Police Corps of Chongqing Public Security Bureau, Chongqing, China 3School of Optoelectronic Information, Chongqing University of Technology, Chongqing, China
4Office of State-Owned Assets Management, Southwest University, Chongqing, China
Email: *[email protected]
Received 26 May 2013; revised 27 June 2013; accepted 15 July 2013
Copyright © 2013 Longcong Chen et al. This is an open access article distributed under the Creative Commons Attribution License,
which permits unrestricted use, distribution, and reproduction in any medium, provided the original work is properly cited.
ABSTRACT
Urine analysis is one of the most common and useful assay means in clinic for diagnose disease, especially urinary system disease and dry chemistry method is the most convenient, common and low cost about urine analysis. To expediently and efficiently analyze the corresponding relationships between different color data and semi-quantitative results about every urine item with dry chemistry way, in this paper, the design and application of effective software that may be used to collect color data about urine reagent strips are presented. First, we introduce the design procedure of this software. Second, its realization of design is given. Third, several application examples about collecting RGB original data by RS232 inter- face are shown. Then, RGB original data can be vis- ually displayed by waveforms or curves and the data of cursor position may also be given. From the exam- ples, we could confidently draw a conclusion that it is very convenient and effective to study on the laws of color variation about reagent pieces on reagent strip and it has met our original designed demands.
Keywords:Semi-Quantitative Results; Dry Chemistry Method; Reagent Pieces; Urine Reagent Strip
1. INTRODUCTION
Urine analysis is one of the most commonly used assay means of clinical, it is not only absolutely necessary and the first choice to diagnose disease and observe curative effects about urinary system [1], but also very helpful to diagnose other diseases [2] that can lead to biochemical
component change of urine. In addition, the urine analy- sis can also be used for safety detection and initial evaluation of health status. Therefore, how to carry out urine analysis plays a major role. Though there are many way to realize urine analysis at present. For example, Liu Ji [3] uses near-infrared spectroscopy to test urine. But the most common method is by using reagent strips that have different types. For example, some have only two items, and some have eleven items on one reagent strip. As shown in Figure 1, one kind of reagent strip that has eleven items is given, and every item has corresponding reagent piece on the strip. And the main reason is that reagent strip assay has many advantages, such as low cost, simple operation and so on. Even if there is no in- strument, results can be gained through comparing with the standard color pieces by naked eyes. Its principle is that reagent pieces would take on different colors at same moment when there are different concentrations and dif- ferent types of biochemical compositions in urine. There- fore, by its color, qualitative or semi-quantitative value of some urine items or biochemical compositions, such as glucose (GLU), bilirubin (BIL), ketone (KET), spe- cific gravity (SG) ,blood (BLD), potential of hydrogen (PH), protein (PRO), urobilinogen (URO), nitrite (NIT), leukocytes (LEU),vitamin C (VC), and so on, can be ob- tained. The semi-quantitative values or testing results of urine items or biochemical compositions refer to several disperse values. For example, testing results of PRO have six values, which are negative, trace, 1+, 2+, 3+ and 4+.
Since 1950s, chemical analysis of urine began to enter into the age of dry chemistry method. And testing way of using naked eye to observe of urine reagent strip (URS) appears. However, results that are obtained through hu- man eyes comparing with the standard color pieces are
Figure 1. Urine reagent strip for eleven items.
affected by human subjective factors, and have a big error. Until this mid-century, with the rapid development of computer and automation technology, automated urine analyzer (AUA) is applied quickly. Nowadays, based on URS, AUA is in rapid development period, and it can detect multiple compositions in urine [4-6]. In additional, with progress of all kinds of technologies, AUA will test more and more biochemical compositions in urine. But one of the most important keys to getting qualitative or semi-quantitative result is the specific algorithm. The basic principle that is reflected intensity of different color light (RIDCL) is closely associated with reaction colors of various reagent pieces on URS when light radiates to zone surface of the reagent pieces on strip. And moreover, the reaction colors of reagent pieces are decided by cor- responding content of various biochemical substances in urine (CVBSU). Therefore, RIDCL is closely related to CVBSU. To get qualitative or semi-quantitative results by AUA, RIDCL is needed to be converted to digital data by special circuit or module, which mainly includes color sensor, amplifier, analog to digital conversion and so on in general. And then algorithm of AUA is able to be gained by analyzing relative digital data. However, How to obtain corresponding data about RIDCL is the precon- dition of analysis about CVBSU. Therefore, with the support of three grants project of Chongqing Yuzhong district about science and technology, we develop a color collecting module (CCM) and computer software to get the original data about RIDCL for analyzing out their algorithms. The CCM is mainly composed of amplifiers, color sensor TCS3104 and microcontroller STM 32F 103RB [7], which bases on a high-performance ARM 32-bit Cortex™-M3 CPU and has 2 × 12-bit and 1 μs A/D converters. This CCM is aimed to gain red, green and blue (RGB) analog value of RIDCL and convert them to corresponding digital data sequences, which are sent to computer through RS232, a standard serial inter- face. So designed computer software can receive the data sequences by RS232 interface. In this article, we only in- troduce design and application of this computer soft- ware in detail.
2. DESIGN
2.1. Design Procedure
Because all data is input from computer’s RS232 inter- face, which is operated by component object model (COM) in program language, it is necessary for us to acquire the original data by COM. On the whole, the
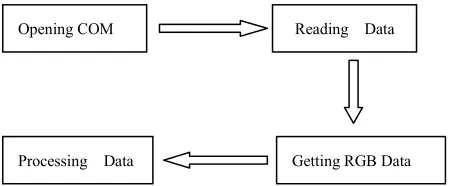
design procedure of this software, which includes four steps, is shown in Figure 2. Its functions of every step are introduced below.
1) The first step is Opening COM, which includes searching every available COM of computer for RS232 and then adding it to a list for user selecting. Finally, user can open a chose COM from the list.
2) Reading Data, the second step, is aimed at acquiring data of every frame and saving to special data buffer.
3) Getting RGB data is the third step and its goal is separating relative original RGB data sequences from the buffer.
4) The last step, the fourth step, is Processing Data, which primarily contains displaying data and data wave- forms or curves, saving RGB data to file or opening file and reading homologous RGB data, and other dispose.
2.2. Realization of Design
To realize design of this software, there are many pro- gram languages, such as Visual C++ 6.0, Delphi 6.0, Visual Basic 6.0 and C++ Builder 6.0. We select C++ Builder 6.0 to write this software because it is easy to complete this design for us. Next, the four steps are re- lated in detail.
2.2.1. Opening COM
This step mainly consists two parts, which are searching every available COM and adding them to a list, opening chose COM. In the first part, two main functions, Cre- ateFile and CloseHandle, are used. CreateFile function is applied to open a COM and returns a handle that can be used to access the object if the COM is available, or re- turns INVALID_HANDLE_VALUE that is defined in C++ builder 6.0. Therefore, according the returned value of CreateFile function, we can judge which COM is available, and if the COM can be used, then it is added to a list that is completed by a pointer of TComboBox, a class of C++ builder 6.0. Then, CloseHandle function is applied to close the opened COM. The first part program of this step is given below. Among those, “hCom” is a variable of class HANDLE and “ComSerialComport” is a pointer of TComboBox, a class of C++ builder 6.0 for listing available COMs. The COMTest function is aimed to test if the COM is able to be used, and if it is available, return value 1, or return value 0. The full program of COMTest function is given below.
BOOL COMTest (AnsiString comname) {
{
CloseHandle (hCom); hCom = 0;
}
if(hCom ! = 0) CloseHandle (hCom);
hCom=CreateFile(comname.c_str(),GE-NERIC_READ|GENERIC_WRITE,0,NULL,OPEN_EX ISTING, 0, FILE_FLAG_OVERLAPPED, NULL);
if (hCom == INVALID_HANDLE_VALUE) {
CloseHandle(hCom); hCom = 0;
return 0; }
else{
CloseHandle(hCom); hCom = 0;
return 1; } }
When we want to acquire the list of available COM, we can click button “FindCOM” and the following func- tion, FindCOMClick, would be executed, and its full program is listed below.
void __fastcall TForm1::FindCOMClick(TObject *Sender)
{
AnsiString comn = “COM”; BYTE i,j = 0;
ComSerialComport- > Items- > Clear(); for (I = 1;I < 15;i++)
{
if (COMTest (comn + IntToStr(i))) {
ComSerialComport->Items->Add(comn+IntToStr(i)); j=i;
} }
if(j)ComSerialComport- > ItemIndex = 0; }
After the first part of Opening COM, we can select a COM that the hardware, CCM, connects by RS232 in- terface. Then, chose COM can be opened by CreateFile function, setting band rate can be completed by Set- CommState Function. Thus, the second part of this step is realized.
2.2.2. Reading Data
This step is for getting all data of every frame and saving them to assigned data buffer. In this step, we mainly ap- plied Timer1 and ReadFile function to acquire all data from every frame. Timer1 is a pointer of TTimer, a class of C++ builder 6.0, and it can repeatedly produce an event at same time interval and ReadFile function, which
Opening COM Reading Data
[image:3.595.312.537.84.177.2]Getting RGB Data Processing Data
Figure 2. The procedure of getting original data.
can be applied to read all data from RS232 interface, is called in this event. Gained by ReadFile function, the data include frame header, special code, original data, end and other data or code. After getting ride of frame header and other, we can get original data and save them to data buffer for next step.
2.2.3. Getting RGB Data
This third step is aimed to realize separating original RGB data sequences from special buffer. For further dis- pose, RGB data sequences are divided from special data buffer according to data’s order and format, And then they are separately saved to three data buffers, which are red data buffer (RDB), green data buffer (GDB) and blue data buffer (BDB). Thus, Getting RGB Data is com- pleted and acquired RGB data are afforded for next step, Processing Data.
2.2.4. Processing Data
This step mainly contains displaying data and data wave- forms or curves, saving RGB data to file or opening file and reading homologous RGB data and others. We use TPaintBox to display waveforms or curves of RGB data and TMemo to display RGB data. Both TPaintBox and TMemo are control of C++ builder 6.0. In this step, Polyline function, which is a function of Canvas that is a member of TPaintBox, is applied to draw RGB data waveforms or curves. At same time, SaveToFile and LoadFromFile functions, which are functions of Lines, a member of TMemo, are used to save RGB data to file and load RGB data from file.
3. APPLICATION
In order to show how to apply the software, we gave sev- eral examples of collecting color data about urine strips. The processing generally consists of the following three steps:
1) Click button “FindCOM”, and chose corresponding band rate and COM that CCM is connected to computer through RS23 interface, then click “Open” button;
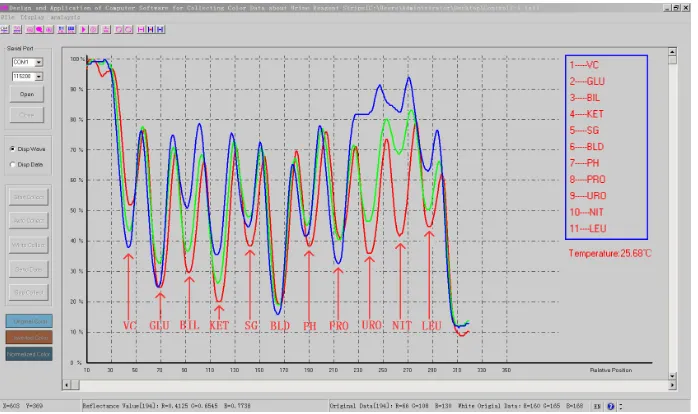
and the green shows green digital value, the blue shows blue digital value. And the positions of items, such as VC, GLU, BIL, and BLD, are manually marked with red ar- rows, and items are automatically listed on right side in Figure 3. Meanwhile, the environment temperature of testing time (ETTT) is also given in this figure. Further- more, this software also can show change curves that RGB data of every tested urine ingredient vary with time. And horizontal ordinate expresses time in second, and vertical coordinate represents rate percent of digital value about RIDCL with the white. For an example, in Figure 4, RGB data waveform for SG of human urine and ETTT are shown. By this figure, we can easily obtain the vary- ing tendency of RGB data with time.
3) Save RGB data to file with txt format through menu of this software for analyzing or opening RGB data later.
In addition, we also can directly open the correspond- ing file and then the software would display its RGB data with waveform or txt format.
This software may show relative variation curves about RGB data of RIDCL when strip shifts with same velocity under microcontroller. And horizontal ordinate expresses relative position of data in RGB data buffer, and vertical coordinate represents rate percent of digital value of RIDCL for tested pieces and white pieces. Take control I as an example, as shown in Figure 3, collected RGB data of control I, strongly positive, are displayed with corresponding color waveforms or curves. This is to
say, red waveform shows red digital value of RIDCL, To observe the difference of RGB data, we used this
[image:4.595.125.472.511.722.2]Figure 3. Data waveform of control I (strongly positive).
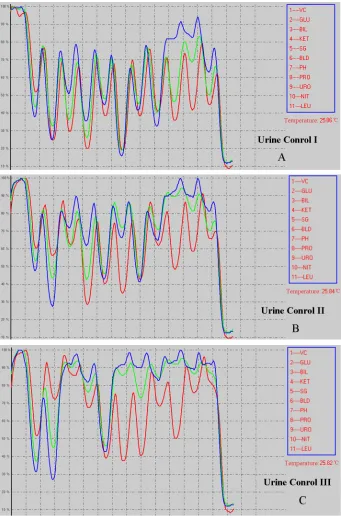
computer software to collect RGB data of three kind of control urine, which are control I (strongly positive), control II (positive) and control III (negative). The curves of RGB data about control I are shown in Figure 5(A), about control II are shown in Figure 5(B) and about control III are shown in Figure 5(C) when strips shift with same velocity. Through compared with each other, the varying tendency of RGB data about every item can be gain and qualitative results may be obtained,
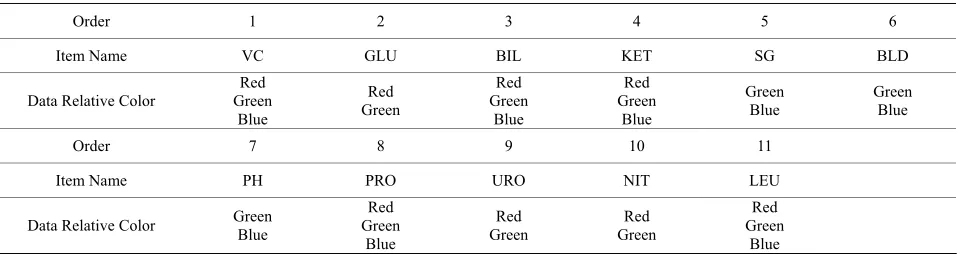
[image:5.595.128.469.204.722.2]and relationships between different color data and results of urine eleven items are easily observed out and its consequences are shown in Table 1. Take item KET as example, in Figure 5(A) for control I (strongly postive), the percents of red, green and blue data are about 20%, 27%, 36%, in Figure 5(B) for control II (positive) are about 29%, 42%, 63% and in Figure 5(C) for control III (negative) are about 68%, 78%, 82% separately. From those three group percents, it is obvious that the results
Table 1. Corresponding relationships between data colors and results of urine eleven items.
Order 1 2 3 4 5 6
Item Name VC GLU BIL KET SG BLD
Data Relative Color
Red Green
Blue
Red Green
Red Green
Blue
Red Green
Blue
Green Blue
Green Blue
Order 7 8 9 10 11
Item Name PH PRO URO NIT LEU
Data Relative Color Green Blue
Red Green
Blue
Red Green
Red Green
Red Green
Blue
are closely relative with three color data. Therefore, red, green and blue are listed about item KET in Table 1.
4. DISCUSSIONS AND CONCLUSIONS
In this paper, the design of software that is for getting the original RGB data about RIDCL is presented, and a part of the program is afforded. At the same time, some ex- amples of this software’s application about collecting RGB data of urine control I, II and III are given and it has demonstrated that it is very convenient and effective to get needed data, and the curves of RGB data are visu- ally displayed. And the data of corresponding position that are manually marked with red arrows in Figure 3 can be used to analyze relative algorithms by which qua- litative or semi-quantitative results about every item can be reached. In addition, the data of cursor position also can be displayed at the bottom of this software’s frame for further analysis when cursor is moved.
Therefore, we could confidently draw a conclusion that this software can be as a useful tool for studying on the laws of color variation about reagent pieces of items, such as LEU, SG and BLD, on reagent strip and it has met our original designed demands.
5. ACKNOWLEDGEMENTS
This work has been supported by three grants project of Chongqing Yuzhong district about science and technology, NO. 20100218. And our part work has been aided by Chongqing Teco Huayi Pharmaceuti- cal Co., Ltd.
REFERENCES
[1] Shang, X.-J., Wang Q.-J. and Wang, Z.-J. (2007) The
design of new-type urine analyzer. Development & Inno- vation of Machinery & Electrical Products, 20, 68-69.
[2] Houmsou, R.S., Kela, S.L. and Suleiman, M.M. (2011) Performance of microhaematuria and proteinuria as mea- sured by urine reagent strips in estimating intensity and prevalence of Schistosoma haematobium infection in Ni-
geria. Asian Pacific Journal of Tropical Medicine, 997-
1000.
[3] Liu, J. (2012) Principle and implementation of urine ana- lyzer with near-infrared spectroscopy. China Measure- ment & Test, 38, 64-67.
[4] Li, H.-B. (2006) The design of new urine analyzer based on CCD image sensor. Optical Technique, 32, 428-430.
[5] Ma, T., Liao, H.Y. and Huang, Z.W. (2007) Design of a miniature rapid urine analyzer based on CCD. Chinese Journal of Scientific Instrument, 28, 8-11.
[6] Lei, Y.P. and Gui, F.D. (2010) Design of urine analyzer based on STC89C516RD. Guangxi Journal of Light In- dustry, 139, 57-58.
[7] STMicroelectronics (2013) STM103XB, STM103X8, Medium-density performance line ARM-based 32-bit MCU with 64or 128 KB Flash, USB, CAN, 7 timers, 2 ADCs, 9 com, Interfaces.