What Rainfall Return Frequency?
T. V. Hromadka II1, M. Phillips1, P. Rao2, B. Espinosa3, R. Perez3, M. Barton3
1United States Military Academy, West Point, USA 2California State University, Fullerton, USA 3Hromadka and Associates, Rancho Santa Margarita, USA
Email: [email protected]
Received February 28, 2013; revised April 1, 2013; accepted April 10,2013
Copyright © 2013 T. V. Hromadka II et al. This is an open access article distributed under the Creative Commons Attribution Li-cense, which permits unrestricted use, distribution, and reproduction in any medium, provided the original work is properly cited.
ABSTRACT
In this paper, a comparison is made of available rainfall data in a localized study area of Los Angeles County, Califor- nia. This particular area has also been studied by the State of California Department of Water Resources (DWR), the National Weather Service (NWS) National Oceanographic and Atmospheric Administration (NOAA), and the Los An- geles County (LAC) Department of Public Works. All three of these cited governmental agencies independently ana- lyzed the rainfall data to identify rainfall trends for the study area, and then prepared statistical analyses in order to de- velop estimates of return frequencies for various peak durations of rainfall, among other items of interest to hydrologists. Additionally, these three agencies have available two different analyses of the available data, resulting in updates to their respective published works. Consequently, six different statistical analyses are available for comparison and as- sessment. In this paper, an examination is made of these six statistical studies and some of the differences between the various analyses are identified and explained.
Keywords: Rainfall Return Frequency; Comparison of Return Frequency Estimates; Rainfall; Rainfall Atlas
1. Introduction
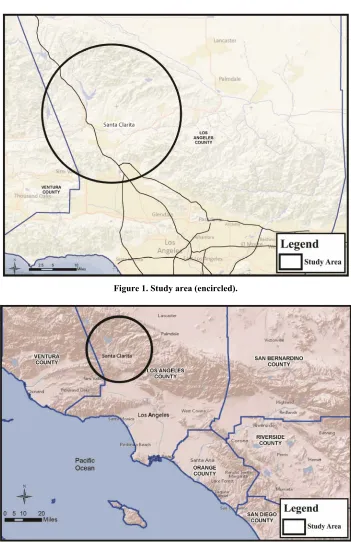
Of interest are the hydrometeorological characteristics of rainfall and their statistical trends in a particular localized study area of Los Angeles County, California. This study area is shown in Figure 1. The study area is part of a regional extent shown in Figure 2.
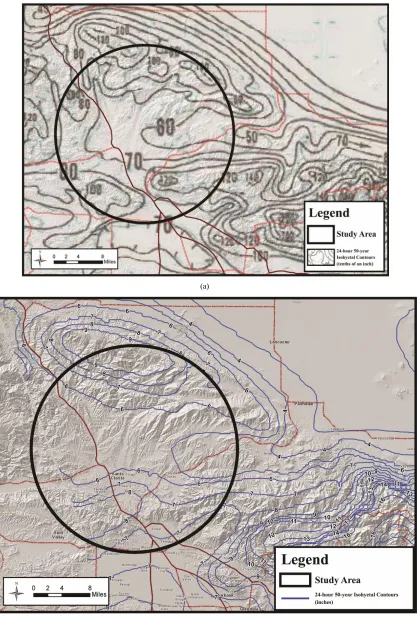
Rainfall producing wind directions tend to move in- wards from the Pacific Ocean towards the mountainous region that extends throughout the region, separating the valley area of Los Angeles from an arid region shown in the upper right portion of Figure 2. An analysis of the topography shows that the mountainous extent blocks inwards flowing moisture, causing orographic uplift, ex- cept for two topographic depressions, shown in Figure 3.
The easterly topographic depression is characterized by significantly lower rainfalls then the surrounding area (rainfall trough), a trend that is shown in both the Na- tional Weather Service (NWS) National Oceanographic and Atmospheric Administration (NOAA) and the Los Angeles County (LAC) publications; namely, the NOAA Atlas 2 (1973) and the LAC Hydrology Manual (2006) (see Figures 4(a) and (b), respectively). A third readily available statistical analysis of rainfall is provided by the State of California Department of Water Resources
(DWR). Because of the rainfall trough, statistical esti- mates of return frequencies of rainfall in the study area are complex, and consequently, the various considered three agency estimations of rainfall trends differ in the study area. In this paper, these various analyses are com- pared and difference is assessed, and possible explana- tions are suggested as to the underpinnings of these dif-ferences in statistical estimates of rainfall.
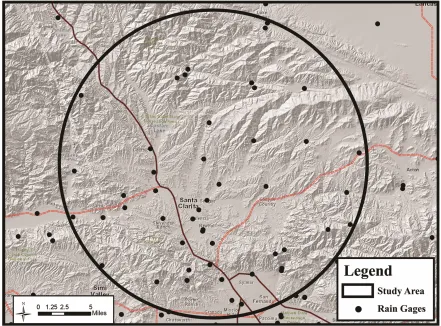
All three sources of rainfall return frequency estimates developed their respective results using the pool of rain gage information sets for the rain gages located within or in the vicinity of the study area. A summary of the rain gage characteristics available for the study area is pro- vided in Table 1. Figure 5 provides a display of the as- sembled rain gages relevant to the study area regardless of source or operating agency.
2. NOAA Publications
For the study region, two NOAA Atlas publications are available, dated 1973 [1] and 2011 [2]. These publi- cations provide rainfall return frequency estimates for various peak durations throughout large regions of the southwest United States, including the study area. The OAA statistical analysis is based upon the Generalized N
Figure 1. Study area (encircled).
Figure 2. Topographic relief map of study area and immediate vicinity.
Extreme Value (GEV) distribution, where statistical pa- rameters are estimated regionally using rainfall gages lo- cated within the region shown in Figure 5. Figures 6(a) and (b) display the rainfall gages which were used in the most recent NOAA publication and are relevant to the study area. Table 2 indicates which rain gages con- sidered in this paper were also considered in the NOAA 2011 publication.
3. DWR Publications
Figure 3. Topographic high regions and canyon relief locations.
Table 1. Rain gauge characteristics within the study area.
Gage ID Type Gage Name Source Data From Data To Data Years Elevation (ft)
42516 D Dry Canyon Reservoir NOAA 1948 1990 42 1455
390 A Bouquet Canyon LADPW 1998 2010 12 1300
SAU H Saugus CDEC 1995 2008 13 1450
372 A San Francisquito Power House No. 2 LADPW 1940 2008 68 1580
1104C D Bouquet Canyon at Texas Canyon LADPW 1950 2008 58 1760
1262 D Saugus Reclamation Plant LADPW 1986 2008 22 1150
451 D Castaic Pat Sta LADPW 1957 1969 12 1066
402 A Mint Canyon LADPW 1998 2010 12 1652
46159 H/D Newhall AP NOAA 1939 1949 10 1214
1012b A Castaic Junction LADPW 1999 2008 9 1001
1012b D Castaic Junction LADPW 1968 1999 31 1001
252 D Castaic Lake LADPW 1972 2008 36 1150
32 A Newhall-Soledad Div. Hdqtrs LADPW 1927 2008 81 1243
46162 15/H/D Newhall S FC32CE NOAA 1931 2008 77 1243
46161 D Newhall 5 NW NOAA 1996 2008 12 1765
46164 H/D Newhall US RS NOAA 1949 1968 19 1342
46165 D Newhall NOAA 1989 1996 7 1400
48014 D Saugus Power Plant 1 NOAA 1947 2012 65 2089
CP9 H Camp 9 CDEC 1997 2011 14 4000
125 D San Francisquito Canyon Power House No. LADPW 1950 2012 62 2105
1005 D Mint Canyon Fire Station LADPW 1965 2012 47 2300
WSG H Warm Springs CDEC 1991 2012 21 4020
[image:3.595.60.537.393.737.2]Continued
42735 D Elizabeth Lake Cn FC12 NOAA 1955 1972 17 2080
47220 D Radium Hot Springs NOAA 1949 1955 6 2080
NHP H Newhall Pass CDEC 2005 2012 7 2135
1263 D Valencia Reclamation Plant LADPW 1999 2008 9 1000 128 A Elizabeth Lake-Warm Springs Camp LADPW 1956 2012 56 2075
ALO H Aliso Canyon CDEC 1997 2012 15 2780
1191 D Bear Divide LADPW 1971 2008 37 2700
47762 H SAN FERNANDO PH 3 NOAA 1948 2012 64 1250
395 A Olive View Sanitarium LADPW 1981 2012 31 1425
40115 15/H/D ALISO CANYON FC 446 NOAA 1939 1991 52 2367
446 A Aliso Canyon—Oat Mountain LADPW 1941 2012 71 2367
41013 D Bouquet Canyon NOAA 1940 1978 38 3061
46942 15/H/D Piru Telematering NOAA 1969 2008 39 244
33 D Pacoima Dam LADPW 1916 2012 96 1500
46602 D PACOIMA DAM FC 33 A-E NOAA 1931 2012 81 1559
301 A Browns Canyon LADPW 1995 2012 17 2400
801 D Magic Mountain LADPW 1966 2006 40 4720
293 D Los Angeles Reservoir LADPW 1978 2012 34 1150
GMTC1 A Grass Mountain MESO 2004 2012 8 4626
405 D Soledad Canyon LADPW 1962 2012 50 2150
SFD H SANTA FELICIA DAM CDEC 1997 2012 15 1078
47759 D SAN FERNANDO NOAA 1931 1974 43 971
261 A Acton- Escondido Canyon LADPW 1970 2012 42 2960
40014 15/H/D ACTN Escondido FC261 NOAA 1931 2012 81 2960
46940 D Piru 2 ESE NOAA 1959 2012 53 730
42734 D Elizabeth Lake NOAA 1931 1955 24 3281
47973 H Santa Susana 4 NNE NOAA 1956 1958 2 1520
45256 H Magic Mountain NOAA 1948 1966 18 4450
WTK H Whitaker CDEC 1999 2012 13 4120
321 A Pine Canyon Patrol Station LADPW 1990 2012 22 3286
46891 D Pine Canyon PS FC321E NOAA 1955 1972 17 3291
Data Type: A = ALERT (logger); M = Monthly; D = Daily Data; H = Hourly Data; 15 = 15 Minute; Agency Source: MESO = Mesowest; CDEC = California Data Exchange Center; LADPW = Los Angeles Department of Public Works; NOAA = National Oceanic and Atmospheric Administration.
this paper. The DWR analysis results can be accessed at the web site http://www.water.ca.gov/floodmgmt/hafoo/ csc/climate_data [3]. (DWR return frequencies are given for 1-day intervals whereas the other agencies considered herein use 24-hour intervals. For consistency, all data were compared as 24-hour values.) Table 2 indicates which rain gages considered in this paper were also con- sidered in the DWR rainfall analysis. The DWR updates their analysis frequently, with their most current infor- mation through 2010 available upon request [4].
4. LAC Hydrology Manual
The County of Los Angeles (LAC), California provides
rainfall statistical estimates (in isohyetal map form) for the 50-year 24-hour peak duration throughout the 4083 square mile area of the County. The LAC also operates a network of rain gages and these gages are shown in the vicinity of this paper’s study area in Figures 8(a) and (b). Two versions of the Hydrology Manual are considered herein; namely, 1991 [5] and 2006 [6]. The County also published a report in 1997 [7], titled Rainfall Frequency Analysis Report, which gives additional estimates of re- turn frequencies at selected gages, chosen by the County, rather than generalized isohyetals such as shown in the hydrology manuals. Six of the County’s selected gages
(a)
(b)
[image:5.595.93.511.84.702.2]Figure 5. Rain gages within study area (all sources).
5. Comparison of Return Frequency
Rainfalls for Various Peak Durations
Because the LAC Hydrology Manual only provides pro- cedures for estimation of the peak 24-hour duration, and for the 50-year return frequency rainfall (the LAC De- sign Storm), this statistical estimate can be compared with the other publications considered. The LAC Hydro- logy Manual also provides an estimate for a four day 50-year return frequency rainfall as a fixed proportion of the peak 24-hour duration 50-year return frequency rain- fall. Table 2 shows which gages within the study area were used by each agency in their analysis. A compari- son between procedures, different dates of publication, and different data sources, all for the same study area, is provided in Tables 3 and 4, including the LAC 1997 [7] publication titled Rainfall Frequency Analysis Report.
From Tables 3 and 4, several observations are made: 1) The NOAA Atlas estimates for the considered peak durations and return frequencies are generally similar, for the study area, even though there are approximately 38 years between rainfall data analysis;
2) The DWR estimates also indicate a close similarity between the two dates of available analysis, with ap- proximately 7 years between analyses;
3) The LAC Hydrology Manual estimates show a con- siderable change in rainfall estimates with approximately 15 years between analyses.
4) The change observed in the LAC Hydrology Ma- nual for the study area indicates a significant reduction in rainfall return frequency estimates. Such a change is not observed in either of the DWR or NOAA publications.
6. Discussion of Results
Table 2. Comparison of rain gages used in various agency studies.
Gage ID Type Gage Name Source FromData Data To YearsData Elevation (ft) LACHM (Ref. 1) Atlas 14NOAA DWR
42516 D Dry Canyon Reservoir NOAA 1948 1990 42 1455 Y Y
SAU H Saugus CDEC 1995 2008 13 1450 Y
372 A San Francisquito Power House No. 2 LADPW 1940 2008 68 1580 Y Y 1262 D Saugus Reclamation Plant LADPW 1986 2008 22 1150 Y Y
451 D Castaic Pat Sta LADPW 1957 1969 12 1066 Y
46159 H/D Newhall AP NOAA 1939 1949 10 1214 Y
1012b A Castaic Junction LADPW 1999 2008 9 1001 Y
1012b D Castaic Junction LADPW 1968 1999 31 1001 Y Y
252 D Castaic Lake LADPW 1972 2008 36 1150 Y Y
32 A Newhall-Soledad Div. Hdqtrs LADPW 1927 2008 81 1243 Y Y
46162 15/H/D Newhall S FC32CE NOAA 1931 2008 77 1243 Y Y
46161 D Newhall 5 NW NOAA 1996 2008 12 1765 Y Y
48014 D Saugus Power Plant 1 NOAA 1947 2012 65 2089 Y
CP9 H Camp 9 CDEC 1997 2011 14 4000 Y
125 D San Francisquito Canyon Power House No. LADPW 1950 2012 62 2105 Y Y Y 1005 D Mint Canyon Fire Station LADPW 1965 2012 47 2300 Y
WSG H Warm Springs CDEC 1991 2012 21 4020 Y
DVL H Del Valle CDEC 1998 2008 10 1278 Y
1263 D Valencia Reclamation Plant LADPW 1999 2008 9 1000 Y Y Y 128 A Elizabeth Lake-Warm Springs Camp LADPW 1956 2012 56 2075 Y Y
1191 D Bear Divide LADPW 1971 2008 37 2700 Y
47762 H SAN FERNANDO PH 3 NOAA 1948 2012 64 1250 Y Y
395 A Olive View Sanitarium LADPW 1981 2012 31 1425 Y Y
40115 15/H/D ALISO CANYON FC 446 NOAA 1939 1991 52 2367 Y Y 446 A Aliso Canyon—Oat Mountain LADPW 1941 2012 71 2367 Y Y
41013 D Bouquet Canyon NOAA 1940 1978 38 3061 Y Y
46942 15/H/D Piru Telematering NOAA 1969 2008 39 244 Y Y
33 D Pacoima Dam LADPW 1916 2012 96 1500 Y Y
46602 D PACOIMA DAM FC 33 A-E NOAA 1931 2012 81 1559 Y Y
801 D Magic Mountain LADPW 1966 2006 40 4720 Y Y
293 D Los Angeles Reservoir LADPW 1978 2012 34 1150 Y Y
405 D Soledad Canyon LADPW 1962 2012 50 2150 Y Y Y
SFD H SANTA FELICIA DAM CDEC 1997 2012 15 1078 Y
47759 D SAN FERNANDO NOAA 1931 1974 43 971 Y
261 A Acton- Escondido Canyon LADPW 1970 2012 42 2960 Y
40014 15/H/D ACTN Escondido FC261 NOAA 1931 2012 81 2960 Y Y
46940 D Piru 2 ESE NOAA 1959 2012 53 730 Y Y
42734 D Elizabeth Lake NOAA 1931 1955 24 3281 Y
45256 H Magic Mountain NOAA 1948 1966 18 4450 Y
WTK H Whitaker CDEC 1999 2012 13 4120 Y
321 A Pine Canyon Patrol Station LADPW 1990 2012 22 3286 Y
46891 D Pine Canyon PS FC321E NOAA 1955 1972 17 3291 Y
(a)
(b)
[image:8.595.100.496.83.702.2](a)
(b)
[image:9.595.101.498.80.701.2](a)
(b)
[image:10.595.100.498.83.701.2]Table 3. Comparison of 50-year 24-hour rainfalls for rain gages located within the study area (and common to all sources of return frequency estimates).
Gage (2003) DWR (2010) DWR Change Percent Atlas 2 NOAA (1973)
NOAA Atlas 14
(2011)
Percent
Change LACHM (1991) LACHM(2006) Percent Change LACHM (1991) (1997)LAC * Percent Change
32 7.19 7.24 0.7 7.5 7.59 1.2 11.1 8.2 −26.1 11.1 7.20 −35.1
125 5.87 5.90 0.5 7.2 7.13 −1.0 8.6 7.0 −18.6 8.6 5.69 −33.8
128 7.36 7.42 0.8 8.4 7.04 −16.2 10.5 7.1 −32.4 10.5 7.77 −26.0
372 5.72 5.82 1.7 6.8 6.79 −0.1 7.2 5.75 −20.1 7.2 5.79 −19.6
1005 4.26 4.44 4.2 5.8 5.48 −5.5 5.9 4.9 −16.9 5.9 4.06 −31.2
1012 4.90 4.88 −0.4 6.8 5.91 −13.1 9.2 5.75 −37.5 9.2 4.87 −47.1
Average 1.3 −5.8 −25.3 −32.1
*Rainfall Frequency Analysis Report, Los Angeles County Public Works, Water Conservation Division, April 1997.
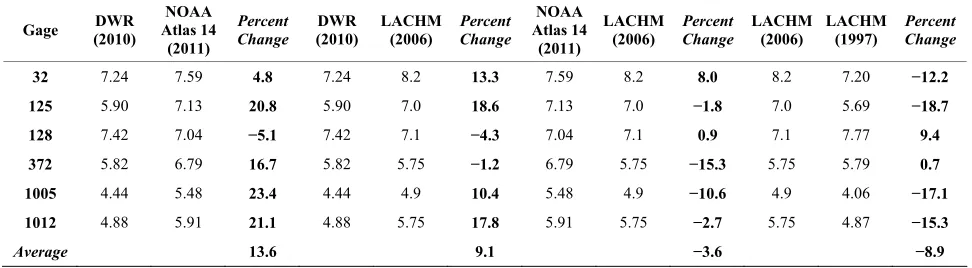
Table 4. Comparison of 50-year 24-hour rainfalls for between NOAA, LAC, and DWR.
Gage (2010) DWR
NOAA Atlas 14 (2011) Percent Change DWR (2010) LACHM (2006) Percent Change NOAA Atlas 14 (2011) LACHM (2006) Percent Change LACHM (2006) LACHM (1997) Percent Change
32 7.24 7.59 4.8 7.24 8.2 13.3 7.59 8.2 8.0 8.2 7.20 −12.2
125 5.90 7.13 20.8 5.90 7.0 18.6 7.13 7.0 −1.8 7.0 5.69 −18.7
128 7.42 7.04 −5.1 7.42 7.1 −4.3 7.04 7.1 0.9 7.1 7.77 9.4 372 5.82 6.79 16.7 5.82 5.75 −1.2 6.79 5.75 −15.3 5.75 5.79 0.7
1005 4.44 5.48 23.4 4.44 4.9 10.4 5.48 4.9 −10.6 4.9 4.06 −17.1
1012 4.88 5.91 21.1 4.88 5.75 17.8 5.91 5.75 −2.7 5.75 4.87 −15.3
Average 13.6 9.1 −3.6 −8.9
rain gage data. However, within the local vicinity of the two topographic lows, rainfall data demonstrate signifi- cantly less orographic effects than observed in the other rain gages within the study area. Because of the signifi- cant orographic effects and variations in topography wi- thin the study area, significant variations in rainfall quan- tities are observed, resulting in a challenging situation in the analysis and estimation of peak duration rainfall quantities and their respective return frequency estimates. Comparison of the said seven sources of estimates for rainfall return frequency, developed by three climatology agencies (NOAA, State of California DWR, LAC), show significant differences between agency estimates and also differences in updated reports by the individual agencies. Particularly, information from the NOAA 1973 and more recent 2011 Rainfall Atlases show minor variation in re- turn frequency rainfall estimates, as also is the case with the State of California DWR estimates, but significant decrease in rainfall estimates is seen in the LAC pub- lications. Furthermore, similarity is observed between the NOAA and DWR publication results, but significant dif- ference is seen between the LAC and the said other two agencies. Finally, significant difference is seen between the LAC rainfall isohyetal mapping and the associated LAC report for the same region under study.
[image:11.595.55.541.292.426.2]paper, but also throughout the LAC region.
7. Conclusion
An analysis of available rainfall data in a localized study area of Los Angeles, California, is presented. This par- ticular study area is also studied by the State of Califor- nia Department of Water Resources (DWR), the National Weather Service NOAA, and also the Los Angeles County (LAC) Department of Public Works. All three of these governmental agencies independently analyzed rain- fall data and prepared statistical analyses to develop es- timates of return frequencies for various peak durations of rainfall. Additionally, these three agencies have prior statistical analyses of the available rainfall data, resulting in updates to their respective published works. Conse- quently, six different statistical analyses are available for comparison and assessment. In this paper, an examina- tion is made of these six statistical studies and some of the differences between the various analyses are identi- fied. Possible explanations as to the underpinnings of the observed differences between these rainfall statistical re- sults are suggested.
8. Acknowledgements
The authors acknowledge the Department of Mathemati- cal-Sciences at the United States Military Academy, New York, for supporting faculty research in inter-disciplinary topics, among other opportunities and support as well as the academic resources available through USMA. The authors also acknowledge the Department of Civil Engi-
neering, California State University, Fullerton, for their continued faculty support towards research efforts and associated academic resources. Acknowledgment is paid to the reviewers of this paper, and the authors thank the reviewers for their comments and suggestions.
REFERENCES
[1] J. F. Miller, R. H. Frederick and R. J. Tracy, “NOAA Atlas 2 Volume 11 Precipitaion-Frequency Atlas of the Western United States, California,” National Weather Service, Silver Spring, 1973.
[2] S. Perica, et al., “NOAA Atlas 14 Precipitation-Fre- quency Atlas of the United States, Volume 6 Version 2.0: California,” US Department of Commerce, National Oce- anographic and Atmospheric Administration, National Weather Service, Silver Spring, 2011.
[3] California Department of Water Resources, “Daily Rain- fall Depth-Duration-Frequency Data,” 2003.
ftp://ftp.water.ca.gov/users/dfmhydro/Rainfall%20Dept-D uration-Frequency/Rain%20D%20DDF%20Daily/ [4] California Department of Water Resources, “Daily Rain-
fall Depth-Duration-Frequency Data,” 2011.
[5] T. A. Tidemanson, “Los Angeles County Department of Public Works Hydrology Manual,” Hydraulic/Water Con- servation Division, Alhambra, 1991.
[6] D. L. Wolfe, “Los Angeles County Department of Public Works Hydrology Manual,” Water Resources Division, Alhambra, 2006.