Capacitance Sensor for Nondestructive Determination of
Total Oil Content in Peanut Kernels
Chari V. Kandala1*, Rao C. N. Rachaputi2, Daniel O’Connor2
1Agricultural Research Service, United States Department of Agriculture, Dawson, USA 2Center for Plant Science, University of Queensland, Kingaroy, Australia
Email: *[email protected]
Received May 24, 2013; revised June 24, 2013; accepted July 2, 2013
Copyright © 2013 Chari V. Kandala et al. This is an open access article distributed under the Creative Commons Attribution License, which permits unrestricted use, distribution, and reproduction in any medium, provided the original work is properly cited.
ABSTRACT
In this work, attempts were made to estimate the total oil content (TOC) in single peanut kernels, using the CI meter (Chari’s Impedance meter, described below). Mature peanut kernels of selected varieties with a range of oil contents from 47% to 61% were placed one at a time, between the parallel-plate electrodes of the CI meter, and the impedance (Z) and phase angle () of the system were measured, and capacitance, C was computed at 1, 5 and 9 MHz. After the measurements, the TOC of each kernel was determined by Soxhlet method. Using the known TOC values, and the cor- responding C, Z and values, initially on a calibration group of kernels, calibration equations were developed. Using the model coefficients from the calibration, the TOCs of kernel samples of 31 diverse peanut genotypes grown in dif- ferent environments in Australia were determined. The method predicted the TOC values of peanut kernels of 31 peanut genotypes, within 2% of the Soxhlet values, with an R2 of 0.87 (P < 0.001).
Keywords: Impedance Analyzer; Parallel-Plate Electrodes; Capacitance; Phase Angle; Total Oil Content (TOC);
Peanuts
1. Introduction
The peanut plant is a small annual herb, belonging to the family of fabaceae of the genus Arachis, and botanically named as Arachis hypogaea. Some common names are
groundnut, earthnuts, etc. Peanut varieties with high oil content are preferred in countries where peanut oil is the predominant cooking oil. Peanut oil could also be a pre- ferred substrate for bio-diesel production in future. Pea- nut varieties with low oil content are used in making peanut snack foods. Recent studies have identified sig- nificant genetic variation in fatty acid composition, par- ticularly, content of oleic acid in peanut varieties [1]. A diet rich in oleic acid is believed to lower cholesterol levels and reduce the chance of heart disease by reducing low-density lipoproteins (LDL), while maintaining high- density lipoprotein (HDL) that slows down occurrence of atherosclerosis and may reverse the inhibitory effect of insulin production [2]. Presently, estimation of oil in peanut kernels involve Soxhlet or Soxtec1 instruments [3]
for extracting oil from a known weight of peanuts, and calculating the TOC in the test sample. These methods are costly, laborious, and more importantly involve de- structive sampling. NIR spectroscopy was used success- fully for oil analysis in many crops including soybean [4], sunflower [5], rape seeds [6], canola [7], flax seeds [8]. NIR has also been used to determine peanut fatty acids on individual peanut kernels [9]. Determination of mois- ture, oil and fatty acids composition using Near Infrared Reflectance Spectroscopy in in-shell peanuts was also attempted earlier [10]. However, NIR methods involve costly equipment, not always available to a peanut farmer, or a medium scale peanut processor.
Presently, there are no tools that would measure the TOC of peanut kernels rapidly, economically, and non- destructively. Peanuts have to be shelled and cleaned before TOC is measured, which takes time and resources. Earlier a simple, low cost instrument, called the CI meter (Chari’s Impedance meter), was designed and assembled, that could estimate the moisture content (MC) of in-shell peanuts (MC range 9% to 20%) and yellow-dent field corn (MC range 7% to 18%) [11]. In this method a sam- ple of in-shell peanuts or corn was placed between two parallel plate electrodes, and the impedance (Z) and
*Corresponding author.
1Mention of company or trade names is for the purpose of description
phase angle () of the system were measured at 1 MHz and 5 MHz. Using the measured values of Z, , the computed capacitance (C), and the MC values obtained by standard methods, semi-empirical equations were de- veloped to estimate the moisture content in peanuts and corn. In the present paper, the design and working of this low- cost radio frequency based meter that can rapidly, and nondestructively, estimate the TOC in a single pea- nut kernel is described. Such an instrument would be very useful in peanut varietal improvement as well as in processing plants around the world.
2. Materials and Methods
2.1. CI meter CircuitFor a parallel-plate capacitor with plate area A and sepa- ration D, the difference in dielectric constants at two fre- quencies can be defined as:
r1 r2 C1 C d2 0A
(1)
εr1 and εr2 are the dielectric constants of the material be- tween the plates and C1 and C2 are the capacitance of the parallel-plate system at the two frequencies. ε0 is the per- mittivity of free space (8.854 × 10⁻¹² farad/m). If the space between the parallel-plates is filled with a dielec- tric of the same A and D but with different moisture con- tents, (C1− C2) would give a good estimate of the water present in the dielectric. In the case of materials such as grain and nuts, which do not have regular shapes, two other parameters, impedance, Z and phase angle, θ were also measured at 1 and 5 MHz [12]. From the values of Z and θ, the value of C was computed for each frequency, and the differences (C1 − C2), (θ1− θ2), and (Z1 − Z2) were used in a semi-empirical equation to predict the MC. The phase angle change, (1−2) accounted for the loss factor while the dissipation factor difference, (D1 − D2) represented the quality factor of the material of the pea- nuts. While measurements of Z and θ at 1 and 5 MHz enabled the prediction of moisture content, measure- ments at 9 MHz had to be included along with 1 and 5 MHz for the determination of TOC. The differences in the values at the three frequencies, (Z1− Z2), (Z1− Z3), (θ1−θ2) and (θ1−θ3) were incorporated into an empiri- cal equation, along with (C1− C2) and (C1 − C3), from which the TOC of the sample was calculated. Since, wa- ter content of the peanut has a profound effect on capaci- tance, to estimate the oil contents, all samples were dried to bring the moisture contents to less than 8%.
Frequencies 1, 5 and 9 MHz are generated by crystal oscillators as shown in the block diagram (Figure 1) for
1 MHz. The circuits for the three frequencies are similar. These signals are applied to the electrode system alter- nately by switching through a multiplexer. Initially at 1.0 MHz, the current flowing through this system with an
Z
Rectifier e
r1
Mu
ltip
le
xer
Attenuator
Phase
Detector ep1
Oscillator Filter
Op Amp
Rr
Comparato Filter
Rectifier em1
1 MHz
5 MHz Ground
Sample Holder
[image:2.595.310.537.87.243.2]9 MHz
Figure 1. Block diagram of the CI meter circuit shown for 1 MHz.
impedance Z, is fed into an op-amp. The same current would flow through the feed-back resistor Rr. The output voltage of the op-amp and the original signal from the oscillator are rectified and measured as em1 and er1 re- spectively. The current through Z is calculated as em1/Rr and the magnitude of the impedance of the parallel-plate system with sample between them is obtained as |Z1| = Rr (er1/em1).
The phase angle at 1 MHz is determined by comparing the signal emerging out of the op-amp with that of the original signal, using a comparator and phase detector that give an output voltage ep1, proportional to the phase angle θ1 between the two. The computer then switches the multiplexer to the 5 MHz and impedance |Z2| and phase angle θ2 are measured. Similarly, at 9 MHz also, the impedance |Z3|, and phase angle θ3 are measured. From the values of Z and θ, the real and imaginary parts of the impedance R and X, at each frequency, are calcu- lated as R = |Z| Cosθ and X = |Z| Sinθ. The value of ca-pacitance C of the parallel-plate system with a sample between them is given as C = −1/2πfX, at each fre- quency.
2.2. Parallel-Plate System
The electrode system used in this study consisted of two circular plane and parallel brass electrodes, 25-mm in diameter between which the peanut kernel was held. The kernel was placed on the lower electrode and held in po- sition by the upper electrode which can be moved up and down under a light spring pressure (shown in Figure2).
Figure 2. Parallel-Plate Electrode System. The dial gauze is used to provide light spring pressure. A single peanut ker- nel is placed between the plates for the measurement of oil content.
2.3. Peanut Samples
The peanut varieties used for the study were drawn from the Australian peanut breeding program based at Kinga- roy, Queensland. The genotypes were grown using the recommended practices at the Queensland Department of Agriculture, Fisheries and Forestry (QDAFF) research facility at Kingaroy, Queensland, Australia, during No- vember 2011-May 2012 growing season. At harvest, fully mature pods were hand-picked for the study. For calibration of the CI meter, a set of five peanut genotypes, APB1, APB 2, APB3, APB4 and APB5 were selected considering the notable variations of TOC among them.
For validation, a total of 31 samples from two inde- pendent breeding trials (17 entries in set 1 and 14 in set 2) were used. The two sets of validation samples comprised of advanced breeding lines including some peanut germ- plasm used as parents. These entries were grown in the field during the 2011-12 growing season on diverse soil types under rain-fed or irrigated environments in the Wide Bay region of Queensland, Australia.
After harvesting, mature pods were separated from plant and dried at 35˚C for 3 days to bring the pod mois- ture content to about 11%. The pods were kept in cold storage (4˚C) at the QDAFF laboratories, Kingaroy until further study. Two replicate samples of mature pods were drawn from each entry and shelled. Single kernels from each replicate were used for the measurements. After the measurements were made on the CI meter, each kernel was processed for determination of Total Oil Content (TOC) using Soxhlet method [13].
2.4. Measurement
A single peanut kernel of each entry was placed between
the parallel plates of the capacitance sensor shown in
Figure2. The parallel-plate sensor was connected to the
CI meter, from which the RF signals, applied through one of the plates, go through the sample, and return through the second plate into the CI meter. The CI meter measured the impedance, Z, and phase angle, θ of the returning signal, first at 1 MHz, as an analog signal. An A-D (analog to digital) convertor converted these signals into digital signals, fed them into a lap top programmed to compute the capacitance, C of the parallel-plate sys- tem, from the measured values of phase angle and im- pedance, and store all three values, Z, θ, and C for this kernel, at 1 MHz. The computer then switched the multi- plexer to allow 5 MHz signal to go through the parallel- plates, and the values of Z, θ, and C were measured and recorded at this frequency. The procedure was repeated for 9 MHz, also. Five separate measurements were made on each kernel, to represent five replications. After the measurements were completed on the CI meter, each ker- nel was processed for oil analysis, using Soxhlet extrac- tion method, to determine its total oil content (TOC). Thus, for each kernel, the average values from the five repeats were calculated for C, θ and Z, along with the TOC values, for further analysis.
2.5. Data Analysis
In the samples used for calibration the TOC values ran- ged from 47% to 61%, representing a significant geno- typic variation for the TOC. From the capacitance, phase angle and impedance values, measured at 1, 5, and 9 MHz, and the earlier determined TOC values for the samples, a regression equation was developed, using the multiple linear regression (MLR) statistical method [14]. The MLR equation had the following form:
0 1 1 2 2 1 3 3 1 2
4 1 3 5 1 2 6 1 3
2 2
7 1 2 8 1 3
2 2
9 1 2 10 1 3
TOC A A C C A C C A
A A Z Z A Z Z
A C C A C C
A A
(2)
The constants A0 to A10 of Equation (2) were deter- mined by using the SAS procedures for regression analy- sis.
The values of C, θ and Z at 1, 5 and 9 MHz were measured for the single kernels of 31 entries used for validation (i.e. 17 entries in set 1 and 14 in set 2), fol- lowing similar procedure as described for calibration samples. With these constants in Equation (2), the TOC of the validation samples were computed and compared with the TOC values determined by the standard Soxhlet method.
3. Results and Discussion
61% representing significant variability for TOC in pea- nuts. The values obtained for the constants A0….A10 in Equation (2) determined by using SAS procedures for regression analysis of the impedance measurements on the calibration kernels with the CI meter were:
0 1 2
3 4 5
6 7 8
9 10
A 6788 829, A 4 531, A 0 192,
A 3035 347, A 2463 551, A 546 441,
A 753 028, A 0 00386, A 0 099,
A 157 592, A 187 951
. . .
. .
. . .
. .
.
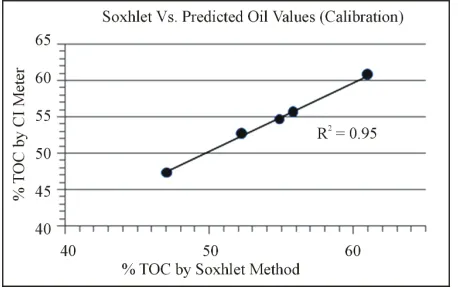
The calibration model had an R2 value of 0.95 (
Figure 3), and all the terms used in Equation (2) had a probabil-
ity of a greater absolute t value (Pr > |t|) under the null hypothesis for the variables, less than 0.0001. Thesecon- stants along with the pooled values of impedance, phase angle and capacitance were used in Equation (2) to cal- culate the TOC of each of the 5 entries for calibration of CI meter. The calculated values were averaged over the five measurements for each kernel, and were compared with their respective Soxhlet TOC values and are shown in Table 1, along with their standard deviations, and dif-
[image:4.595.59.288.393.537.2]ferences. It could be seen that the differences between the Soxhlet, and CI meter calculated (average) TOC val- ues were less than 0.5%. The standard deviations were
[image:4.595.310.536.409.570.2]Figure 3. Comparison of TOC values determined by the Soxhlet and CI meter methods for calibration group of pea- nut varieties.
Table 1. TOC of Calibration samples calculated by Equa-tion (2) (Average of five measurements for each kernel).
TOC (%) Determined by S. No.
Soxhlet CI Meter
Difference (%)
Standard Deviation
1 47.13 47.41 −0.28 2.05
2 52.32 52.64 −0.32 0.66
3 54.85 54.74 0.11 0.94
4 55.84 55.63 0.21 0.53
5 61.04 60.78 0.26 1.18
slightly higher for the lowest and highest TOC values. The standard error of calibration (SEC)2 was 1.26. The model coefficients developed from the calibration were used to predict TOC values for 31 independent samples drawn from a combination of diverse genotypes and production environments, The TOCs of the validation samples were predicted using coefficients in Equation (2) and averaged over five measurements for each kernel. It is known that, oil and fatty acids influence genotypic variability, and genotype by environmental interactions [15]. It can be seen from Figure 4 that the CI meter is
able to predict the TOCs of single kernels from a diverse set of peanut genotypes and environments with a rea- sonable accuracy (R2 = 0.87, P > 0.001). The TOC values predicted by the CI meter were all within 2% of the Sox- hlet values, except for one kernel. The difference was 2.15 for that kernel, and this measurement was deleted as an outlier for the purpose of calculating the standard er- ror of performance (SEP)3. The SEP was 1.1, comparable with the SEC of 1.2 for the 30 validation kernels. An R2 of 0.87, and a SEP of 1.1 indicate that the CI meter can be effectively used to predict the TOC of peanut kernels rapidly, and non-destructively. Such a tool could be use- ful for the preliminary screening to estimate the oil con- tent in peanuts, in peanut breeding programs, or peanut processing plants. The sensitivity of the method can be
Figure 4. Comparison of TOC values determined by the Soxtec and CI meter methods for two sets of peanut varie- ties.
2SEC =
1 2 2
1
1 1
n
i i
e
n p
where n is the number of observations, pis the number of variables in the regression equation with which the calibration is performed, and eiis the difference between the observed and reference value for the ith observation.
3SEP =
1 2 2
1
1 1
n
i i
( e e ) n
where n is the number of observations,
ei is the difference in the moisture content predicted and that
[image:4.595.57.286.616.737.2]improved by fine tuning the scanning frequencies, opti- mizing the area of parallel-plates, and also by improving the accuracy of the Soxhlet method.
4. Conclusion
This nondestructive and rapid method would be useful to the peanut breeders and the industry, for initial screening of the newly developed varieties in detecting the TOC levels. This is a physical method, and involves no chemi- cal process that is cumbersome and time consuming. The CI meter is a relatively low-cost instrument within the reach of the peanut farmer and industry. This informa- tion could be useful in categorizing the peanut varieties for appropriate usage. Knowing the TOC of the different breeds would help the breeders to quickly determine the suitability of the varieties for large scale plantation.
REFERENCES
[1] P. C. Andersen, K. Hill, D. W. Gorbet and B. V. Brodbeck, “Fatty Acid and Amino Acid Profiles of Selected Peanut Cultivars and Breeding Lines,” Journal of Food Compo- sition and Analysis, Vol. 11, No. 2, 1998, pp. 100-111. doi:10.1006/jfca.1998.0565
[2] E. K. Vassiliou, A. Gonzalez, C. Garcia, et al., “Oleic Acid and Peanut Oil High in Oleic Acid Reverse the In- hibitory Effect of Insulin Production of the Inflammatory Cytokine TNF-a Both in Vitro and in Vivo System,” Lip- ids in Health and Disease, Vol. 12, No. 8, 2009, p. 25. [3] “SOXTEC 2050,” FOSS Tecator AB, Höganäs.
[4] S. Nimaiyar, M. R. Paulsen and R. L. Nelson, “Rapid Analysis of Fatty Acids in Soybeans Using FTNIR,” ASABE Paper No.046118, American Society of Agricul- tural and Biological Engineers, St. Joseph, 2004, p. 15. [5] B. Pérez-Vich, L. Velasco and J. M. Fernández-Martínez,
“Determination of Seed Oil Content and Fatty Acid Com- position in Sunflower through the Analysis of Intact Seeds, Husked Seeds, Meal and Oil by Near-Infrared Re- flectance Spectroscopy,” Journal of the American Oil Chemists’ Society, Vol. 75, No. 5, 1998, pp. 547-555. doi:10.1007/s11746-998-0064-1
[6] L. Velasco and H. C. Becker, “Estimating the Fatty Acid Composition of the Oil in Intact Seed Rapeseed (Brassica
napus L.) by Near Infrared Reflectance Spectroscopy,”
Euphytica,Vol.101, No. 2, 1998, pp. 221-230. doi:10.1023/A:1018358707847
[7] J. K. Daun, K. M. Clear and P. Williams, “Comparison of Three Whole Seed near Infrared Analyzers for Measuring Quality Components of Canola Seed,” Journal of the American Oil Chemists’ Society, Vol. 71, No. 10, 1994, pp. 1063-1068. doi:10.1007/BF02675897
[8] R. S. Bhatty, “Measurement of Oil in Whole Flaxseed by Near-Infrared Reflectance Spectroscopy,” Journal of the American Oil Chemists’ Society, Vol.68, No. 1, 1991, pp. 34-38. doi:10.1007/BF02660306
[9] B. L. Tillman, D. W. Gorbet and G. Person, “Predicting Oleic and Linoleic Acid Content of Single Peanut Seeds Using Near-Infrared Reflectance Spectroscopy,” Crop Science, Vol. 46, No. 5, 2006, pp. 2121-2126.
doi:10.2135/cropsci2006.01.0031
[10] J. Sundaram, C. V. K. Kandala, R. A. Holser, W. R. Windham and C. L. Butts, “Determination of In-Shell Peanut Oil and Fatty Acid Composition Using Near In- frared Reflectance Spectroscopy,” Journal of the Ameri- can Oil Chemists’ Society, Vol. 87, No. 10, 2010, pp. 1103-1114. doi:10.1007/s11746-010-1589-7
[11] C. V. K. Kandala and J. Sundaram, “Nondestructive Measurement of Moisture Content Using a Parallel-Plate Capacitance Sensor for Grain and Nuts,” IEEE Sensors Journal, Vol. 10, No. 7, 2010, pp. 1282-1287.
doi:10.1109/JSEN.2010.2041446
[12] C. V. K. Kandala, C. L. Butts and S. O. Nelson, “Capaci- tance Sensor for Nondestructive Measurement of Mois- ture Content in Nuts and Grain,” IEEE Transactions on Instrumentation and Measurement, Vol. 56, No. 5, 2007, pp. 1809-1813. doi:10.1109/TIM.2007.903575
[13] Association of Official Analytical Chemists (AOAC), “Official Method of Analysis,” 15th Edition, AOAC, Ar- lington, 1990.
[14] SAS Institute, “Statistical Analysis Software for Win- dows, Version 8.1,” SAS Institute, Cary, 2000.