http://www.scirp.org/journal/jwarp ISSN Online: 1945-3108 ISSN Print: 1945-3094
DOI: 10.4236/jwarp.2016.810076 September 29, 2016
Data Exploration and Reconnaissance to
Identify Ocean Phenomena: A Guide
for
In Situ
Data Collection
*
Nadine Nassif
1#, Lena Abou Jaoude
2, Mhamad El Hage
3, Cordula A. Robinson
41Affiliat Department Environmental and Natural Resources Department, Lebanese University, Dekwaneh, Lebanon 2Department of Environment and Natural Resources, Lebanese University, Dekwaneh, Lebanon
3Department of Civil Engineering and Department of Geography (GISRS Lab.), Lebanese University, Tripoli, Lebanon 4College of Professional Studies, Northeastern University, Boston, MA, USA
Abstract
Marine pollution is a serious geoenvironmental problem affecting the Lebanese coast. It mainly affects the coastal zone adjacent to areas of dense population. To detect the sources of pollution along this zone, as well as to identify their characteris-tics, remote sensing data is used. Landsat 8 Operational Land Imager (OLI) satellite images, which have medium spatial resolution, are analyzed using ENVI 5.2 and ArcGIS 10.3.1 geospatial software for the years of 2014 and 2015. Different routines are applied to reveal anomalous features with the goal being to discriminate polluted water in the marine environment. Results showed anomalies in Akkar region. This might be due to the presence of basalts rocks, and geothermal heating, or the pollu-tion of Oustowan river that flows into the sea. The results also showed that during the dry season, there is low movement of water causing a least extension of the ano-malies. In contrary, during the wet season, rivers had an intense flow into the sea which caused an intense water movement and wide extension of anomalies on the coast. Permanently polluted coastal sites are evident in Tripoli, Kalamoun, Chekka, Batroun, Amchit, Jbeil, Jounieh, Nahr Beirut and Ouzai with the most presumed polluted months being in 2014 during April and November and in 2015 in April. The least extended pollution is during July 2014 and 2015. The length and width of each anomaly at each site shows that during the year of 2015; most of the anomalies are larger than in 2014.
Keywords
Geoenvironment, Remote Sensing, Landsat, Sea, Pollution
*Detection of marine pollution by using remote sensing all along the Lebanese coast during the years of 2014-2015 qualitatively.
How to cite this paper: Nassif, N., Jaoude, L.A., El Hage, M. and Robinson, C.A. (2016) Data Exploration and Reconnaissance to Identify Ocean Phenomena: A Guide for In Situ Data Collection. Journal of Water Re-source and Protection, 8, 929-943.
http://dx.doi.org/10.4236/jwarp.2016.810076
Received: July 24, 2016 Accepted: September 25, 2016 Published: September 29, 2016
Copyright © 2016 by authors and Scientific Research Publishing Inc. This work is licensed under the Creative Commons Attribution International License (CC BY 4.0).
1. Introduction
The growing population and the industrially based lifestyle has led to an increase in the anthropogenic impact in the world and has brought with it new water challenges in-cluding increasing water supply, inacceptable water quality in many areas, increasing number of aquatic ecosystems that are in a danger of collapse and an increasing num-ber of pollutants. The types and sources of pollutants caused by human’s activities, such as the pollution coming from industries, coastal runoff and wastewater effluents, are diverse and have a potential effect and fate on the environment and are threatening, alarmingly, the coastal areas [1] [2].
The Mediterranean region links 21 countries and attracts millions of tourists, and this has caused the environ-mental degradation in the Mediterranean sea and this de-gradation is increasing [2]. Human’s activities have transformed the Mediterranean in-to one of the most polluted seas in the world [3]. An estimated 300 million people live along the shores on the Mediterranean Sea [4]. Adding to that, it occupies an area of 3 million square kilometers [4]. Both factors explain the cause of the high amount of pollution on the coastal area. Moreover, the pollution in the Mediterranean sea is long lasting because it is almost closed [4].
In the Lebanese Mediterranean Sea, besides being affected by the pollution projected in the Mediterranean, a recent article in Beirut’s English language newspaper, the Le-banese Star noted that pollution caused by both the public and private sectors is reach-ing an alarmreach-ing level. Sadly, the Lebanese public is ignorreach-ing this problem and it is esti-mated that at least 200,000 cubic meters of untreated sewage water are being dumped into the sea per day [5]. The situation is so urgent because Lebanon is one of few coun-tries where nearly all sewage goes into the sea [5]. Lebanon’s sea pollution multiplied considerably during the 2006 war, when more than 15,000 of fuel oil spilled into the sea following the bombing of the main power station in Jieh by Israel [6]. This incident has been considered to be the country’s worse environmental nightmare. Beside this, not only sewage and industrial waste were dumped into the sea, but also thousands of tons on untreated solid wastes from a number of dumping sites, on the country’s coastline [5]. The oil spill along with decades of unsustainable coastal urbanization and unregu-lated dumping of untreated domestic and industrial waste have magnified the pollution in the sea water during the previous years [7]. The need for stopping the evolution of the pollutants nowadays in Lebanon and the need for reducing and limiting the pollu-tion in the Lebanese sea are critical. For this purpose, the Lebanese coastal area needs to be monitored in order to detect and be aware of this evolution. Several studies have been done on detecting the marine pollution by analyzing the sea water chemically and physically in Lebanon [8] and by observing the numbers of the coastal landfills such as Borj Hammoud landfill [9]. In this project, the detection and measurement of pollution in the Lebanese marine environment are realized using Remote sensing techniques. Remote sensors exhibit potentially good pollution detection capabilities because of its ability to observe a wide area at a time [10].
area of the Lebanese coast using satellite data acquired during 2014 and 2015 to detect: the frequently polluted sites by different types of pollutants; the pollution dimension to know the amount of pollutants dumped into the sea each month; the most polluted month in 2014 and 2015; and the most polluted year between 2014 and 2015.
For this purpose, this study will highlight 2 main parts that will be discussed in detail: 1) Part one, the use of remote sensing and its importance for the detection of marine pollution (2014-2015).
2) Part two, interpret and compare the Land sat images in order to obtain a clear idea about the polluted sites and the polluted months and the changes of pollution between 2014-2015.
2. Materials and Methods
2.1. Study Area
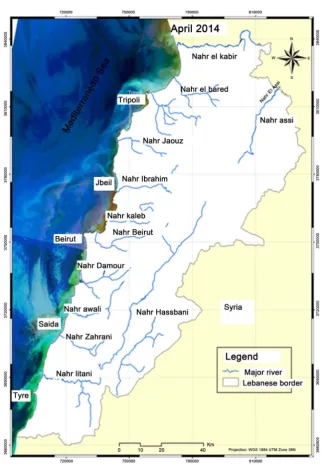
[image:3.595.264.487.452.678.2]The coastal zone and the Mount Lebanon chain are characterized by their closeness, except in the north and the south of the country. The study area (Figure 1) includes the Lebanese coastline which extends about 230 kilometers in length from the northeast border at Aarida to the southwest border at Naqoura [11]. Based on a study done by the CDR in 2005, the coastal zones represent 8% of the total Lebanese surface area which is approximately 840 km2 of the Lebanese territories. The study area includes 15 rivers [11]. These rivers transport the manmade wastes to the sea. The annual mean temper-ature in the coastal zone varies between 13.5˚C and 27˚C with an average annual rain-fall of 600 mm [12] [13]. The coastal zone has a very high population density; it was es-timated that more than 1.5 million inhabitants in the whole coastal area, which repre- sents 55 percent of the total population [11]. The major six cities that are highly popu-
lated and located directly on the coast line are from North to South: Tripoli, Jbeil, Jounieh,
Beirut, Saida, and Tyre (Figure 1) [13].
2.2. Landsat Satellite Images
Landsat satellite images are characterized by medium spatial resolution with good ca-pability to discriminate between different seawater aspects: normal versus polluted sea water [13] [14]. Two consecutive years were studied in 2014 and 2015 using Land sat OLI 8 satellite images. This approach aims to identify the pollution sources and types. The analyzed images are taken monthly for each year. This study focuses on monitor-ing change in pollution sources in space and time as well as the evaluation of the per-sistence of the identified sources. The goal of making monthly maps is to: compare the pollution changes and propagation monthly and yearly in order to monitor the changes in the types of pollutants; if the pollutants dumped into the sea have increased or de-creased; and to detect new polluted sites, permanent polluted sites and to identify the critical, at risk areas where pollution needs to be stopped. Data can be downloaded (at no charge) from Glo Vis, Earth Explorer, or via the Land sat Look Viewer within 24 hours after the acquisition. In this study, Earth Explorer was used for download. All data images selected for analysis require several processing steps. The goal of these processing steps is to increase the accuracy, the clarity and interpretability of the digital data during image analysis. In this study, images were processed using ENVI5.2 and ArcGIS 10.3.1 software. After image processing, identification of marine pollutants was performed usual visual interpretation: color, tone, texture, flow pattern, and tempera-ture differences [13] [14].
2.3. Image Processing
2.3.1. Multiband Selection
Multiband selection and it is done by interrelating three bands B4 (which is specialized for the red color), B2 (specialized for the green color) and B1 (specialized for the blue color) as one set. A 421 band combination of the coastal waters is also essential in order to identify potential pollutants and other coastal phenomena [10]-[15].
2.3.2. Image Equalization
Image equalization is used for image enhancement since it clearly discriminates differ-ent water colors and tex-tures, indicative of water quality by stretching and maximizing the features of a specific area [10]-[15].
2.3.3. Thermal Image Processing
presence of discharge that have a temperature different from the temperature of the neighboring area. This approach compliments the analysis of spectral anomalies using the RGB image and 421 band combination [16].
3. Results
Processed images from Land sat 8 OLI data showed a variety of anomalous features of the coast of Lebanon between 2014 and 2015. The different types of pollution have been identified directly from satellite images based on the anomalies in 421 band combina-tion along with density sliced thermal bands. The locacombina-tion of pollucombina-tion is made by de-tecting colors differentiation (visible contrast among the most distinguishable elements of identification) correlated with associated land features, such as the presence of land-fills next to the coast (Borj Hammoud landfill per example); the thermal differentiation of warm water such as warm water coming from power plant.
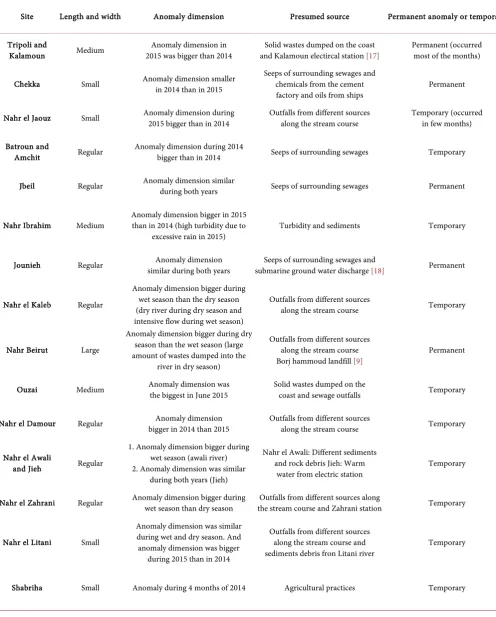
In Table 1, it was found that Akkar, Nahr el Jaouz, Nahr Ibrahim and Jounieh areas presented some unique anomalies in the maps that needs to be explained:
3.1. Akkar Area
Based on the dimension of the anomaly in Akkar, it is found that during the dry season such as June 2014, May 2015 and August 2015, the anomaly had a bigger width than during the wet season. This might be caused by the lack of water movement which al-lows the anomaly to be seen clearly. In Akkar area, an anomaly is visible every month. The anomalous could be explained as follow [19]:
Based on a research done by Shaban (2010) titled as “Geothermal Water in Lebanon: An Alternative Energy Source”, it was mentioned that in Akkar region along the Syrian border, there is a large basaltic rock plateau, and several observations for hot or warm water from springs and seepages at this area have been found. Field tests show that the average temperature of the springs ranges between 50˚C - 65˚C over various time pe-riods. Furthermore, the hydrologic phenomenon of hot and warm water is not limited to the terrestrial environment, but extends into the marine environment. It showed the presence of geothermal water in Lebanon in four major geothermal domains especially in Akkar region. The presence of geothermal water in Akkar might explain the appear-ance of anomalous features on the maps. Another explanation might cause the presence of these anomalies such as the pollution from al Oustowan river that flows into this area [19].
3.2. Nahr El Jaouz Area
Table 1. Table showing the description of the anomalies found on each site.
Site Length and width Anomaly dimension Presumed source Permanent anomaly or temporary
Tripoli and
Kalamoun Medium 2015 was bigger than 2014 Anomaly dimension in and Kalamoun electircal station [17] Solid wastes dumped on the coast Permanent (occurred most of the months)
Chekka Small Anomaly dimension smaller in 2014 than in 2015 Seeps of surrounding sewages and chemicals from the cement
factory and oils from ships Permanent
Nahr el Jaouz Small Anomaly dimension during 2015 bigger than in 2014 Outfalls from different sources along the stream course Temporary (occurred in few months)
Batroun and
Amchit Regular Anomaly dimension during 2014 bigger than in 2014 Seeps of surrounding sewages Temporary
Jbeil Regular Anomaly dimension similar during both years Seeps of surrounding sewages Permanent
Nahr Ibrahim Medium Anomaly dimension bigger in 2015 than in 2014 (high turbidity due to
excessive rain in 2015) Turbidity and sediments Temporary
Jounieh Regular similar during both years Anomaly dimension submarine ground water discharge [18] Seeps of surrounding sewages and Permanent
Nahr el Kaleb Regular
Anomaly dimension bigger during wet season than the dry season (dry river during dry season and intensive flow during wet season)
Outfalls from different sources
along the stream course Temporary
Nahr Beirut Large
Anomaly dimension bigger during dry season than the wet season (large amount of wastes dumped into the
river in dry season)
Outfalls from different sources along the stream course
Borj hammoud landfill [9] Permanent
Ouzai Medium Anomaly dimension was the biggest in June 2015 Solid wastes dumped on the coast and sewage outfalls Temporary
Nahr el Damour Regular bigger in 2014 than 2015 Anomaly dimension Outfalls from different sources along the stream course Temporary
Nahr el Awali
and Jieh Regular
1. Anomaly dimension bigger during wet season (awali river) 2. Anomaly dimension was similar
during both years (Jieh)
Nahr el Awali: Different sediments and rock debris Jieh: Warm
water from electric station Temporary
Nahr el Zahrani Regular Anomaly dimension bigger during wet season than dry season the stream course and Zahrani station Outfalls from different sources along Temporary
Nahr el Litani Small
Anomaly dimension was similar during wet and dry season. And anomaly dimension was bigger
during 2015 than in 2014
Outfalls from different sources along the stream course and
sediments debris fron Litani river Temporary
3.3. Nahr Ibrahim Area
During the wet season of 2014, Nahr Ibrahim has presented the appearance of anomaly and not during the dry season 2014. This might be due to the intensive water discharge during the wet season and its dryness during the summer. During the summer 2015, Nahr Ibrahim presented some anomalies on the maps. Similarly to Nahr el Jaouz, this might be due to the release of wastewater in the dry river.
3.4. Jounieh Area
An anomaly is visible in the thermal maps, meaning there is a differentiation in the wa-ter temperature. This might be caused by the submarine groundwawa-ter discharge present in the Jounieh area or there might be presence of warm water coming from ships that is contributing to the temperature differentiation. This anomaly only appeared in few months in 2014, but it was present during all months in 2015. This means that during 2015, Jounieh was more frequently polluted than 2014.
4. Discussion
Based on the results, it is obvious that in 2015 the pollution dimension in most of the sites such as: Tripoli, Chekka, Nahr el Jaouz, Nahr Ibrahim, Jounieh, Nahr Beirut, Ou-zai, Nahr el Awali and Jieh and Nahr el Litani was bigger than in 2014. This indicates that in 2015 there was in increase in pollution. This might be due to the lack of moni-toring and management of coastal sites leading to an increase of waste dumping along the coast. Moreover, 2015 faced lot of rainy days that led to an increase of river dis-charges in the sea causing pollution to become more widely dispersed via increase flow at the river mouth.
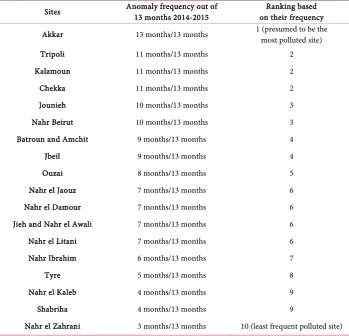
4.1. Ranking of Anomalies in the Sites Based on Their Frequencies
The following Table 2 presents the ranking of anomalies based on their frequencies, going from the presumed most polluted site to the least polluted site. The determina-tions are based on the appearance and dimension of anomalies on a monthly and an-nual basis.4.2. Influencing Factors
Overall sea current dynamics in the area are directed from the south to the north, which control the spreading regime of pollution and divert it to the north shoreline [20]. This explains why the pollution direction is directed to the north in the maps. During April 2014 and June 2014, the current was directed to the south in northern parts (Figure 2). This might be explained in a number of ways: 1) Due to the diversion of the water current caused by the river flow; 2) springs in the sea water; 3) by pollutant discharge and dispersion; 4) By short term wind.
Table 2. Ranking of the anomaly existence sites based on their frequency.
Sites Anomaly frequency out of 13 months 2014-2015 on their frequency Ranking based
Akkar 13 months/13 months 1 (presumed to be the most polluted site)
Tripoli 11 months/13 months 2
Kalamoun 11 months/13 months 2
Chekka 11 months/13 months 2
Jounieh 10 months/13 months 3
Nahr Beirut 10 months/13 months 3
Batroun and Amchit 9 months/13 months 4
Jbeil 9 months/13 months 4
Ouzai 8 months/13 months 5
Nahr el Jaouz 7 months/13 months 6
Nahr el Damour 7 months/13 months 6
Jieh and Nahr el Awali 7 months/13 months 6
Nahr el Litani 7 months/13 months 6
Nahr Ibrahim 6 months/13 months 7
Tyre 5 months/13 months 8
Nahr el Kaleb 4 months/13 months 9
Shabriha 4 months/13 months 9
Nahr el Zahrani 3 months/13 months 10 (least frequent polluted site)
cases suggest this might be caused by a certain type of pollution as opposed to turbidity and discharge [21]. Examples are provided in Figures 3 through 8 below.
4.3. Identification of Pollution Anomalies
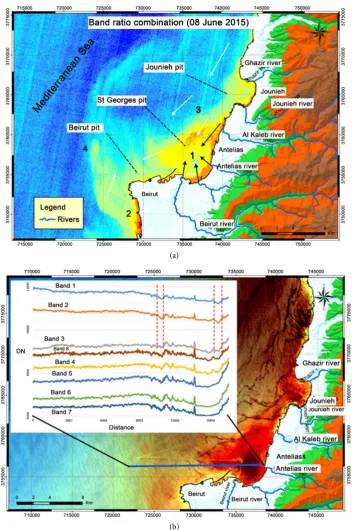
Figure 3 shows the pollution in red and yellow. Areas of interest are labeled (1), (2), (3), (4).
(1) and (2) are the areas of potential pollution; (3) marks possible oil slicks; (4) is the passage of a ship.
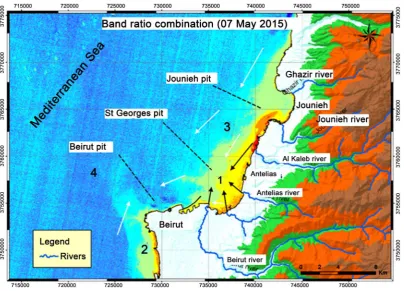
In Figure 4 it can be observed that the areas (1) and (2) of potential pollution ex-tracted from Figure 3 continue to exist however the ship and oil slicks are no longer present, possibly explaining the color differences.
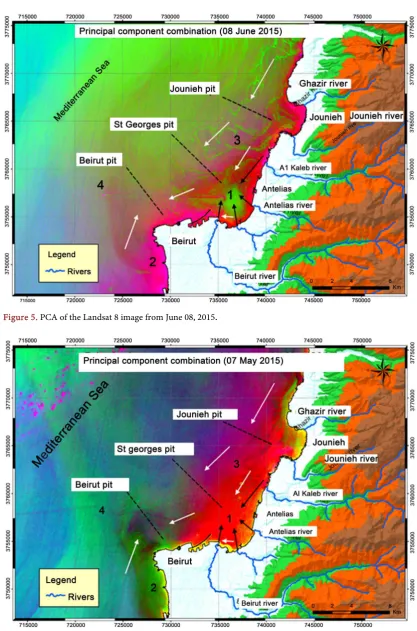
A Principal Component Analysis (PCA) was performed to enhance all uncorrelated bands and maximize any differences in ocean waters. The purpose is to emphasize po-tential pollutants. The same areas of interest are la-beled and clearly identifiable. This map gave the same information as the 421 band combination. The color contrasts are more defined and no new sources of pollution are apparent.
Figure 2. Map showing the currents directed to the south in April 2014.
It is feasible that different pollutants are being dumped between the two locations or that ocean circulation is causing them to be redistributed.
The spectral curves of all Landsat bands were examined for a profile straddling the area of pollution in site 1 in order to determine areas with strong absorption. The pre-mise was that the band with the most absorption could be divided by the 2 adjacent bands using the equation:
Figure 3. Obvious pollution at Nahr Beirut, Nahr el Kalb and Jounieh—June 2015.
[image:10.595.97.498.400.690.2]Figure 5. PCA of the Landsat 8 image from June 08, 2015.
The plots in Figure 7(b) were examined for absorption features for the polluted areas. B1 and B2 was identified as having absorption centered over the feature to be de-tected (red lines), thus is used to create the simple ratio image Figure 7(a).
(a)
(b)
[image:12.595.123.478.128.659.2]This time the blue plume in Figure 8 has dispersed and there is no longer a spike for these pollutants in site 1. This would be a good site to monitor on an operational basis for periodic dumping of polluting material. For this date, signs of pollution are re-duced.
5. Conclusions
[image:13.595.99.504.387.678.2]In order to monitor and detect the marine pollution on the Lebanese coast during the year 2014 and 2015, satellite images facilitated observation of the entire coastal region and provided valuable information concerning the detection of anomalies in this wide area of study. This detailed reconnaissance mapping helps identify those areas suscepti-ble to pollution requiring continued monitoring. These data can be used on an opera-tional basis enabling changes to be studied every 16 days. Once data are obtained, per-manent hotspots and anomalies on the whole Lebanese coast can be depicted. During the dry season, there is low movement of water causing a least extension of the anoma lies. In contrary, during the wet season, rivers had an intense flow into the sea which caused an intense water movement and wide extension of anomalies on the coast. Moreover, it could be determined that the permanent polluted coastal sites in 2014 and 2015 are Tripoli, Kalamoun, Chekka, Batroun and Amchit, Jbeil, Jounieh, Nahr Beirut and Ouzai. The other sites are not considered permanent because the pollution ap-peared intermittently.
Data that showed most of anomalies were during April and November 2014 and April 2015. Data also showed that the least appearance of anomalies were during July 2014 and July 2015 which also correlates with the dry season and the low extension of anomalies. Spatially, the length and width of each anomaly at each site was documented in order to obtain a clear idea about the dimension of each anomaly and its importance based on its size. It is clear that pollution anomalies have increased in size over time from 2014 to 2015.
In sum, utilizing satellite data to implement a national monitoring system on water quality for the Lebanese coastal environment is critical. The goal being to reduce the number of pollutants dumped into the marine environment.
Acknowledgements
Professor Nadine Nassif would like to extend her appreciation to the Fulbright scho-larship obtained at Northeastern University, College of Professional Studies. The colla-boration between the Lebanese University and Northeastern University is appreciated and ongoing.
References
[1] Fong, M. and Boarman, R. (2012) Remote Sensing of Storm Water and Wastewater Plumes in Southern California. Earthzine, Jet Propulsion Laboratory, Pasadena, California.
[2] Wen, X. (2005) Industrial Pollution. Point Source of Pollution: Local Effect and Its Control. Vol. I., Tsinghua University, Beijing, China.
[3] Green Peace (2011) The Mediterranean: An Endangered Sea. Green Peace International. [4] Tailor & Francis Group (2001) The Environment Encyclopedia and Directory, 3rd Edition,
Europa, UK.
[5] Tanhua, T., Hainbucher, D., Schroeder, K., Cardin, V., Alvarez, M. and Civitarese, G. (2013) The Mediterranean Sea System: A Review and an Introduction to the Special Issue. Ocean Science, 9, 789-803.
[6] Ministry of Environment, MoE (2010) Solid Wastes, State and Trends of the Lebanese En-vironment, Beirut, Lebanon.
[7] Ministry of Environment, MoE (2008) Oil Spill Catastrophe. Beirut, Lebanon.
[8] Green Line (2007) Lebanon Oil Spill Rapid Assessment and Response Mission, Green Line Association, Lebanon.
[9] ECODIT (2005) State and Trend of Environment of the Lebanese Environment. Ministry of Environment. Beirut, Lebanon.
[10] EDESSA (2011) Landfill Rehabilitation-Borj Hammoud. Beirut, Lebanon. [11] Exelis (2014) ENVI Classic Tutorial: A Quick Start to ENVI Classic, USA.
[12] Council for Development and Reconstruction, CDR (2005) National Physical Master Plan for the Lebanese Territory, Beirut, Lebanon.
[13] Nasrallah, H. (2007) Land Degradation in Lebanon. Proceedings of the Regional Confe-rence on Land Degradation Issues. www.escwa.org
Center, Beirut, Lebanon. http://dx.doi.org/10.1080/15275920802122296
[15] Shaban, A., Robinson, C. and El-Baz, F. (2009) Using MODIS Images and TRMM Data to Correlate Rainfall Peaks and Water Discharges from the Lebanese Coastal Rivers. Journal of Water Resource and Protection, 4, 227-236. http://dx.doi.org/10.4236/jwarp.2009.14028
[16] Falkner, E. and Morgan, D. (2002) Aerial Mapping. 2nd Edition, CRC Press Company, USA.
[17] Schowengerdt, R.A. (2007) Remote Sensing, Third Edition: Models and Methods for Image Processing. Elsevier, Arizona.
[18] Kabbara, et al. (2008) Monitoring Water Quality in the Coastal Area of Tripoli (Lebanon) Using High Resolution Satellite Data. CNRS, Beirut, Lebanon.
[19] Saad, Z., Kazpard, V. and Al Charideh, A. (2007) Use of Environmental Isotopes to Eva-luate the Sources of Submarine Springs along the South Coast of Lebanon. Center of Na-tional Scientific Research, CNRS.
[20] Shaban, A. (2010) Geothermal Water in Lebanon. An Alternative Energy Source, National Council for Scientific Research, Remote Sensing Center, Beirut, Lebanon.
[21] Shaban, A., Ghoneim, E., Hamzé, M. and Baz, F. (2007) A Post-Conflict Assessment to In-terpret the Distribution of Oil Spill Off-Shore Lebanon Using Remote Sensing. Lebanese Science Journal, 8, 75-85.
Submit or recommend next manuscript to SCIRP and we will provide best service for you:
Accepting pre-submission inquiries through Email, Facebook, LinkedIn, Twitter, etc. A wide selection of journals (inclusive of 9 subjects, more than 200 journals)
Providing 24-hour high-quality service User-friendly online submission system Fair and swift peer-review system
Efficient typesetting and proofreading procedure
Display of the result of downloads and visits, as well as the number of cited articles Maximum dissemination of your research work
Submit your manuscript at: http://papersubmission.scirp.org/