is o m e t r i c m i d t hi g h p u ll ki n e ti c s
D o s ' S a n t o s, T, L a k e , J, Jo n e s , PA a n d C o mf o r t , P
h t t p :// dx. d oi.o r g / 1 0 . 1 5 1 9 /J SC. 0 0 0 0 0 0 0 0 0 0 0 0 2 4 7 3
T i t l e Eff e c t of lo w-p a s s filt e ri n g o n iso m e t r i c m i d t hi g h p u ll ki n e ti c s
A u t h o r s D o s ' S a n t o s , T, L a k e , J, Jo n e s , PA a n d C o mf o r t , P
Typ e Ar ticl e
U RL T hi s v e r si o n is a v ail a bl e a t :
h t t p :// u sir. s alfo r d . a c . u k /i d/ e p ri n t/ 4 5 1 5 4 /
P u b l i s h e d D a t e 2 0 1 8
U S IR is a d i gi t al c oll e c ti o n of t h e r e s e a r c h o u t p u t of t h e U n iv e r si ty of S alfo r d . W h e r e c o p y ri g h t p e r m i t s , f ull t e x t m a t e r i al h el d i n t h e r e p o si t o r y is m a d e f r e ely a v ail a bl e o nli n e a n d c a n b e r e a d , d o w nl o a d e d a n d c o pi e d fo r n o
n-c o m m e r n-ci al p r iv a t e s t u d y o r r e s e a r n-c h p u r p o s e s . Pl e a s e n-c h e n-c k t h e m a n u s n-c ri p t fo r a n y f u r t h e r c o p y ri g h t r e s t r i c ti o n s .
Effect of Low-Pass Filtering on Isometric Mid-Thigh Pull Kinetics
Original Research
Thomas Dos’Santos1#, Jason Lake2
, Paul A Jones1 and Paul Comfort1
1
Human Performance Laboratory, Directorate of Sport, Exercise, and Physiotherapy,
University of Salford, Greater Manchester, United Kingdom
2
Department of Sport and Exercise Sciences, University of Chichester, Chichester, United
Kingdom
#
Corresponding Author: Thomas Dos’Santos
Telephone: +447961744517
Email: [email protected]
Brief running head: Filtering and force assessment
Abstract word count: 262 words
Manuscript word count: 3367 words
Number of tables and figures: 2 Tables and 1 Figure
Abstract
The purpose of this study was to investigate the effect of low-pass filtering on isometric
mid-thigh pull (IMTP) kinetics, including body weight (BW), onset threshold force, time-specific
force values (50, 100, 150 and 200 ms) and peak force (PF). Forty IMTP trials from
twenty-four collegiate athletes (age: 21.2 ± 1.8 years, height: 1.72 ± 0.09 m, mass: 79.4 ± 8.2 kg)
were analyzed and compared using unfiltered (UF) and low-pass filtered (LPF) (Fourth-order
Butterworth) with cut-off frequencies of 10 (LPF10) and 100 (LPF100) Hz. Significantly
lower (p < 0.001, g =-0.43 to- 0.99) onset threshold forces were produced when force data
were LPF. This led to significant (p < 0.001, g = 0.05-0.21) underestimations of time-specific
force values when LPF10 compared to UF, displaying unacceptable percentage differences
(1.2-3.3%) and unacceptable limits of agreement (LOA) (-25.4 to 100.3 N). Although
significantly different (p ≤ 0.049), trivial (g ≤ 0.04) and acceptable percentage differences
(≤0.8%) and acceptable LOA (-28.0 to 46.2 N) in time-specific force values were observed
between UF and LPF100. Statistically significant (p < 0.001), yet trivial (g ≤ 0.03), and
acceptable percentage differences (≤0.7%) and acceptable LOA (-4.7 to 33.9 N) were
demonstrated in PF between filtering conditions. No significant differences (p = 1.000) and
identical BW values were observed between filtering conditions. Low-pass filtering results in
underestimations in IMTP kinetics; however, these differences are acceptable between
LPF100 and UF, but unacceptable between LPF10 and UF (excluding PF). Filtering
procedures should be standardized when longitudinally monitoring changes in IMTP
force-time characteristics to allow valid comparisons; with analysis of UF data recommended.
Key words: peak force; time-specific force; force-time curve; smoothing; assessment
INTRODUCTION
The ability to produce high levels of force is an important quality underpinning athletic
performance (25, 30), thus methods of assessments available to evaluate the rapid force
production capabilities of athletes are of great interest to coaches. One such assessment which
permits a comprehensive examination of the rapid force production qualities of athletes is the
isometric mid-thigh pull (IMTP) (1, 10, 16, 18). The IMTP is a time efficient and potentially
safer mode of assessing maximum strength in comparison to dynamic one-repetition testing
(16). A distinct advantage of IMTP testing is the ability to examine force at-(1, 10, 16, 18),
rate of force development over- (1, 10, 16, 18), and impulse (7, 31) during critical time
intervals (50-300 ms) similar to the ground contact and contraction times of sprinting and
changing direction (11, 37). Furthermore, these IMTP kinetics have been shown to be highly
reliable within- (10, 18) and between sessions (7, 13, 15), and are commonly included in the
testing batteries of numerous sporting populations such as soccer (15) tennis (17), rugby
(8-10, 35, 36), mixed martial arts (21) and weightlifting (1, 3).
The IMTP is used to monitor and track changes in performance (16), assess neuromuscular
preparedness (17) and evaluate unilateral asymmetries (12). With this information coaches
can make informed decisions regarding an athlete’s strengths and weaknesses to subsequently
inform future prescription of training (26). However, in order to permit accurate, valid and
reliable assessments of IMTP force-time characteristics, a robust and standardized testing
methodology and appropriate force-time curve (FTC) analysis is required. Substantial
variations have been reported in IMTP testing methodologies and analysis procedures. These
include: IMTP apparatus, joint angles and body positions relative to the bar, verbal
instructions and attentional focus, sampling frequencies (500 – 1000 Hz) and onset
Thus, it is imperative that coaches consider and understand the implications of the
abovementioned factors when conducting IMTP testing.
One factor that could potentially compromise the accuracy of IMTP force-time characteristics
derived from the FTC is the application of a low-pass filter and cut-off frequency (COF)
selection. Filtering may be performed in an attempt to remove noise while preserving as
much of the signal as possible (28); however, to date, there are no recommendations on
whether to filter IMTP force-data, as a diverse range of filtering procedures have been
adopted and reported within the literature. For example, fourth-order Butterworth low-pass
filters are commonly adopted, but variations in the COFs have been reported and include 100
Hz (1, 2), 20 Hz (8, 27, 36), 16 Hz (31-33) and 10 Hz (21, 22). Additionally, previous
investigations have analysed the FTCs using rectangular smoothing with a moving half-width
of 12 (18, 24). Conversely, some researchers have analyzed unfiltered FTC data (13-15, 23),
whereas previous studies have failed to state whether filtered or unfiltered data were analyzed
(7, 9, 17, 35), thus making it difficult to facilitate methodological replication. Street et al. (29)
recommended analysis of unfiltered force-time data for the calculation of jump height during
countermovement jumping and reported underestimations in jump height of 26 and 31%
using low-pass (second-order Butterworth filter) filters with COFs of 6 and 14 Hz,
respectively. However, the effect of low-pass filtering on IMTP kinetics has yet to be
investigated.
There is a requirement therefore, for an investigation into the effects of low-pass filtering on
IMTP kinetics, as it is unknown whether different filtering procedures will affect resultant
values for IMTP kinetics. Coaches use the IMTP to assess the maximal and rapid force
production capacities of athletes and typically compare values to normative data published in
the literature. The results from this study should improve our understanding of whether to
that have adopted different filtering conditions. Thus, the aim of this study was to compare
IMTP body weight (BW), onset threshold forces, contraction start time identification,
time-specific force values (50, 100, 150 and 200 ms) and PF between unfiltered (UF) and low-pass
filtered (LPF) (Fourth-order Butterworth) force-time data. COFs of 10 (LPF10) and 100
(LPF100) Hz were investigated as these COFs have been commonly reported within the
literature (1-3, 21, 22). It was hypothesized that the highest IMTP kinetics would be
demonstrated with UF force-time data and low-pass filtered 10 Hz would produce the lowest
IMTP kinetics. It was further hypothesized that significantly greater onset threshold forces
would be observed with unfiltered force-time data and no significant differences in BW
would be observed between filtering conditions.
METHODS
Experimental approach to the problem
A retrospective analysis of forty IMTP trials from previously published data (13) which
demonstrated excellent between-session reliability measures (Intraclass correlation
coefficients = 0.84-0.97, coefficient of variation = 4.5-8.0%, standard error of measurement =
109.5-121.4 N) was performed. An a priori power analysis using G*Power (Version 3.1,
University of Dusseldorf, Germany) (16) confirmed a minimum sample size of 27 trials was
required to detect a medium effect size (0.50), a power of 0.80 and type 1 error or alpha level
of 0.05. A repeated-measures, within-subjects design was used to determine the effect of
low-pass filtering and COF on BW (weighing period force), onset threshold force, contraction
start time identification, force at 50-, 100-, 150-, 200 ms and PF. Subjects performed
maximum effort IMTPs while standing on a force plate sampling at 1000 Hz. Force-time data
were treated in three different ways.
They were either left unfiltered (UF), low-pass filtered with a COF of 10 Hz, or low-pass
filtered with a COF of 100 Hz and analyzed using a customized analysis spreadsheet. The
IMTP kinetic values were compared across filtering conditions (UF, LPF10 and LPF100) to
explore any differences in values.
Subjects
Twenty-four collegiate athletes from rowing and soccer (age: 21.2 ± 1.8 years, height: 1.72 ±
0.09 m, mass: 79.4 ± 8.2 kg) took part in this study, and were informed of the benefits and
risks of the investigation before providing informed consent to participate in this study. This
study was approved by the university institution review board. Subjects were familiar with
the IMTP protocol and had ≥ 6 months resistance training experience of the power clean and
its’ derivatives. At the time of testing subjects were mid-season in the first week of a power
mesocycle having performed a four-week maximum strength mesocycle. All testing took
place between 17:00-19:00 which coincided with normal resistance training sessions, and
subjects were required to abstain from training for 48 hours before testing and asked to
maintain a consistent fluid and dietary intake on each day of testing.
Procedures
Pre-isometric assessment warm up
All subjects performed a standardized warm up comprised of ten body weight squats and
lunges followed by two IMTP efforts at a perceived intensity of 50, and 75% of maximum
Isometric mid-thigh pull protocol
The IMTP testing was performed on a portable force plate sampling at 1000 Hz (10) (type:
9286AA, dimensions 600 mm x 400 mm, Kistler Instruments Inc., Amherst, NY, USA) using
a portable IMTP rack (Fitness Technology, Adelaide, Australia). A cold rolled steel bar was
positioned to correspond to the athlete’s second-pull power clean position just below the
crease of the hip (1). The bar height could be adjusted (3 cm increments) at various heights
above the force plate to accommodate different sized athletes. Athletes were strapped to the
bar in accordance to previous research (12) and positioned in knee and hip joint angles of
145˚(13) established in the familiarization trials, whereby feet were shoulder width apart and
under the bar, knees were flexed over the toes, shoulders were just behind the bar, and torso
was upright (10, 12). All subjects received standardized instructions to pull as “fast and as
hard as possible and push their feet directly into the force plate” until being told to stop, as
these instructions have been shown to provide optimal results (4, 19). Once the body was
stabilized (verified by watching the subject and force trace) the IMTP was initiated with the
countdown “3, 2, 1, pull,” with subjects ensuring that maximal effort was applied for five
seconds. Ground reaction force data were collected for eight seconds from the portable force
platform which was interfaced with a laptop running Bioware software (Version 5.11; Kistler
Instrument Corporation, Amherst, NY, USA). Minimal pre-tension was allowed to ensure
there was no slack in the body prior to pull initiation and subjects were instructed to be as still
as possible during the weighing period, without initiating a pull on the bar, until given the
instructions to ‘pull’. Strong verbal encouragement was given for all trials. Trials without a
stable baseline force trace during the weighing period (change in force > 50 N) were rejected
along with trials with a countermovement (decrease in body weight > 50 N) (14, 25);
subsequently, another trial was performed.
Isometric Force–Time-Curve Assessment
Raw force-time data were filtered with a fourth-order Butterworth low-pass filter using COF
of 10 and 100 Hz. These COFs were based on their application in previous research (1-3, 21,
22). Therefore, three filtering conditions were examined to determine the influence of LPF
and COF on IMTP kinetics. These were UF, LPF10 and LP100 force-time data. Low-pass
filtering was performed using an add-in for Microsoft Excel that is available online (34). The
filtered and unfiltered IMTP force-time data were inspected using a customized Microsoft
Excel spreadsheet (version 2016, Microsoft Corp., Redmond, WA, USA) to determine
specific force-time characteristics. The maximum force generated during the five second
maximum effort IMTP was reported as the absolute PF (18). Additionally, time-specific force
values of force at 50 ms (Force50), 100 ms (Force100), 150 ms (Force150) and 200 ms
(Force200) were calculated (18). The onset of the pull was determined when vertical
ground-reaction force deviated 5 SD (defined as onset threshold force) from the average body weight
during the weighing period (14). The BW (5 SD) were calculated as the average force over a
one second stationary weighing period (in mid-thigh pull position posture) prior to IMTP
initiation (14). The force plate was zeroed between each trial when participants stood off the
force plate, thus all force-time variables included body weight.
Statistical Analyses
Statistical analyses were performed using SPSS software version 23 (SPSS, Chicago, Ill,
USA) and Microsoft Excel. Normality for all variables was inspected using a Shapiro
Wilks-test and revealed all variables were parametric excluding PF and onset threshold force,
respectively. IMTP kinetics were compared across the three filtering conditions using a
repeated measures ANOVA (RMANOVA) with Bonferroni post-hoc pairwise comparisons
in cases of significant differences for parametric variables.
For non-parametric variables a Friedman’s test was used and in cases of significant
differences individual Wilcoxon sign ranked tests were used. Standardized differences were
calculated using Hedges’ g effect sizes as described previously (20) and interpreted using
Cohen’s scale (6). The mean of the difference (bias) was calculated and percentage
differences were also calculated using the formula: (UF-LPF)/UF x 100 or
(LPF100-LPF10)/LPF100 x 100. The 95% limits of agreement (LOA) (LOA: mean of the difference ±
1.96 standard deviations) were calculated between filtering conditions using methods
described by Bland and Altman (5). Percentage differences ≤ 1% were considered acceptable
(29). Statistical significance was defined p ≤ 0.05 for all tests.
RESULTS
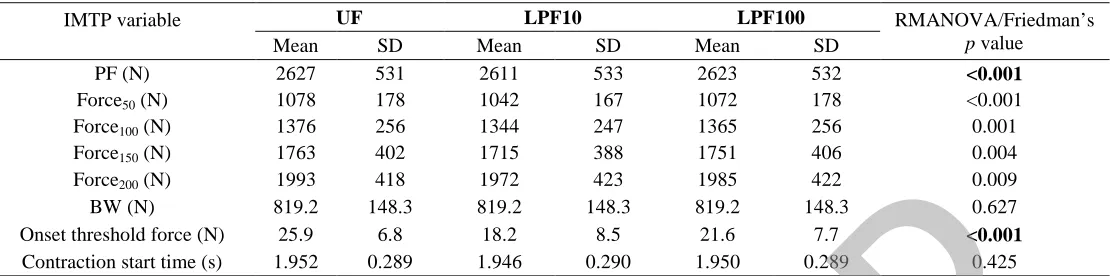
Mean ± SD are presented for all IMTP kinetics across filtering conditions in Table 1.
RMANOVA revealed filtering had no significant effect on BW with identical values
produced between conditions (Tables 1-2). RMANOVA revealed filtering had no significant
effect on contraction start time identification (Table 1). Friedman’s test revealed filtering
condition had a significant effect on onset threshold force (Table 1). Pairwise comparisons
revealed that significantly higher onset threshold forces were produced during UF conditions
(Table 2). These differences were classed as moderate to large, and they displayed
unacceptable percentage differences (17.2-32.7%) and unacceptable LOA (2.9-12.5 N)
(Table 2).
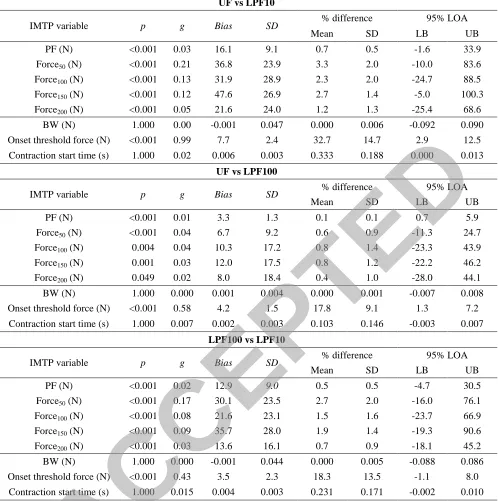
RMANOVA revealed that filtering had a significant effect on time-specific force values
(Table 1). Pairwise comparisons revealed that significantly higher time-specific force values
were produced during UF conditions compared to LPF10. (Table 2). These differences were
percentage differences (1.2-3.3%) and unacceptable LOA (-25.4 to 100.3 N) (Table 2).
Pairwise comparisons revealed that significantly higher time-specific force values were
produced during UF conditions compared to LPF100 (Table 2). However, these differences
were classed as minimal and trivial, and they displayed low bias (6.7-12 N), acceptable
percentage differences (≤ 0.8%) and acceptable LOA (-28.0 to 46.2 N) (Table 2).
Significantly higher time-specific force values were produced during LP100 compared to
LPF10 (Table 2). These differences were classed as trivial, and they displayed small bias
(13.6-30.1 N); however, acceptable percentage differences for Force200 (0.7%), whereas
unacceptable percentage differences were revealed for the other time-specific force values
(1.5-2.7%) (Table 2). Friedman’s test revealed filtering had a significant effect on PF (Table
1). Pairwise comparisons revealed that significantly higher PF values were produced during
UF conditions (Table 2). However, these differences were classed as minimal and trivial, and
they displayed low bias (3.3-12.9 N), acceptable percentage differences (≤ 0.7%) and
acceptable LOA (-4.7 to 33.9 N) (Table 2).
***Insert Table 1 about here***
***Insert Table 2 about here***
DISCUSSION
To our knowledge, this is the first study to examine the effect of low-pass filtering on IMTP
kinetics. The primary findings were underestimations in PF and time-specific force values
were produced when low-pass filtering force-time data in comparison to UF (Table 1-2);
supporting the study hypothesis. However, it is worth noting that acceptable percentage
differences and acceptable LOA were observed between UF and LP100 for all IMTP kinetics
(Table 2). Conversely, unacceptable percentage differences and unacceptable LOA in
time-specific force values were demonstrated between UF and LPF10 (Table 2).
Additionally, when the lower COF is used notably lower onset threshold forces are produced
compared to UF conditions (Table 2). However, filtering had no impact on BW with identical
values produced for all conditions (Table 2).
The present study confirmed filtering has a statistically significant effect on IMTP kinetics,
revealing different values were obtained when a low-pass filter with different COFs was
applied (Tables 1-2). These findings corroborate the results of Street et al. (29) who showed
differences in jump height and net impulse with the application of different LPF COFs. The
application of a LPF100 in comparison to UF had a statistically significant, though trivial and
minimal effect on IMTP kinetics, displaying low bias (6.7-12 N), and acceptable percentage
differences (≤ 0.8%) and acceptable LOA (Table 2). Interestingly, comparisons between UF
and LPF10 revealed PF was the only variable to achieve acceptable percentage difference
criteria (0.7%) (Table 2). Conversely, greater bias (21.6-47.6 N), and unacceptable
percentage differences (1.2-3.3%) and unacceptable LOA were observed between LPF10 and
UF conditions for time-specific force values (Table 2), indicating a stronger agreement in
IMTP time-specific force values between UF and LPF100. These findings suggest that the
IMTP force-time data should not, therefore, be low-pass filtered as underestimations in PF
and time-specific values are obtained.
The lower time-specific force values observed during the filtered conditions can be partially
attributed to the lower onset threshold forces which subsequently resulted in an earlier onset
of contraction time (Tables 1 & 2) as illustrated in Figure 1. Low-pass filtering resulted in
lower onset threshold forces by reducing the noise associated during the weighing period
calculation. This in turn, resulted in an onset of contraction start time identification on
average 0.002-0.006 seconds earlier during LPF100 and LPF10 conditions, in contrast to UF
force-time data (Table 2). Thus, the earlier onset of contraction time resulted in the
lower time-specific force values during filtered conditions and the subsequent curve values
would be less because of low-pass filtering (Figure 1).
***Insert Figure 1 about here***
The results of this study confirm different IMTP force-time values are produced when LPF
(Tables 1-2). Specifically, LPF10 results in significant and unacceptable underestimations of
IMTP kinetics in comparison to UF (Table 2). LPF100 resulted in acceptable percentage
differences in comparison to UF; however, it should be noted that these values were still
marginally lower, thus, underestimated IMTP kinetics. Previous research has applied a
LPF10 (1, 2) and LP100 (1, 2) when analyzing their force-time data, thus rationalising the
selection of these low-pass filters and COFs in the present study. But while this is the case it
may be useful to expand on the present study to explore the effect of other filtering strategies
such as rectangular smoothing with a moving half-width of 12 (18, 24) or low-pass filtering
with COF of 16 (31-33) and 20 Hz (8, 27, 36) respectively.
Nonetheless, within context of these limitations, this study found different IMTP kinetic
values are produced when different filtering conditions are applied to IMTP force-time data.
Therefore, coaches should take into consideration the filtering conditions when interpreting
and comparing published normative IMTP data. In addition, when publishing research
findings related to IMTP testing, researchers should analyze UF data or clearly state their
filtering procedures if using automated software that automatically applies a low-pass filter or
their rationale for applying a digital filter. Based on the results of this study, UF data should
be analyzed, but if coaches have started monitoring performance across a season using a
filtering procedure, they should not change this when monitoring longitudinally across the
rest of the season to ensure that the resultant variables are comparable, and not impacted by
the change in procedures.
Correct IMTP administration and analysis of the FTC is essential for obtaining accurate, valid
and reliable assessments of an athlete’s neuromuscular qualities. Previous studies have shown
that the testing apparatus can affect IMTP PF production by ~12.4% (22) and ~9.5% (9), and
that hip joint angle can influence PF and time-specific force production with small to large
effect sizes (3, 13) and percentage differences of 2.6-21.1% observed for IMTP kinetics (13).
Additionally, attentional focus can also impact PF values by ~9.0% (19), while
administration of inappropriate onset thresholds can lead to inflated time-specific force
values of ~2.0-6.0% (14). The present study observed mean percentage differences of ≤ 0.7%
and ≤ 3.3% for PF and time-specific force values between filtering conditions (Table 2).
These differences are lower than the abovementioned factors, indicating testing apparatus,
joint angle, attentional focus and onset thresholds appear to have a greater effect on IMTP
kinetics in comparison to filtering conditions. Nonetheless, low-pass filtering does influence
IMTP kinetics, producing subtle differences in values. Therefore, researchers and coaches are
recommended to standardize filtering conditions, in addition to standardizing onset threshold
(14), attentional focus (19), IMTP testing apparatus (9, 22) and joint angles (3, 13) when
longitudinally monitoring changes in athletes IMTP kinetics to allow valid comparisons.
Failure to standardize these abovementioned factors may lead to inaccurate and different
evaluations of an athlete’s rapid force production capabilities.
PRACTICAL APPLICATIONS
The results of this study reveal that slightly different values are produced when UF and LPF
IMTP force-time data are compared, with LPF data tending to reduce force values. As such,
these findings indicate that different filtering conditions should not be used interchangeably
when longitudinally monitoring changes in IMTP force-time characteristics.
Researchers and coaches are therefore advised to standardize filtering procedures (i.e. UF or
same type of filter and COF) when longitudinally monitoring changes in athlete’s isometric
force-time characteristics. Such standardization will provide greater certainty and validity
that changes in performance can be attributed to adaptation or fatigue, and are caused by
inconsistent filtering procedures. Researchers and coaches starting with IMTP testing should
not apply a low-pass filter to their force-time data, in particular with a COF selection of 10
Hz due to the underestimations in time-specific force values. Additionally, coaches should
consider the filtering procedures adopted by previous studies when comparing their data to
published normative data, as underestimations in PF (≤ 0.8%) and time specific-force values
(≤ 3.3%) are obtained when IMTP force-time data is LPF. Furthermore, researchers are
recommended that when publishing research, they clearly report their filtering procedures
(i.e. UF, type of filter and COF) due to the slight effect on IMTP kinetics, and to facilitate
methodological replication.
ACKNOWLEDGEMENTS
The authors would like to thank the athletes for their participation. No funding was received
in support of this study and the authors have no conflict of interest.
The findings of this investigation do not represent the views of the NSCA and do not
constitute endorsement of any equipment used, by the authors, or the NSCA.
REFERENCES
1. Beckham G, Mizuguchi S, Carter C, Sato K, Ramsey M, Lamont H, Hornsby G, Haff G, and Stone M. Relationships of isometric mid-thigh pull variables to weightlifting performance. J Sports Med Phys Fitness 53: 573-581, 2013.
2. Beckham G, S. Lamont H, Sato K, W. Ramsey M, and H. Stone M. Isometric strength of powerlifters in key positions of the conventional deadlift. Journal of Trainology 1: 32-35, 2012.
3. Beckham GK, Sato K, Mizuguchi S, Haff GG, and Stone MH. Effect of Body Position on Force Production During the Isometric Mid-Thigh Pull. The Journal of Strength & Conditioning Research: Published Ahead of Print, 2017.
4. Bemben MG, Clasey JL, and Massey BH. The effect of the rate of muscle contraction on the force-time curve parameters of male and female subjects. Research quarterly for exercise and sport 61: 96-99, 1990.
5. Bland JM and Altman D. Statistical methods for assessing agreement between two methods of clinical measurement. The lancet 327: 307-310, 1986.
6. Cohen J. Statistical analysis for the behavioral sciences. Hillsdale: Lawrance Erlbaum, 1988. 7. Comfort P, Jones PA, McMahon JJ, and Newton R. Effect of Knee and Trunk Angle on Kinetic
Variables During the Isometric Mid-Thigh Pull: Test-Retest Reliability. Int J Sports Physiol and Perform 10: 58-63, 2015.
8. Crewther B, Kilduff L, Cook CJ, Cunningham D, Bunce P, Bracken R, and Gaviglio C.
Relationships between salivary free testosterone and the expression of force and power in elite athletes. The Journal of sports medicine and physical fitness 52: 221-227, 2012.
9. Dobbin N, Hunwicks R, Jones B, Till K, Highton J, and Twist C. Criterion and Construct Validity of an Isometric Mid-Thigh Pull Dynamometer for Assessing Whole Body Strength in
Professional Rugby League Players. International Journal of Sports Physiology and Performance: Published Ahead of Print, 2017.
10. Dos' Santos T, Jones PA, Kelly J, McMahon JJ, Comfort P, and Thomas C. Effect of Sampling Frequency on Isometric Mid-Thigh Pull Kinetics. Int J Sports Physiol and Perform 11: 255-260, 2016.
11. Dos'Santos T, Thomas C, Jones AP, and Comfort P. Mechanical determinants of faster change of direction speed performance in male athletes. The Journal of Strength & Conditioning Research 31: 696-705, 2017.
12. Dos'Santos T, Thomas C, Jones PA, and Comfort P. Assessing muscle strength asymmetry via a unilateral stance isometric mid-thigh pull. International journal of sports physiology and performance 12: 505-511, 2017.
13. Dos'Santos T, Thomas C, Jones PA, McMahon JJ, and Comfort P. The Effect Of Hip Joint Angle On Isometric Mid-Thigh Pull Kinetics. The Journal of Strength & Conditioning Research: Published Ahead of Print, 2017.
14. Dos’Santos T, Jones PA, Comfort P, and Thomas C. Effect of Different Onset Thresholds on Isometric Mid-Thigh Pull Force-Time Variables. The Journal of Strength & Conditioning Research: Published Ahead of Print, 2017.
15. Dos’Santos T, Thomas C, Comfort P, McMahon JJ, Jones PA, Oakley NP, and Young AL. Between-Session Reliability Of Isometric Mid-Thigh Pull Kinetics And Maximal Power Clean Performance In Male Youth Soccer Players. The Journal of Strength & Conditioning Research: Published Ahead of Print, 2017.
16. Drake D, Kennedy R, and Wallace E. The Validity and Responsiveness of Isometric Lower Body Multi-Joint Tests of Muscular Strength: a Systematic Review. Sports Medicine-Open 3: 23, 2017.
17. Gescheit DT, Cormack SJ, Reid M, and Duffield R. Consecutive Days of Prolonged Tennis Match Play: Performance, Physical, and Perceptual Responses in Trained Players. International Journal of Sports Physiology & Performance 10, 2015.
18. Haff GG, Ruben RP, Lider J, Twine C, and Cormie P. A comparison of methods for determining the rate of force development during isometric midthigh clean pulls. The Journal of Strength & Conditioning Research 29: 386-395, 2015.
19. Halperin I, Williams KJ, Martin DT, and Chapman DW. The effects of attentional focusing instructions on force production during the isometric midthigh pull. The Journal of Strength & Conditioning Research 30: 919-923, 2016.
21. James LP, Beckman EM, Kelly VG, and Haff GG. The Neuromuscular Qualities of Higher and Lower-Level Mixed Martial Arts Competitors. International journal of sports physiology and performance: Published Ahead of Print, 2016.
22. James LP, Roberts LA, Haff GG, Kelly VG, and Beckman EM. The validity and reliability of a portable isometric mid-thigh clean pull. J Strength Cond Res 31: 1378-1386, 2017.
23. Khamoui AV, Brown LE, Nguyen D, Uribe BP, Coburn JW, Noffal GJ, and Tran T. Relationship between force-time and velocity-time characteristics of dynamic and isometric muscle actions. J Strength Cond Res 25: 198-204, 2011.
24. Leary BK, Statler J, Hopkins B, Fitzwater R, Kesling T, Lyon J, Phillips B, Bryner RW, Cormie P, and Haff GG. The relationship between isometric force-time curve characteristics and club head speed in recreational golfers. J Strength Cond Res 26: 2685-2697, 2012.
25. Maffiuletti NA, Aagaard P, Blazevich AJ, Folland J, Tillin N, and Duchateau J. Rate of force development: physiological and methodological considerations. European journal of applied physiology 116: 1091-1116, 2016.
26. McGuigan MR, Cormack SJ, and Gill ND. Strength and Power Profiling of Athletes: Selecting Tests and How to Use the Information for Program Design. Strength & Conditioning Journal 35: 7-14, 2013.
27. Oranchuk DJ, Robinson TL, Switaj ZJ, and Drinkwater EJ. Comparison of the Hang High-Pull and Loaded Jump Squat for the Development of Vertical Jump and Isometric Force-Time Characteristics. The Journal of Strength & Conditioning Research: Published Ahead of Print, 2017.
28. Robertson G, Caldwell G, Hamill J, Kamen G, and Whittlesey S. Research methods in biomechanics, 2E. Human Kinetics, 2013.
29. Street G, McMillan S, Board W, Rasmussen M, and Heneghan JM. Sources of error in determining countermovement jump height with the impulse method. Journal of Applied Biomechanics 17: 43-54, 2001.
30. Suchomel TJ, Nimphius S, and Stone MH. The Importance of Muscular Strength in Athletic Performance. Sports Medicine 46: 1419-1449, 2016.
31. Thomas C, Comfort P, Chiang C-Y, and Jones P. Relationship between isometric mid-thigh pull variables and sprint and change of direction performance in collegiate athletes. Journal of Trainology 4: 6-10, 2015.
32. Thomas C, Jones PA, and Comfort P. Reliability of the Dynamic Strength Index in Collegiate Athletes. Int J Sports Physiol and Perform 10: 542 -545, 2015.
33. Thomas C, Jones PA, Rothwell J, Chiang CY, and Comfort P. An Investigation into the Relationship between Maximum Isometric Strength and Vertical Jump Performance. J Strength Cond Res 29: 2176-2185, 2015.
34. Vanrenterghem J. Biomechanics Toolbar. 2016. http://www.biomechanicstoolbar.org/. Accessed 1st September/2017.
35. Wang R, Hoffman JR, Tanigawa S, Miramonti AA, La Monica MB, Beyer KS, Church DD, Fukuda DH, and Stout JR. Isometric Mid-Thigh Pull Correlates With Strength, Sprint, and Agility Performance in Collegiate Rugby Union Players. The Journal of Strength & Conditioning Research 30: 3051-3056, 2016.
36. West DJ, Owen NJ, Jones MR, Bracken RM, Cook CJ, Cunningham DJ, Shearer DA, Finn CV, Newton RU, and Crewther BT. Relationships between force time characteristics of the isometric midthigh pull and dynamic performance in professional rugby league players. J Strength Cond Res 25: 3070-3075, 2011.
37. Weyand PG, Sternlight DB, Bellizzi MJ, and Wright S. Faster top running speeds are achieved with greater ground forces not more rapid leg movements. Journal of applied physiology 89: 1991-1999, 2000.
p value Mean SD Mean SD Mean SD
PF (N) 2627 531 2611 533 2623 532 <0.001 Force50 (N) 1078 178 1042 167 1072 178 <0.001 Force100 (N) 1376 256 1344 247 1365 256 0.001 Force150 (N) 1763 402 1715 388 1751 406 0.004 Force200 (N) 1993 418 1972 423 1985 422 0.009 BW (N) 819.2 148.3 819.2 148.3 819.2 148.3 0.627 Onset threshold force (N) 25.9 6.8 18.2 8.5 21.6 7.7 <0.001
Contraction start time (s) 1.952 0.289 1.946 0.290 1.950 0.289 0.425 Key: IMTP: Isometric mid-thigh pull; LPF10: Low-pass filtered; with a cut-off frequency of 10 Hz; LPF100: Low-pass filtered; with a cut-off frequency of 100 Hz; UF: Unfiltered; Force50: Force at 50 ms; Force100: Force at 100 ms; Force150: Force at 150 ms; Force200: Force at 200 ms; BW: Body weight; (Bold denotes non-parametric)
[image:18.595.23.578.104.242.2]IMTP variable p g Bias SD % difference 95% LOA Mean SD LB UB
PF (N) <0.001 0.03 16.1 9.1 0.7 0.5 -1.6 33.9
Force50 (N) <0.001 0.21 36.8 23.9 3.3 2.0 -10.0 83.6
Force100 (N) <0.001 0.13 31.9 28.9 2.3 2.0 -24.7 88.5
Force150 (N) <0.001 0.12 47.6 26.9 2.7 1.4 -5.0 100.3
Force200 (N) <0.001 0.05 21.6 24.0 1.2 1.3 -25.4 68.6
BW (N) 1.000 0.00 -0.001 0.047 0.000 0.006 -0.092 0.090
Onset threshold force (N) <0.001 0.99 7.7 2.4 32.7 14.7 2.9 12.5
Contraction start time (s) 1.000 0.02 0.006 0.003 0.333 0.188 0.000 0.013
UF vs LPF100
IMTP variable p g Bias SD % difference 95% LOA Mean SD LB UB
PF (N) <0.001 0.01 3.3 1.3 0.1 0.1 0.7 5.9
Force50 (N) <0.001 0.04 6.7 9.2 0.6 0.9 -11.3 24.7
Force100 (N) 0.004 0.04 10.3 17.2 0.8 1.4 -23.3 43.9
Force150 (N) 0.001 0.03 12.0 17.5 0.8 1.2 -22.2 46.2
Force200 (N) 0.049 0.02 8.0 18.4 0.4 1.0 -28.0 44.1
BW (N) 1.000 0.000 0.001 0.004 0.000 0.001 -0.007 0.008
Onset threshold force (N) <0.001 0.58 4.2 1.5 17.8 9.1 1.3 7.2
Contraction start time (s) 1.000 0.007 0.002 0.003 0.103 0.146 -0.003 0.007
LPF100 vs LPF10
IMTP variable p g Bias SD % difference 95% LOA Mean SD LB UB
PF (N) <0.001 0.02 12.9 9.0 0.5 0.5 -4.7 30.5
Force50 (N) <0.001 0.17 30.1 23.5 2.7 2.0 -16.0 76.1
Force100 (N) <0.001 0.08 21.6 23.1 1.5 1.6 -23.7 66.9
Force150 (N) <0.001 0.09 35.7 28.0 1.9 1.4 -19.3 90.6
Force200 (N) <0.001 0.03 13.6 16.1 0.7 0.9 -18.1 45.2
BW (N) 1.000 0.000 -0.001 0.044 0.000 0.005 -0.088 0.086
Onset threshold force (N) <0.001 0.43 3.5 2.3 18.3 13.5 -1.1 8.0
Contraction start time (s) 1.000 0.015 0.004 0.003 0.231 0.171 -0.002 0.010 Key: IMTP: Isometric mid-thigh pull; LPF10: Low-pass filtered; with a cut-off frequency of 10 Hz; LPF100: Low-pass filtered; with a cut-off frequency of 100 Hz; UF: Unfiltered; Force50: Force at 50 ms; Force100: Force at 100 ms; Force150: Force at 150 ms; Force200: Force at 200 ms; BW: Body weight; LOA: Limits of agreement; LB: Lower bound; UB: Upper
[image:19.595.51.549.57.558.2]Figure 1. Example force-time curve illustrating the differences in onset of contraction and
force at 50 ms identification between filtering conditions