International Journal of Emerging Technology and Advanced Engineering
Website: www.ijetae.com (ISSN 2250-2459, ISO 9001:2008 Certified Journal, Volume 7, Issue 12, December 2017)
283
Maximum Power Tracking simulation for a
Low-Temperature fuel cell
Doudou N. Luta
1, Atanda K. Raji
2Cape Peninsula University of Technology, Symphony Way, Bellville 7535, South Africa
Abstract—Fuel cells are promising alternative power sources to substitute the use of fossil fuels in transportation as well as in a variety of portable and stationary applications to cover the increasing energy demand and promote cleaner environment. A diversity of these technologies is available into the market, they are distinguished based on their working temperature, reactants and electrolytes used. Amongst them, Low-Temperature Polymer Electrolyte Membrane Fuel Cell (PEMFC) is the most attractive. PEMFC display a nonlinear output characteristic due to a number of internal limits, which may cause a low efficient operation. It is therefore important to constrain the system to run at its largest power to avoid low efficiency and excessive fuel use. In this paper, a PEMFC interfaced to a DC/DC boost converter and a MPPT controller based on the incremental conductance algorithm is presented, simulated and analysed. The simulation is performed under Matlab/Simulink environment.
Keywords—Fuel Cell, PEM, Boost converter, MPPT
I. INTRODUCTION
Fuel cells are emerging technologies considered as promising alternative to substitute fossil fuel for power generation. With their gaining interest, Fuel cells show
important opportunities in applications such as
transportation, portable electronics devices and stationary power systems, etc. They offer the possibility of clean and efficient power sources with high energy density and rapid fuel recharge by converting chemical energy from an electrolytic reaction to electricity with heat and water rejection. The conversion process does not involve any
combustion, hence there is no NOx released.
A typical fuel cell comprises a negatively and positively charge electrodes named anode cathode respectively and an
electrolyte membrane [1], it produces electricity
continuously as long as the fuel and the oxidant are supplied. Hydrogen is the principal fuel or reactant while oxygen serves as an oxidant. In a fuel cell stack, cells are connected in series/parallel to obtain the desired voltage and current. Typical cell voltages range from 0.6 to 0.7 in high performance fuel cells, whereas the number of cells and their series/parallel connection dictates the stack voltage.
Several different types of reactants are used depending upon the fuel cell technology, and the most current fuel cells are [1] [2] [3] [4] [5] [6]:
Proton Exchange or Polymer Electrolytic Membrane
Fuel Cell (PEMFC),
Phosphoric Acid Fuel Cell (PAFC),
Alkaline Fuel Cell (AFC),
Molten Carbonate Fuel Cell (MCFC),
Solid Oxide Fuel Cell (SOFC) and
Direct Methanol Fuel Cell (DMFC).
From the technologies above, PEMFC, AFC and DMFC are referred to as Low-Temperature fuel cells due to their lower operating temperature, which is in the order of 60 to
900 Celsius [6] [7] [8] . The performance characteristics
such as high-power density, rapid star-up and zero or low emission make PEMFC the more attractive of fuel cell technologies.
International Journal of Emerging Technology and Advanced Engineering
Website: www.ijetae.com (ISSN 2250-2459, ISO 9001:2008 Certified Journal, Volume 7, Issue 12, December 2017)
284
The remaining of the paper is organised as follows, the next section is dedicated to the system description, modelling, section 3 gives the simulation results, and the last section deals with the conclusion.II. SYSTEM DESCRIPTION AND MODELLING
The system consists of a PEMFC stack, DC-to-DC converter and MPPT controller and PWM for the duty cycle adjustment (See Figure 1). There are various DC-to-DC converter topologies suitable to interface a fuel cell and a load. In this research, a DC-to-DC boost converter operating at a switching frequency of 50 kHz is used to step-up a 45 V dc supply of a 6-kW fuel cell to 100 V. To ensure a reliable operation of the converter, the inductor is considered 20% greater than the minimum value and the voltage ripple is 1V.
[image:2.612.84.559.170.588.2]PEM fuel cell
Figure 2. PEM fuel cell stack schematic [17]
International Journal of Emerging Technology and Advanced Engineering
Website: www.ijetae.com (ISSN 2250-2459, ISO 9001:2008 Certified Journal, Volume 7, Issue 12, December 2017)
285
Polymer Electrolyte Membrane fuel cells (PEMFC) also known as Proton Exchange fuel cells or Polymer Electrolyte Fuel cells offer the advantages of low eight and volume as compared to other fuel cell technologies, they require only hydrogen and oxygen which are combined in a cell to generate electricity with water and heat as the by-product. A simple analogy with fuel cells as opposed to batteries is the continuous supply of the reactants while that of batteries are finite.At the anode of a PEMFC, the hydrogen gas ionises releasing electrons and creating H+ as shown in equation (1), whereas at the cathode, oxygen combines with electrons taken from the electrode, and H+ from the electrolyte to form water (Equation (2)) [1] [18]
(1)
(2)
The overall reaction-taking place in a fuel cell follows the equation (3) below [10]:
⁄ (3)
The output voltage of the fuel-cell stacks can be obtained as [19] [20]:
(4)
In this equation, VFC is the fuel cell output voltage, E is
the open circuit voltage, whereas Vact, Vconc, and Vohmic are
the activation, concentration, and the ohmic fuel cell overvoltage respectively. Relationship between the voltage and the current in the cell can be modelled as [19] [20]:
( ) (
)
(5)
In which VFC is the output voltage of the fuel cell, E is
the open circuit voltage, IFC is the fuel cell output current,
IO is the exchange current, IL is the limiting current, Rint is
the internal resistance, A is the activation coefficient and B is the concentration coefficient. Furthermore, E, A, and B are dependent on the operating temperature of the fuel cell,
whereas the internal resistance Rint in the fuel cell depends
on the membrane characteristic.
[image:3.612.333.573.152.261.2]DC/DC Boost Converter
Figure 3. Boost converter circuit [21]
Boost converters (See Figure 3) convert unregulated voltages into desired regulated voltages by varying the duty
cycle at high switching frequency. The choice
of components like inductors and capacitors is very important to reduce the ripple generation for a given switching frequency. The minimum value of the inductor to ensure continuous conduction mode is given by (6) as [22] [23]:
( ) (6)
With (7)
V0 the output voltage, V the input voltage and T the
switching period
The minimum capacitance is:
(8)
A boost converter operating at a switching frequency of 50 kHz is used to step-up a 45 V dc supply of the fuel cell to 100 V. To ensure a reliable operation, the inductor is considered 20% greater than the minimum value and the voltage ripple is chosen as 1V. The converter simulation parameters are in Table 1.
Table 1. Boost converter parameters.
Parameter Value
Switching frequency 50 kHz
Inductor 1.02.10-6 H
Capacitor 26.10-4 F
Voltage ripple 1V
[image:3.612.325.564.621.708.2]International Journal of Emerging Technology and Advanced Engineering
Website: www.ijetae.com (ISSN 2250-2459, ISO 9001:2008 Certified Journal, Volume 7, Issue 12, December 2017)
286
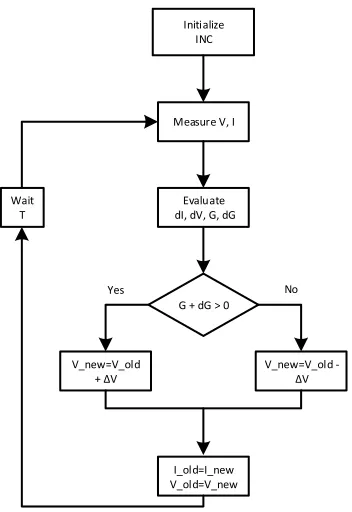
Incremental Conductance AlgorithmInitialize INC
Measure V, I
Evaluate dI, dV, G, dG
G + dG > 0
V_new=V_old + V
V_new=V_old - V
I_old=I_new V_old=V_new Wait
T
[image:4.612.62.238.158.414.2]Yes No
Figure 4. Incremental conductance algorithm flowchart [22]
The algorithm in Figure 4 compares the incremental conductance to the instantaneous conductance of the fuel cell. Depending on the result, the voltage is increased or decreased until the achievement of maximum power point. This method stands on the assumption that at the maximum power point the following condition occurs [24] [25] [26]:
( ( )) (9)
( ) (10)
Where P and V are the power and voltage respectively.
At the maximum power point, and
(11)
then V<VMPP (12)
then V=VMPP (13)
then V>VMPP
The equivalent Simulink model of the incremental conductance algorithm is shown is Figure 5.
[image:4.612.68.525.488.623.2]International Journal of Emerging Technology and Advanced Engineering
Website: www.ijetae.com (ISSN 2250-2459, ISO 9001:2008 Certified Journal, Volume 7, Issue 12, December 2017)
287
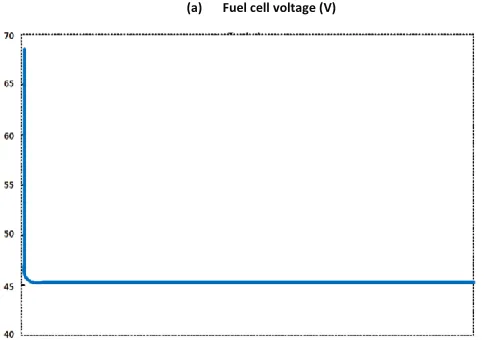
III. SIMULATION RESULTSA 6-kW PEM fuel cell block modelled using pre-defined fuel cell Simulink block, Incremental Conductance MPPT controller block combining Simulink and Matlab Simulink function block and DC-DC converter. The fuel cell considered operates in the range of voltage from 30V to 60V by controlling some parameters such as the hydrogen and oxygen compositions and flow rates, the hydrogen and oxygen pressures and the fuel cell temperature. In this simulation, the fuel cell hydrogen flow rate, hydrogen pressure and temperature are constants. Thus, the operating voltage is maintained at a constant value. Figure 6 (a) and (b) shows that the nominal input voltage and current of the fuel cell are 45 V and 130 A respectively. The voltage and current from Figure 7 (a) and (b) represent the outputs
obtained across the converter using the
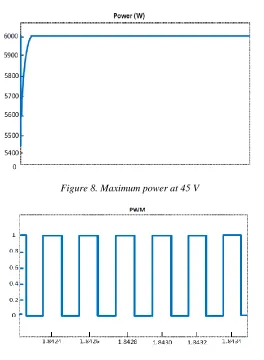
Incremental Conductance algorithm model in Figure 5. This algorithm computes the duty cycle required to produce the maximum power. This duty cycle is then used as an input for the PWM pulse generation, which is shown in the figure 9. This PWM pulse is as the IJBT gate signal of the boost converters. The voltage and current across the boost converter (See Figure 7 (a) and (b)) are 100 V and 60 A respectively. Figure 8 shows the converter’s power, which is 6 kW.
Figure 7. (a) Converter voltage; (b) Converter current (b) DC bus current (A)
(a) Fuel cell voltage (V)
Figure 6. (a) Fuel cell voltage; (b) Fuel cell current (b) Fuel cell current (A)
[image:5.612.44.287.450.620.2]International Journal of Emerging Technology and Advanced Engineering
Website: www.ijetae.com (ISSN 2250-2459, ISO 9001:2008 Certified Journal, Volume 7, Issue 12, December 2017)
288
Figure 9. PWM signalIV. CONCLUSIONS
Fuel cells display nonlinear output characteristics due to a number of internal parameters, which can cause a low efficient system operation and impact on the output voltage. Similarly to photovoltaic systems, the variations of temperature and of internal parameters in a fuel cell throughout its lifetime makes the position of the maximum power point to change, It is therefore important to constrain the system to operate at its maximum power to avoid low efficiency and excessive fuel use. To ensure that, the power converter interface must be able to self-adjust its parameters at run time, consequently modifying its input voltage and current based upon the fuel cell maximum power point position. This study was targeted to analyze
MPPT implementation on a 6 kW Low Temperature fuel cell stack (PEMFC) interfaced to a boost converter using Incremental Conductance method. The fuel cell hydrogen
flow rate, hydrogen pressure and temperature were
assumed constants. The simulation result shown the performance of the Incremental Conductance algorithm on the converter output voltage and current.
References
[1] J. Larminie and A. Dicks, Fuel cell systems explained. John Wiley & Sons Ltd, 2003.
[2] S. Mekhilef, R. Saidur, and A. Safari, ―Comparative study of different fuel cell technologies,‖ Renew. Sustain. Energy Rev., vol. 16, no. 1, pp. 981–989, 2012.
[3] A. Kirubakaran, S. Jain, and R. K. Nema, ―A review on fuel cell technologies and power electronic interface,‖ Renew. Sustain. Energy Rev., vol. 13, no. 9, pp. 2430–2440, 2009.
[4] U. Lucia, ―Overview on fuel cells,‖ Renew. Sustain. Energy Rev., vol. 30, pp. 164–169, 2014.
[5] O. Z. Sharaf and M. F. Orhan, ―An overview of fuel cell technology: Fundamentals and applications,‖ Renew. Sustain. Energy Rev., vol. 32, pp. 810–853, Apr. 2014.
[6] S. L. Chavan and D. B. Talange, ―Modeling and performance evaluation of PEM fuel cell by controlling its input parameters,‖ Energy, vol. 138, pp. 437–445, 2017.
[7] Y. Wang, K. S. Chen, J. Mishler, S. C. Cho, and X. C. Adroher, ―A review of polymer electrolyte membrane fuel cells: Technology, applications, and needs on fundamental research,‖ Appl. Energy, vol. 88, no. 4, pp. 981–1007, 2011.
[8] S. Bose, T. Kuila, T. X. H. Nguyen, N. H. Kim, K. Lau, and J. H. Lee, ―Polymer membranes for high temperature proton exchange membrane fuel cell: Recent advances and challenges,‖ Prog. Polym. Sci., vol. 36, no. 6, pp. 813–843, 2011.
[9] W. Caisheng, M. H. Nehrir, and S. R. Shaw, ―Dynamic models and model validation for PEM fuel cells using electrical circuits,‖ Energy Conversion, IEEE Trans., vol. 20, no. 2, pp. 442–451, 2005.
[10] F. Barbir, PEM Fuel Cell Theory and practice. Elsevier Academic Press, 2005.
[11] D. Rekioua, S. Bensmail, and N. Bettar, ―Development of hybrid photovoltaic-fuel cell system for stand-alone application,‖ Int. J. Hydrogen Energy, vol. 39, no. 3, pp. 1604– 1611, 2014.
[12] N. Benyahia et al., ―MPPT controller for an interleaved boost dc-dc converter used in fuel cell electric vehicles,‖ Int. J. Hydrogen Energy, vol. 39, no. 27, pp. 15196–15205, 2014.
[13] M. Becherif and D. Hissel, ―MPPT of a PEMFC based on air supply control of the motocompressor group,‖ Int. J. Hydrogen Energy, vol. 35, no. 22, pp. 12521–12530, 2010.
[14] H. Rezk and A. M. Eltamaly, ―A comprehensive comparison of different MPPT techniques for photovoltaic systems,‖ Sol. Energy, vol. 112, pp. 1–11, 2015.
[image:6.612.44.308.152.512.2][15] N. Karami, N. Moubayed, and R. Outbib, ―General review and classification of different MPPT Techniques,‖ Renew. Sustain. Energy Rev., vol. 68, no. September 2016, pp. 1–18, 2017.
International Journal of Emerging Technology and Advanced Engineering
Website: www.ijetae.com (ISSN 2250-2459, ISO 9001:2008 Certified Journal, Volume 7, Issue 12, December 2017)
289
[16] A. Mohapatra, B. Nayak, P. Das, and K. B. Mohanty, ―A review on MPPT techniques of PV system under partial shading condition,‖ Renew. Sustain. Energy Rev., vol. 80, no. February, pp. 854–867, 2017.
[17] International Energy Agency, Hydrogen & Fuel cells, Review of National R&D programs, vol. 28, no. 3. OECD Publishing, 2016.
[18] a K. Raji and M. T. E. Kahn, ―Can Fuel Cell Systems Be Efficient and Effective As Domestic Distributed Generation Units ?,‖ in Domestic Use of Energy Conference (DUE), 2003.
[19] C. Wang, M. H. Nehrir, and S. R. Shaw, ―Dynamic models and model validation for PEM fuel cells using electrical circuits,‖ IEEE Trans. Energy Convers., vol. 20, no. 2, pp. 442–451, 2005.
[20] I. S. Martín, A. Ursúa, and P. Sanchis, ―Modelling of PEM fuel cell performance: Steady-state and dynamic experimental validation,‖ Energies, vol. 7, no. 2, pp. 670–700, 2014.
[21] ―Boost Converters.‖ [Online]. Available: http://www.learnabout-electronics.org/PSU/psu32.php. [Accessed: 17-Oct-2017].
[22] N. Femia, Power electronics and control techniques for maximum energy harvesting in photovoltaic systems. 2013.
[23] S. Sumathi, L. Ashok Kumar, and P. Surekha, Solar PV and Wind Energy Conversion Systems. 2015.
[24] R. I. Putri, S. Wibowo, and M. Rifa’i, ―Maximum power point tracking for photovoltaic using incremental conductance method,‖ Energy Procedia, vol. 68, pp. 22–30, 2015.
[25] K. Visweswara, ―An investigation of incremental conductance based maximum power point tracking for photovoltaic system,‖ Energy Procedia, vol. 54, pp. 11–20, 2014.
![Figure 2. PEM fuel cell stack schematic [17]](https://thumb-us.123doks.com/thumbv2/123dok_us/8681236.874766/2.612.84.559.170.588/figure-pem-fuel-cell-stack-schematic.webp)
![Figure 3. Boost converter circuit [21]](https://thumb-us.123doks.com/thumbv2/123dok_us/8681236.874766/3.612.325.564.621.708/figure-boost-converter-circuit.webp)