A multidimensional valuation of the
human perception of construction
vibration
Noviyanti, AA and Woodcock, JS
http://dx.doi.org/10.1088/17426596/1075/1/012044
Title
A multidimensional valuation of the human perception of construction
vibration
Authors
Noviyanti, AA and Woodcock, JS
Type
Article
URL
This version is available at: http://usir.salford.ac.uk/id/eprint/49850/
Published Date
2018
USIR is a digital collection of the research output of the University of Salford. Where copyright
permits, full text material held in the repository is made freely available online and can be read,
downloaded and copied for noncommercial private study or research purposes. Please check the
manuscript for any further copyright restrictions.
1234567890 ‘’“”
Regional Conference on Acoustics and Vibration 2017 (RECAV 2017) IOP Publishing IOP Conf. Series: Journal of Physics: Conf. Series 1075 (2018) 012044 doi :10.1088/1742-6596/1075/1/012044
A multidimensional valuation of the human perception of
construction vibration
A A Noviyanti1 and J S Woodcock2
1School of Applied Science, Technology, Engineering and Mathematics, Prasetiya
Mulya University, Tangerang, Indonesia
2Acoustics Research Centre, University of Salford, Greater Manchester, United
Kingdom
E-mail: [email protected]
Abstract. Previous studies have shown that annoyance due to vibration does not simply depend on the magnitude of vibration exposure. However, only little is known about the important features that contribute the human perception of vibration. This paper presents a
study investigating seated subjects’ perception of construction induced groundborne vibration
in the vertical direction with the method of multidimensional scaling. The investigation was conducted using a paired comparison subjective test. Sixteen subjects were asked about their perception of the annoyance and similarity of sixty-six pairs of vibration stimuli. Through non-metric multidimensional scaling analysis, it is presented that the perception of construction vibration activities are dependent on up to three perceptual dimensions: duration of the signal,
vibration energy in the 31.5 Hz of ⅓ octave band, and the centre of mass of the frequency spectrum of the signals. A regression model was built from the relationship between the annoyance ratings and the objective descriptors revealed through the multidimensional scaling analysis. This model was found to describe 79% of the variance in the measured perceived annoyance ratings data with p-level < 0.01.
1. Introduction
Vibration can be sensed by human through the auditory, visual and nervous system. The potential effects of vibration exposure depend on many factors, including the characteristics of the motion, the characteristics of the exposed person, activities of the exposed person and other aspects of the environment. These factors can come together to influence how the vibration is perceived and may cause annoyance, discomfort, activity disturbance, impaired health or motion sickness [1]. Exposure-response relationships are an important guidance for policy makers and planners to give permission of the area where the population is growing in an environment.
2 1234567890 ‘’“”
Regional Conference on Acoustics and Vibration 2017 (RECAV 2017) IOP Publishing IOP Conf. Series: Journal of Physics: Conf. Series 1075 (2018) 012044 doi :10.1088/1742-6596/1075/1/012044
The investigation of subjective response to combined noise and vibration exposure from railways [6][7] exposed that the magnitude of noise exposure had a significant effect on the judgment of annoyance caused by vibration. On the other hand, there was no significant effect of vibration exposure on the judgment of annoyance caused by exposure to noise. Another study of combined effects of railway induced vibration and noise [8], was found that vibration did not affect noise annoyance, but the total annoyance caused by combined noise and vibration was extremely greater than the annoyance caused by noise alone. Exposure to vibration from environmental sources such as railways and construction activities is considered giving effects such as annoyance and sleep disturbance. Another studies of the human perception of noise and vibration also investigated about multidimensional phenomenon that can be explained by multiple objective parameters that establish a perceptual space, using a technique known as multidimensional scaling. Recently studies focused on the perception of vibration of railway activities were conducted [9] and combined noise and vibration of railway activities [10] has given good results of perceptual dimensions and its relationship with the objective features of the stimuli. This study presented in this paper explores the dimensions of the construction activities generated groundborne vibration and how these perceptual dimensions relate to annoyance.
2. Subjective Test Design and Method
2.1 Stimuli
The University of Salford in the United Kingdom conducted a research project into the human response to environmental vibration funded by Department for Environment, Food, and Rural Affairs (DEFRA) [11]. In this project, measurements of vibration from construction activities were made close to the construction of a new light rail systems; the measured activities included digging, piling, breaking, moving, starting, stopping, loading, and unloading [12]. Twelve representative vibration events were selected from these data to be used as stimuli for the test described in this section.
2.2 Test Setup
The test set up used a transducer (Buttkicker LFE) to reproduce vibration, rigidly attached to the underside of a chair with four bolts. The transducer is an electro-dynamic shaker powered by a 1000 W amplifier. The reproduced vibration was measured by seat pad accelerometer Svantek SV38 with a sensitivity of 100 mV/(m/s2) connected to Svantek 957 sound and vibration analyser. The accelerometer was placed above the chair when the stimuli was played. The vibration were reproduced at vertical direction and at levels that comfortable for the subjects and to produce VDV less than number stated in BS 7085:1989, with total daily exposure of whole body vibration for a human subjects should not exceeds a VDV of 15 m/s1.75[13].
2.3 Subjective Test
The subjective test took place in Semi-Anechoic Chamber in University of Salford. Sixteen subjects participated in the paired comparison test using twelve stimuli. Subjects were asked to maintain a comfortable upright posture throughout the test. One paired comparison of the vibration was played before the test in order to allow the subjects familiarize to the stimuli and the interface.
Participants were played every possible unique pairing of the twelve stimuli. The ordering of the stimuli used in the subjective test was randomised according to a Ross series [14] that ensures the greatest separation of pairs with common stimuli [15], for each pair they were asked to make a judgement on:
1. Which of the vibrations would bother, disturb or annoy you most if you felt them in your own home?
2. How similar do you perceive the pair of vibrations to be?
1234567890 ‘’“”
Regional Conference on Acoustics and Vibration 2017 (RECAV 2017) IOP Publishing IOP Conf. Series: Journal of Physics: Conf. Series 1075 (2018) 012044 doi :10.1088/1742-6596/1075/1/012044
and 0 (very similar) to 1 (very different) for question 2. The option of “Neither” was included as it has
been shown in paired comparison tests to assess sound quality that allowing a tie minimises circular errors [16].
3. Subjective Test Results
3.1. Single figure perceived annoyance ratings
Single figure annoyance ratings were calculated from the paired comparison of annoyance data using the following formula:
=∑, (1)
where Aavis the average perceived annoyance ratings for subject with stimulus i, N is the number of subject and Aj,i,is the summation of paired comparison of annoyance rating for stimuli i and j across the subject group. Calculation of single figure annoyance scores are using this method assumes that perceived annoyance scores are based on an interval level psychological scale. This method was utilised previously in the estimation of single figure merit scores in sound quality tests of car door closures [17] and to estimate a single figure annoyance for comparing annoyance due to railway vibration [9].
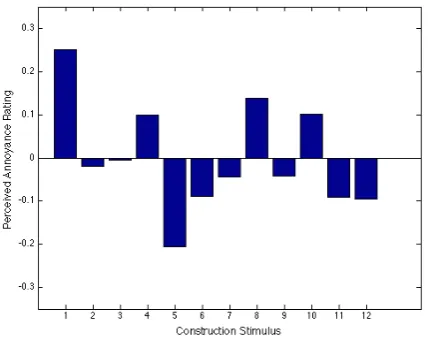
Figure 1 shows the single figure annoyance scores calculated using this method for each of the twelve construction vibration stimuli. An ANOVA of the single figure perceived annoyance ratings for each subject showed that there are no significant differences between the subject’s ratings (p-level
= 0.29). A high score indicates a high degree of annoyance. The overall magnitude between the models of annoyance cannot be known. However, it is clear that stimulus 1 has been judged to be most annoying stimuli.
Figure 1. Perceived annoyance ratings of twelve construction stimuli.
3.2. Multidimensional perception of dissimilarity judgments
Multidimensional scaling (MDS) is a method that represents measurements of similarity (or dissimilarity) among pairs of object [18]. It develops a configuration of a set of stimuli in an multidimensional space to provide a representation of pairwise (dis)similarities and also psychological distances between the stimuli.
[image:4.595.74.292.417.587.2]4 1234567890 ‘’“”
Regional Conference on Acoustics and Vibration 2017 (RECAV 2017) IOP Publishing IOP Conf. Series: Journal of Physics: Conf. Series 1075 (2018) 012044 doi :10.1088/1742-6596/1075/1/012044
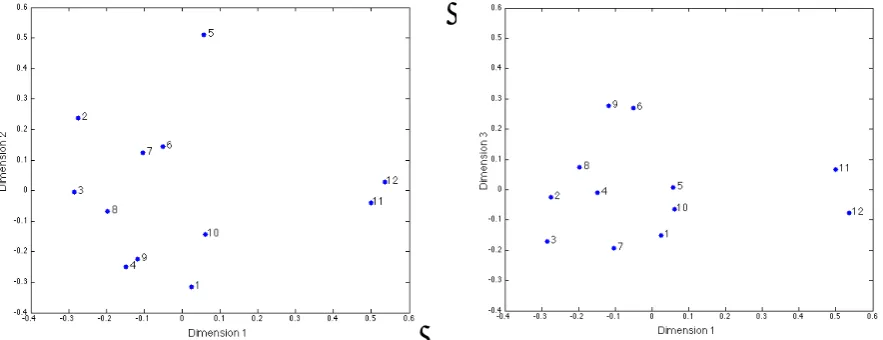
[image:5.595.77.519.203.373.2]The three dimensional non-metric MDS solution is shown in figure 2. Each point in the group space represents one of the twelve construction vibration stimuli. It can be seen in the figure that the stimuli are fairly distributed across all dimensions, even tough stimuli number 11 and 12 are separate in dimension 1. However, both stimuli are not separate from other stimuli in other dimensions. It can be concluded all subjects made their judgments based upon the full continuum of each perceptual dimension rather than simply categorise the stimuli.
Figure 2. Three dimensional non-metric multidimensional scaling configuration.
3.3. Interpretation of the perceptual space
[image:5.595.115.481.523.629.2]All the objective parameters analysed for the subjective test were including the crest factor and duration defined by the 10 dB down points of the signal envelope, spectral centroid and the maximum frequency, vibration dose value, RMS acceleration, and peak acceleration. These energy descriptors were also calculated with the application of the Wb frequency weighting, discussed in BS 6472-1:2008 [20]. The vibration dose value was calculated based on standard described in BS 2631-1:1997 [21].
Table 1. Pearson’s correlation coefficient between parameter of construction
signals of three perceptual dimensions. * p-level < 0.05. ** p-level < 0.01.
Parameter Dimension 1 Dimension 2 Dimension 3
Spectral centroid -- -- 0.505
10 dB down points duration - 0.843** --
--fmax -- - 0.614*
--fmax Wb 0.841** --
--RMS acceleration -- 0.845**
--RMS acceleration Wb -- 0.882**
--Correlation is the commonly used approach when there are many measures of association of variables. Evans [22] suggests the strength of correlations for absolute Pearson’s correlation
coefficient, usually used for interval or ratio level scales. Table 1 shows the Pearson’s correlation
coefficient between objective parameters of the vibration stimuli and the positions of the stimuli in a three dimensional MDS solution.
4. Model for predicting annoyance due to construction vibration
1234567890 ‘’“”
Regional Conference on Acoustics and Vibration 2017 (RECAV 2017) IOP Publishing IOP Conf. Series: Journal of Physics: Conf. Series 1075 (2018) 012044 doi :10.1088/1742-6596/1075/1/012044
combined railway noise and vibration [10] found that the effects of the stimuli could be investigated by multiple linear regression analysis. Multiple linear regression is a technique which can derive a model whereby several predictor variables are used to model a single response variable [23].
Figure 3. Comparison of measured single figure annoyance ratings from the subjective test and those predicted using equation 2.
Based on these consideration, dimension 1 is influenced by the temporal aspect of the signals, which is 10 dB downpoints duration; dimension 2 is influenced by the energy of the signals, which is 31.5 Hz 1/3 octave band Wb weighted RMS acceleration; dimension 3 is influenced by the frequency
content of the signal, which is spectral centroid. The multiple linear regressions were computed using the perceived annoyance ratings as the dependent variable and three possible parameters that have a highest correlation with the perceptual dimensions as independent variables is presented in equation 2.
= 0.9583 + 0.0064− 0.8171.− 0.0201 (2)
where A is predicted annoyance, T10dB is duration of 10 dB down points, RMSWb31.5is the Wb weighted
RMS acceleration 31.5 Hz, Sc is spectral centroid. Figure 3 shows an excellent agreement between measured single figure annoyance scores and those predicted using equation 2 (R2 = 0.798, p-level <
0.01). This calculation suggests that these perceived annoyance rating model shows 79% variance of the data of annoyance. The Pearson’s correlation coefficient between the annoyance ratings measured
in the subjective test and the annoyance ratings predicted by the model was 0.89. The parameter the
T10dB is failed to reach the significant level (p-level = 0.12), the RMSWb31.5is significant to 0.01 level, and Sc is significant to 0.05 level.
5. Summary
This paper presents analysis of the results of paired comparison subjective test design to investigate the perception of construction vibration. Using the method of multidimensional scaling, the perception of construction vibration is influenced by three perceptual dimensions. The first perceptual dimension was influenced by temporal characteristic and described by the duration of the signal, which is 10 dB down points of the signal. The second perceptual dimension was found to be related to vibration energy in the 31.5 Hz third octave band. The third perceptual dimension was influenced by frequency content described by centre mass of the frequency spectrum of the signals, which is spectral centroid.
The objective descriptors revealed through the multidimensional scaling analysis were related to these annoyance ratings via a multiple linear regression model. The Pearson’s correlation coefficient
[image:6.595.70.285.166.365.2]6 1234567890 ‘’“”
Regional Conference on Acoustics and Vibration 2017 (RECAV 2017) IOP Publishing IOP Conf. Series: Journal of Physics: Conf. Series 1075 (2018) 012044 doi :10.1088/1742-6596/1075/1/012044
6. References
[1] Griffin M J 1996 Handbook of human vibration London: Academic Press Limited
[2] Klæboe R, Turunen-Rise I, Hårvik L and Madshus C 2003 Vibration in dwellings from road and rail traffic — part II: exposure–effect relationships based on ordinal logit and logistic regression models Applied Acoustics. 64 89 - 109
[3] Gidlöf-Gunnarsson A, Ögren M, Jerson T and Ohrström E 2012 Railway noise annoyance and the importance of number of trains, ground vibration, and building situational factors.Noise & Health. 14 190 - 201
[4] Zapfe J, Saurenman H and Fidell S 2009
Ground-borne noise and vibration in buildings
caused by rail transit
Contractor’s
final report for TCRP Project D-12
[5] Sica G, Peris E, Woodcock J, Moorhouse A and Waddington D 2013 Design of measurement methodology for the evaluation of human exposure to vibration in residential environments
Science of the Total Environment In Press. 482-3 461 - 71
[6] Howarth H V C and Griffin M J 1990 Subjective response to combined noise and vibration: summation and interaction effects Journal of Sound and Vibration143 443 - 54
[7] Howarth H V C and M J Griffin: 1990 The relative importance of noise and vibration from railways Applied Ergonomics21 129 - 34.
[8] Lee P J and Griffin M J 2013 Combined effect of noise and vibration produced by high-speed trains on annoyance in buildings Journal of the Acoustical Society of America133 2126 - 35 [9] Woodcock J, Moorhouse A and Waddington D 2014 A Multidimensional Evaluation of the
Perception and Annoyance Caused by Railway Induced Ground-borne Vibration Acta
Acustica United with Acustica 100 614 - 27
[10] Sharp C, Woodcock J and Waddington D 2014Considering the perception of combined railway noise and vibration as a multidimensional phenomenon Inter noise 249 888 - 97
[11] Waddington D, Moorhouse A, Steele A, Woodcock J, et al 2011 Human response to vibration in residential environments (NANR209) Final Project Report London : DEFRA
[12] Waddington D C, Woodcock, J, Peris E, Condie J, Sica G, Moorhouse A T and Steele A 2014 Human response to vibration in residential environments The Journal of the Acoustical Society of America. 135(1) 182 - 93
[13] British Standards Institution BS 7085:1989 Guide to safety aspects of experiments in which people are exposed to mechanical vibration and shock
[14] Ross R T 1934 Optimum orders for the presentation of pairs in the method of paired comparisons Journal of Educational Psychology25 375 - 82
[15] David, H A 1988 The method of paired comparisons 2nd ed (London, UK : C. Griffin)
[16] Parizet E 2002 Paired comparison listening tests and circular error rates Acta Acustica United with Acustica88 594 - 98
[17] Parizet E, Guyader E and Nosulenko V 2008 Analysis of car door closing sound quality Applied Acoustics. 69(1) 12–22
[18] Groenen P and Borg I 2005
Modern multidimensional scaling : Theory and application
2nd ed (New York : Springer)
[19] Kruskal J B 1964 Multidimensional scaling by optimizing goodness of fit to a nonmetric hypothesis Psychometrika 29(1) 1–27
[20] British Standards Institution BS 6472-1:2008 Guide to evaluation of human exposure to vibration in buildings - part 1: vibration sources other than blasting
[21] British Standards Institution BS ISO 2631-1:1997 Mechanical vibration and shock — evaluation of human exposure to whole-body vibration - part 1: general requirements
[22] Evans J D 1996 Straightforward statistics for the behavioral sciences (Pacific Grove, CA: Brooks/Cole Publishing)